| Param | Original file | Final file |
|---|---|---|
| Filename | modeM0/AS1T03_070T04_9000002638_17743cztM0_level2.evt | modeM0/AS1T03_070T04_9000002638_17743cztM0_level2_quad_clean.evt |
| Size (bytes) | 342,233,280 | 57,614,400 |
| Size | 326.4 MB | 54.9 MB |
| Events in quadrant A | 2,218,645 | 360,825 |
| Events in quadrant B | 2,300,997 | 370,207 |
| Events in quadrant C | 2,342,817 | 351,150 |
| Events in quadrant D | 3,188,394 | 338,494 |
| Mode SS | |||
|---|---|---|---|
| Quadrant | BADHDUFLAG | Total packets | Discarded packets |
| A | 0 | 94 | 0 |
| B | 0 | 94 | 0 |
| C | 0 | 94 | 0 |
| D | 0 | 94 | 0 |
| Mode M9 | |||
|---|---|---|---|
| Quadrant | BADHDUFLAG | Total packets | Discarded packets |
| A | 0 | 12 | 0 |
| B | 0 | 12 | 0 |
| C | 0 | 12 | 0 |
| D | 0 | 12 | 0 |
| Mode M0 | |||
|---|---|---|---|
| Quadrant | BADHDUFLAG | Total packets | Discarded packets |
| A | 0 | 9679 | 2 |
| B | 0 | 9844 | 1 |
| C | 0 | 9790 | 1 |
| D | 0 | 12792 | 1 |
| Quadrant | Total seconds | Saturated seconds | Saturation percentage |
|---|---|---|---|
| A | 4606 | 23 | 0.499349% |
| B | 4606 | 34 | 0.738168% |
| C | 4606 | 43 | 0.933565% |
| D | 4606 | 89 | 1.932262% |
Noise dominated data is calculated using 1-second bins in cleaned event files. If a bin has >2000 counts, and if more than 50% of those come from <1% of pixels, then it is considered to be noise-dominated and hence unusable.
| Quadrant | # 1 sec bins | Bins with >0 counts | Bins with >2000 counts | High rate bins dominated by noise | Noise dominated (total time) | Noise dominated (detector-on time) | Marked lightcurve |
|---|---|---|---|---|---|---|---|
| A | 5826 | 4607 | 0 | 0 | 0.00% | 0.00% | 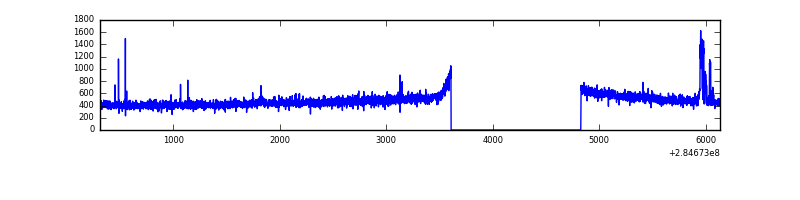 |
| B | 5826 | 4607 | 5 | 5 | 0.09% | 0.11% | 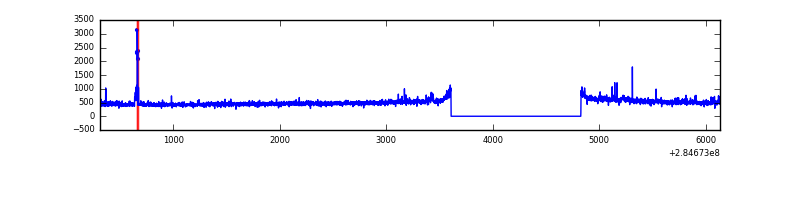 |
| C | 5826 | 4607 | 0 | 0 | 0.00% | 0.00% | 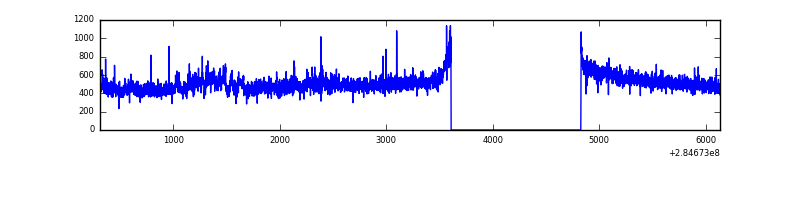 |
| D | 5826 | 4607 | 65 | 65 | 1.12% | 1.41% | 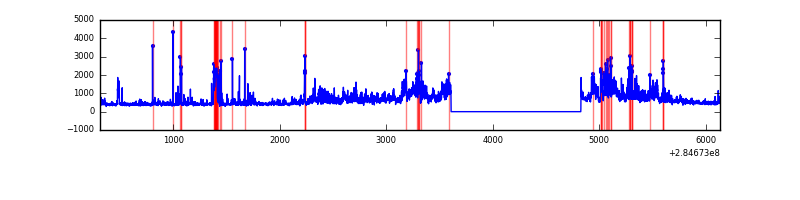 |
Top three noisy pixels from each quadrant. If the there are fewer than three noisy pixels in the level2.evt file, extra rows are filled as -1
| Pixel properties | Quadrant properties | ||||||
|---|---|---|---|---|---|---|---|
| Quadrant | DetID | PixID | Counts | Sigma | Mean | Median | Sigma |
| A | 15 | 174 | 49959 | 437.23 | 558 | 546 | 113.0 |
| A | 15 | 191 | 19801 | 170.38 | 558 | 546 | 113.0 |
| A | 0 | 226 | 4960 | 39.06 | 558 | 546 | 113.0 |
| B | 0 | 219 | 41182 | 383.27 | 562 | 549 | 106.0 |
| B | 10 | 247 | 23148 | 213.17 | 562 | 549 | 106.0 |
| B | 0 | 229 | 16786 | 153.16 | 562 | 549 | 106.0 |
| C | 14 | 238 | 84974 | 661.0 | 542 | 548 | 127.7 |
| C | 3 | 233 | 79083 | 614.88 | 542 | 548 | 127.7 |
| C | 5 | 218 | 42088 | 325.23 | 542 | 548 | 127.7 |
| D | 1 | 52 | 937399 | 6429.2 | 535 | 524 | 145.7 |
| D | 7 | 238 | 139042 | 950.56 | 535 | 524 | 145.7 |
| D | 13 | 168 | 35304 | 238.67 | 535 | 524 | 145.7 |
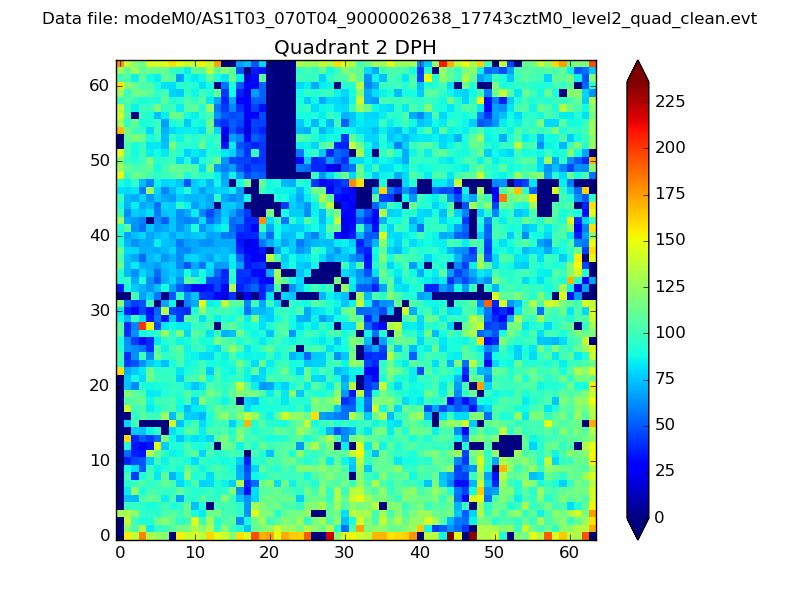
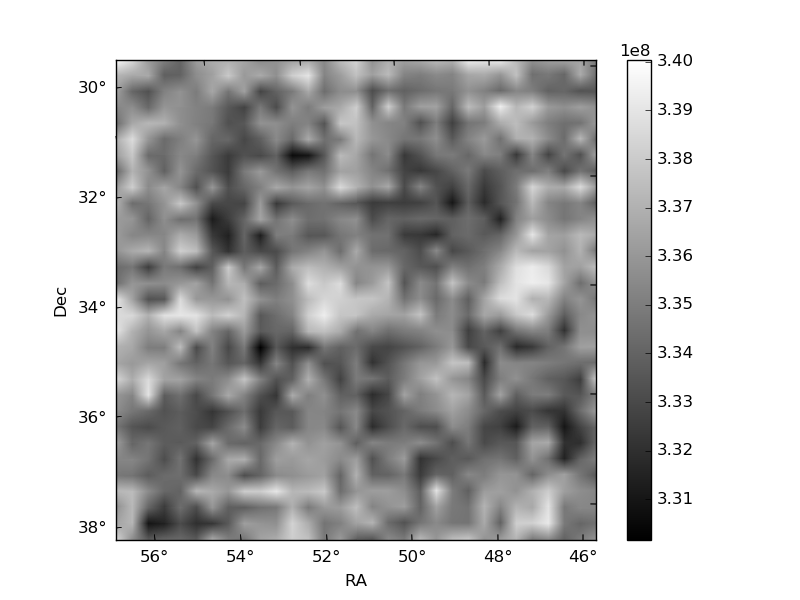
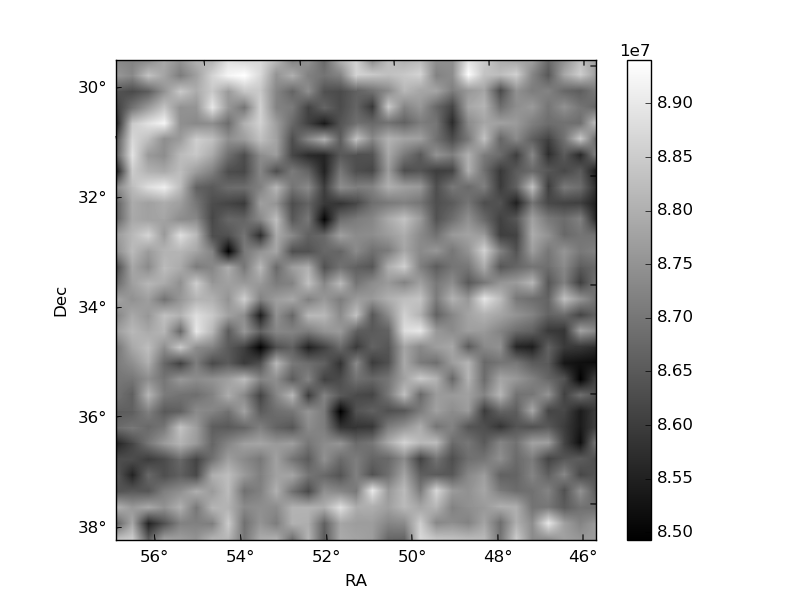
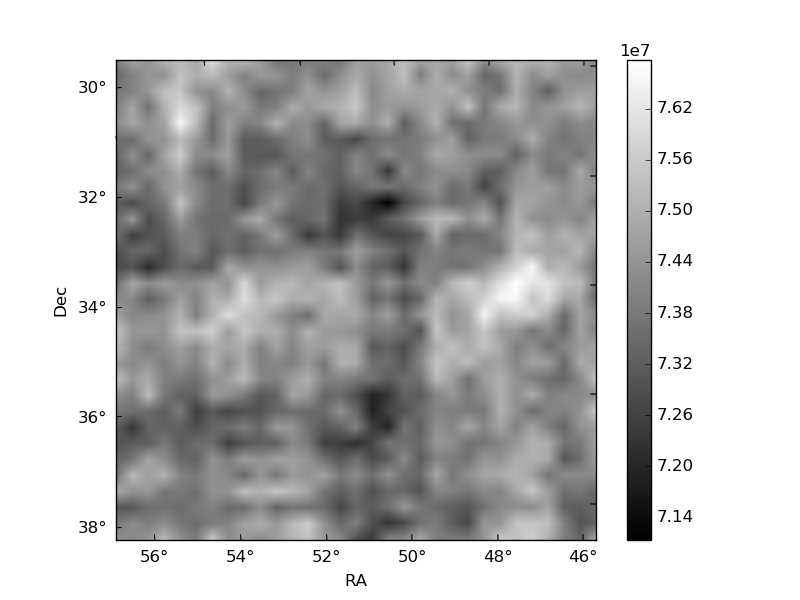
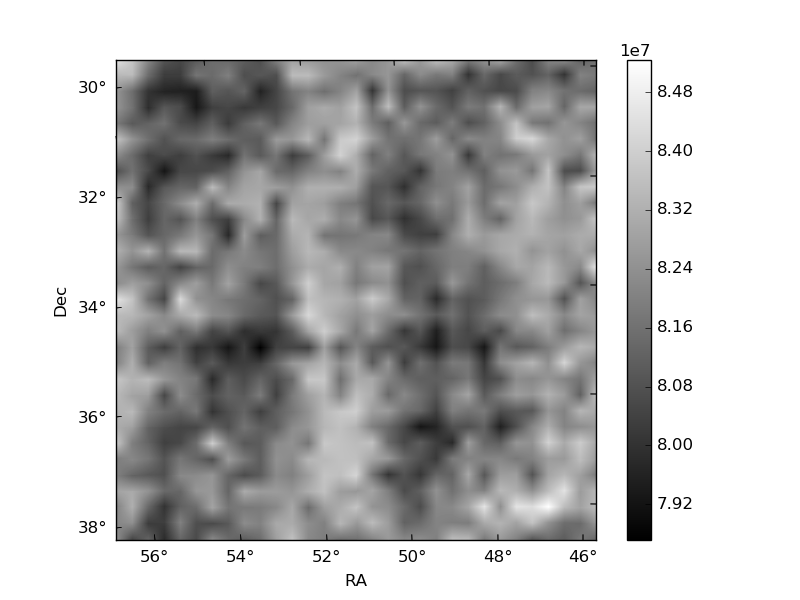
Histogram calculated using DETX and DETY for each event in the final _common_clean file
| Quadrant A | 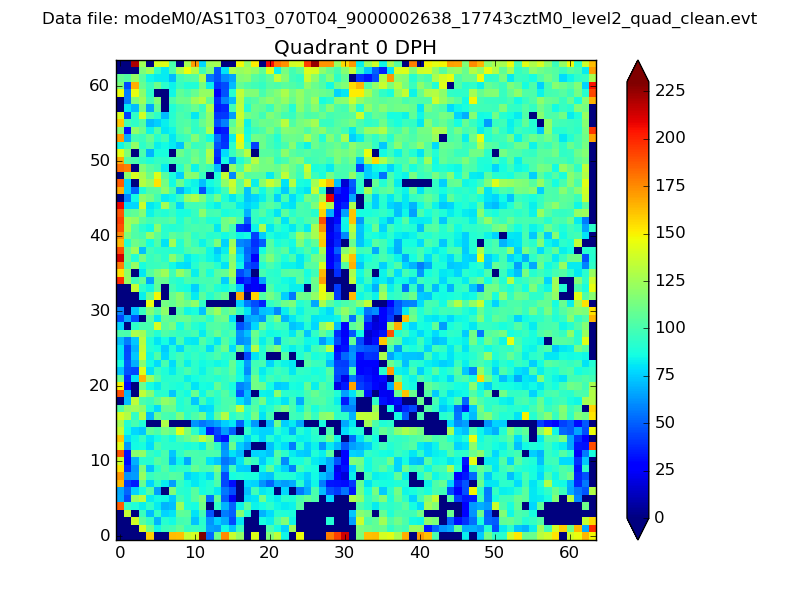 |
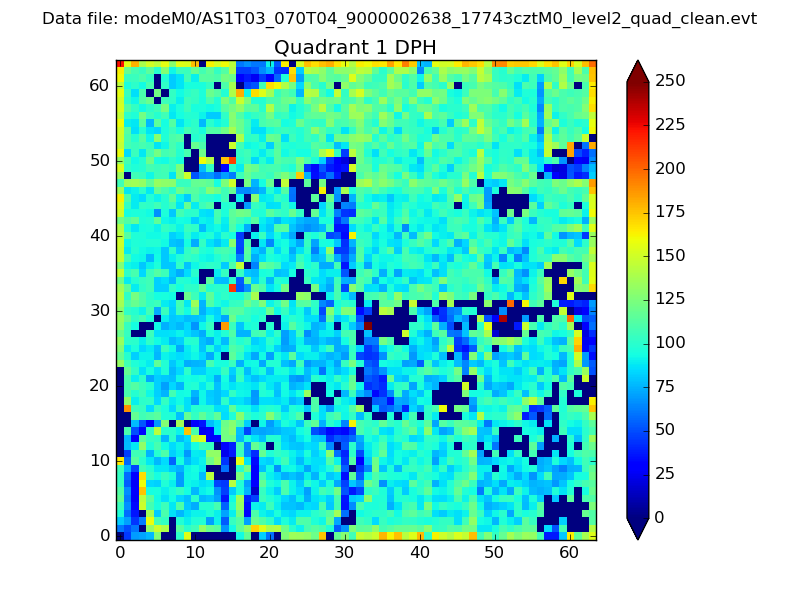 |
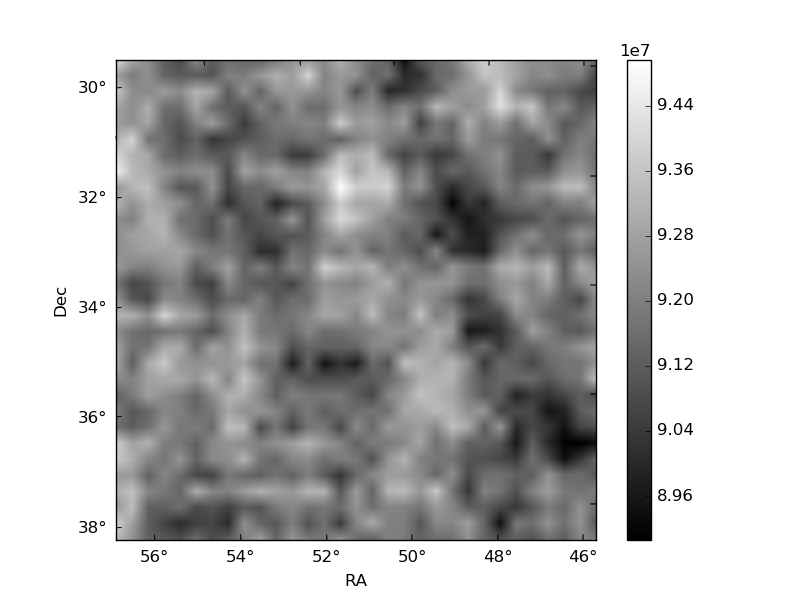
Quadrant B |
|---|---|---|---|
| Quadrant D | 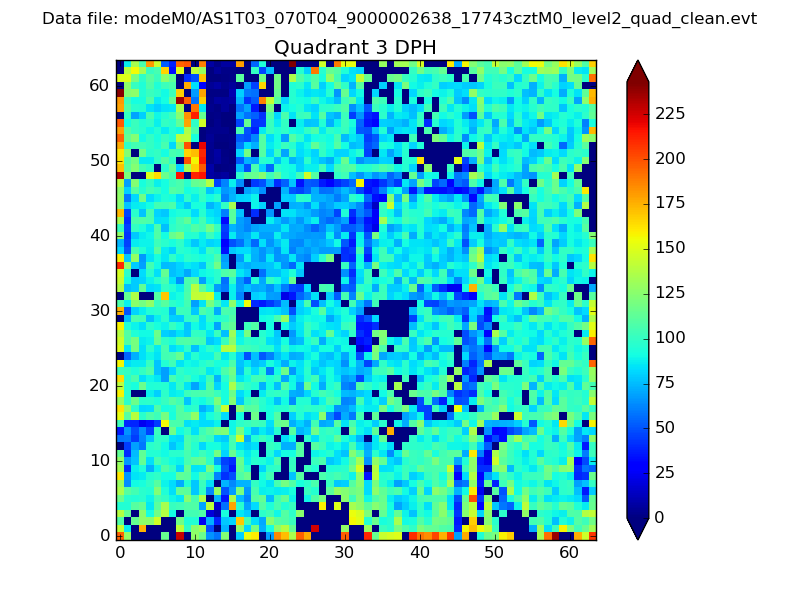 |
 |
Quadrant C |
| Plot type | Count rate plots | Images |
|---|---|---|
| Comparison with Poisson distribution Blue bars denote a histogram of data divided into 1 sec bins. Red curve is a Poisson curve with rate = median count rate of data. |
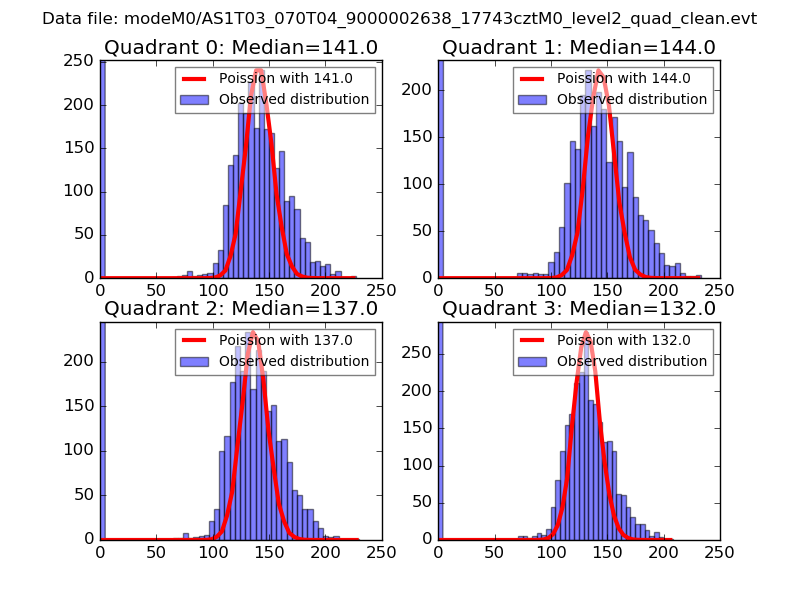 |
 |
| Quadrant-wise count rates Data is divided into 100 sec bins |
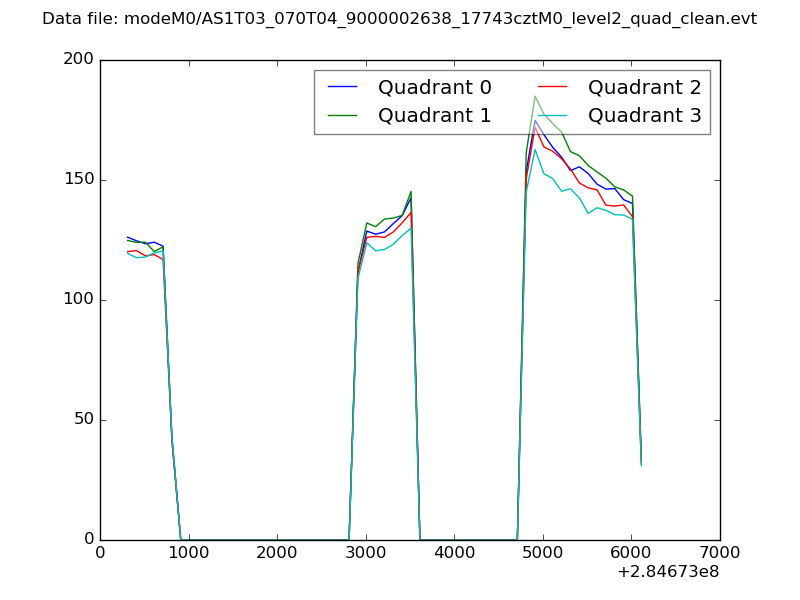 |
|
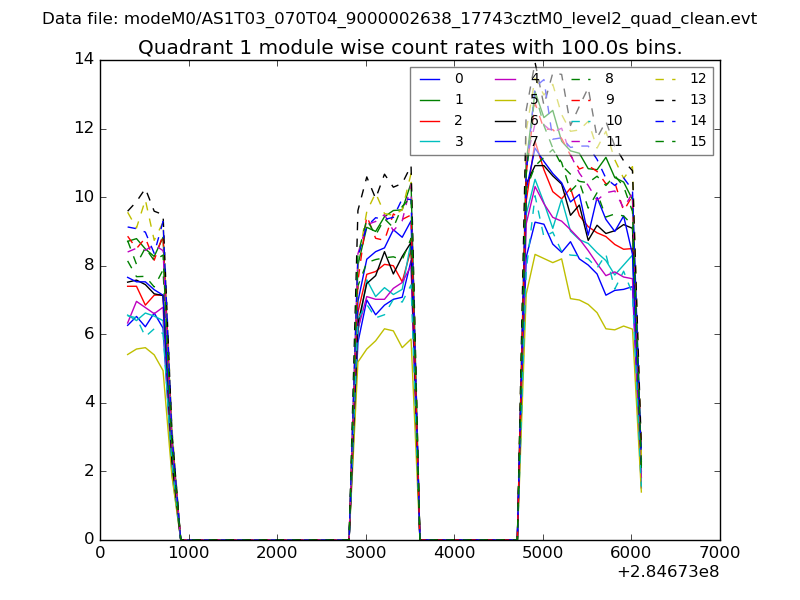
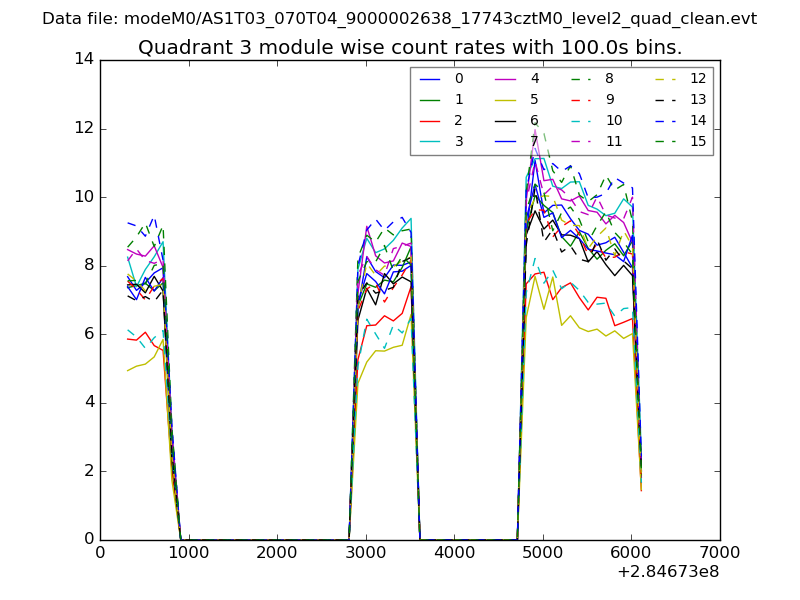
| Module-wise count rates for Quadrant A Data is divided into 100 sec bins |
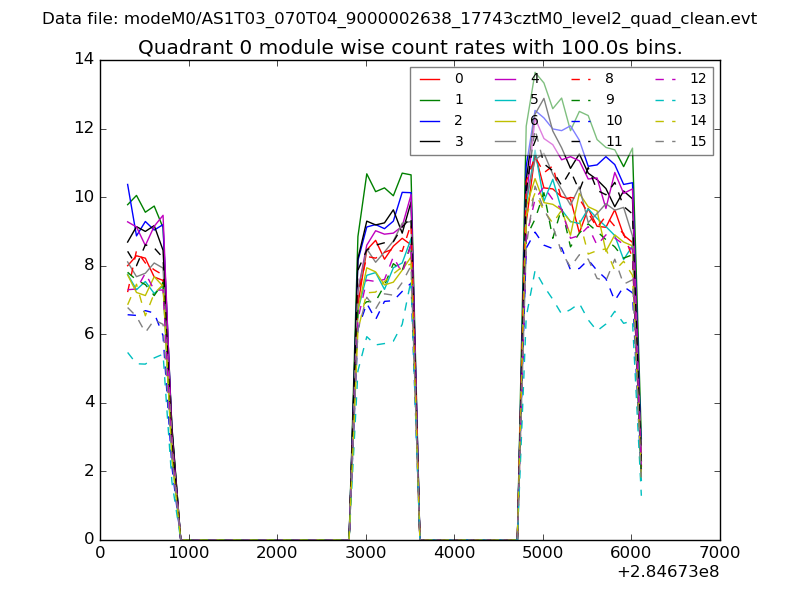 |
 |
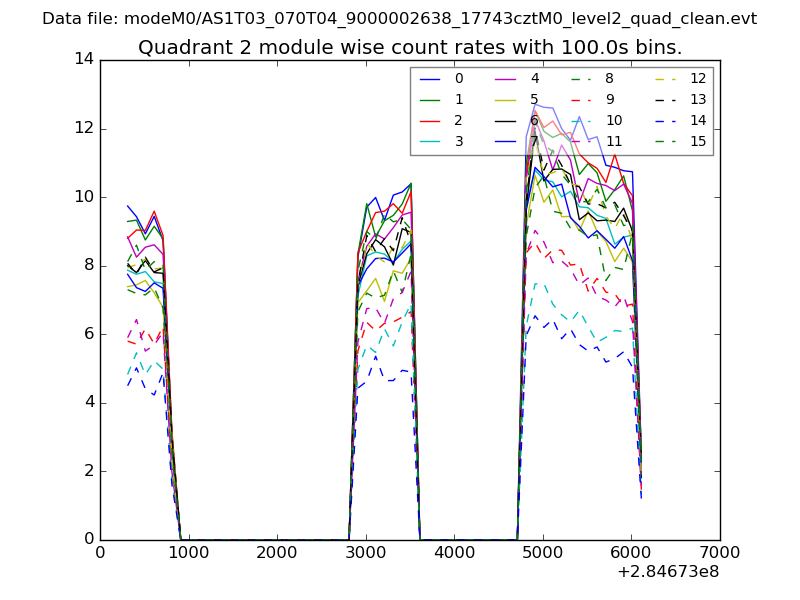
| Module-wise count rates for Quadrant B Data is divided into 100 sec bins |
 |
 |
| Module-wise count rates for Quadrant C Data is divided into 100 sec bins |
 |
 |
| Module-wise count rates for Quadrant D Data is divided into 100 sec bins |
 |
 |
| Parameter | Plot |
|---|---|
| CZT HV Monitor | 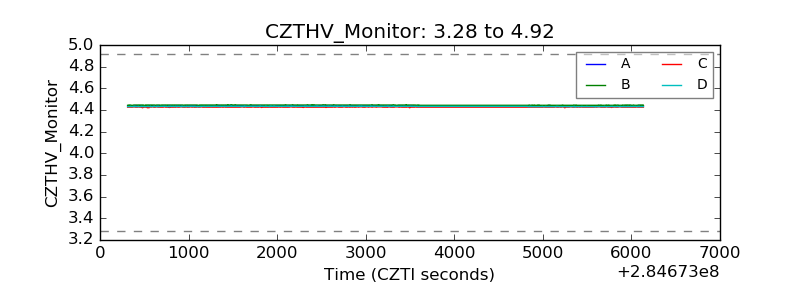 |
| D_VDD |  |
| Temperature 1 | 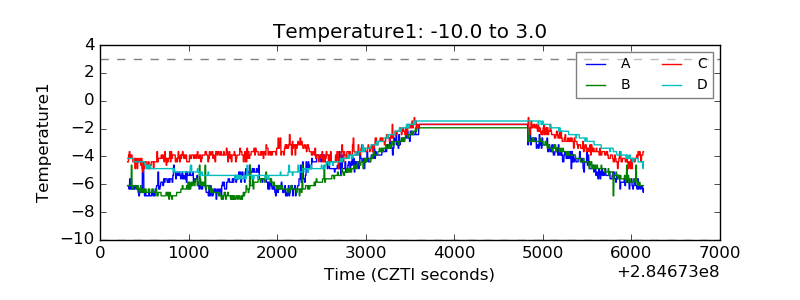 |
| Veto HV Monitor | 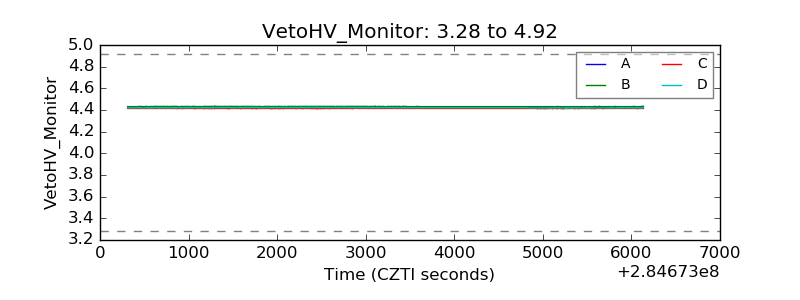 |
| Veto LLD | 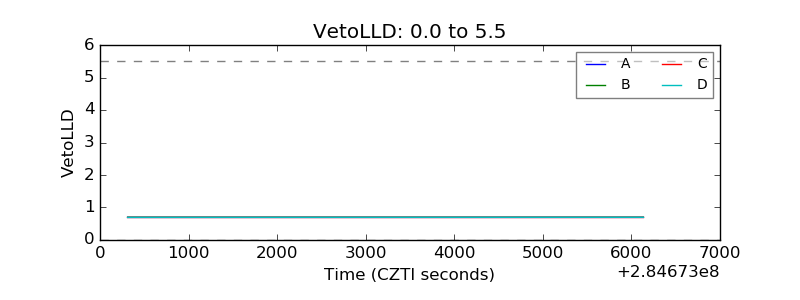 |
| Alpha Counter | 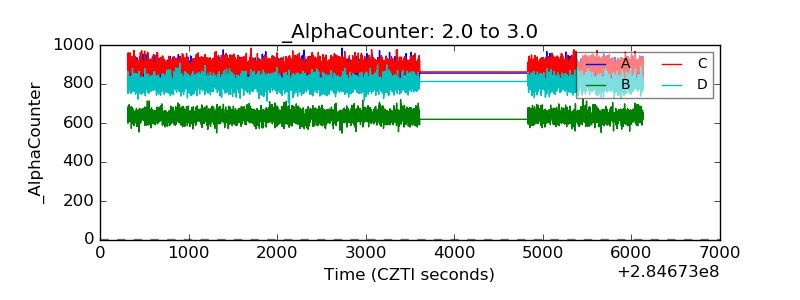 |
| _CPM_Rate | 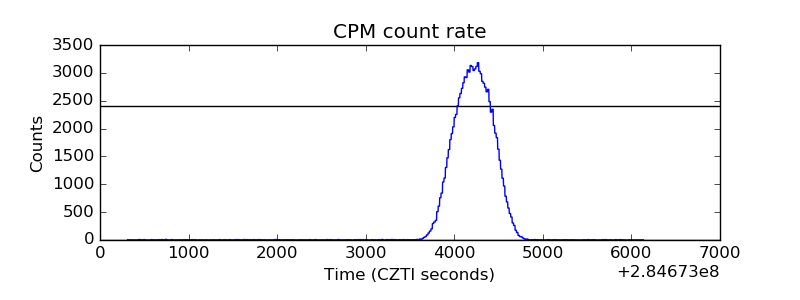 |
| CZT Counter | 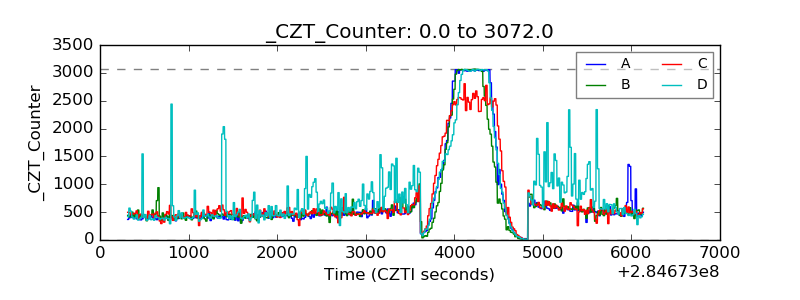 |
| +2.5 Volts monitor |  |
| +5 Volts monitor |  |
| _ROLL_ROT |  |
| _Roll_DEC | 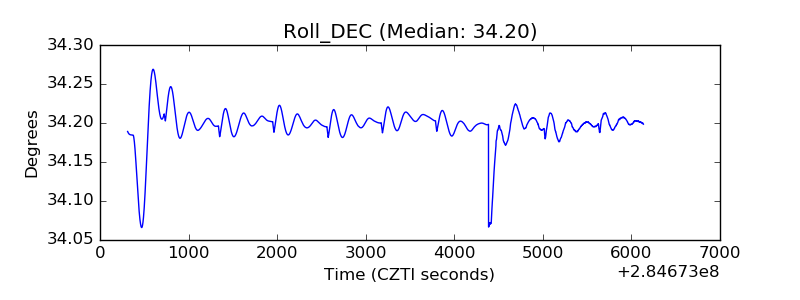 |
| _Roll_RA | 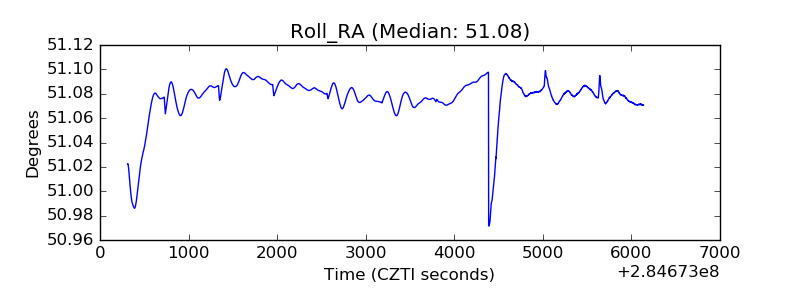 |
| Veto Counter | 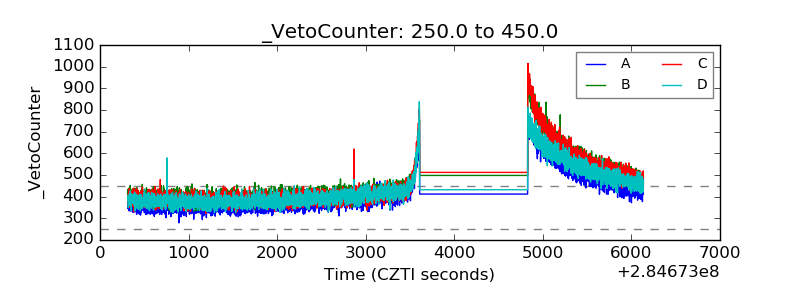 |