| Param | Original file | Final file |
|---|---|---|
| Filename | modeM0/AS1T03_070T04_9000002638_17744cztM0_level2.evt | modeM0/AS1T03_070T04_9000002638_17744cztM0_level2_quad_clean.evt |
| Size (bytes) | 738,555,840 | 124,061,760 |
| Size | 704.3 MB | 118.3 MB |
| Events in quadrant A | 6,185,621 | 783,016 |
| Events in quadrant B | 4,839,888 | 807,346 |
| Events in quadrant C | 4,869,387 | 764,576 |
| Events in quadrant D | 5,824,738 | 739,022 |
| Mode SS | |||
|---|---|---|---|
| Quadrant | BADHDUFLAG | Total packets | Discarded packets |
| A | 0 | 194 | 0 |
| B | 0 | 194 | 0 |
| C | 0 | 194 | 0 |
| D | 0 | 194 | 0 |
| Mode M9 | |||
|---|---|---|---|
| Quadrant | BADHDUFLAG | Total packets | Discarded packets |
| A | 0 | 26 | 0 |
| B | 0 | 26 | 0 |
| C | 0 | 26 | 0 |
| D | 0 | 26 | 0 |
| Mode M0 | |||
|---|---|---|---|
| Quadrant | BADHDUFLAG | Total packets | Discarded packets |
| A | 0 | 24720 | 1 |
| B | 0 | 20571 | 1 |
| C | 0 | 20310 | 1 |
| D | 0 | 24013 | 1 |
| Quadrant | Total seconds | Saturated seconds | Saturation percentage |
|---|---|---|---|
| A | 9574 | 467 | 4.877794% |
| B | 9574 | 62 | 0.647587% |
| C | 9573 | 79 | 0.825238% |
| D | 9573 | 118 | 1.232633% |
Noise dominated data is calculated using 1-second bins in cleaned event files. If a bin has >2000 counts, and if more than 50% of those come from <1% of pixels, then it is considered to be noise-dominated and hence unusable.
| Quadrant | # 1 sec bins | Bins with >0 counts | Bins with >2000 counts | High rate bins dominated by noise | Noise dominated (total time) | Noise dominated (detector-on time) | Marked lightcurve |
|---|---|---|---|---|---|---|---|
| A | 12119 | 9576 | 425 | 425 | 3.51% | 4.44% |  |
| B | 12119 | 9576 | 15 | 15 | 0.12% | 0.16% | 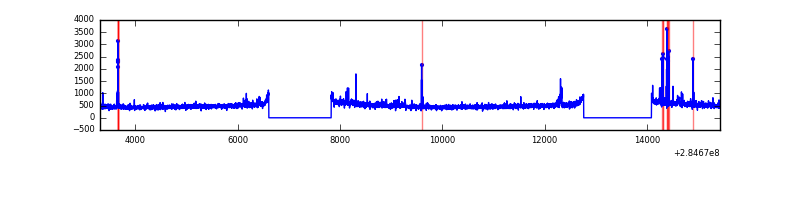 |
| C | 12118 | 9575 | 1 | 1 | 0.01% | 0.01% | 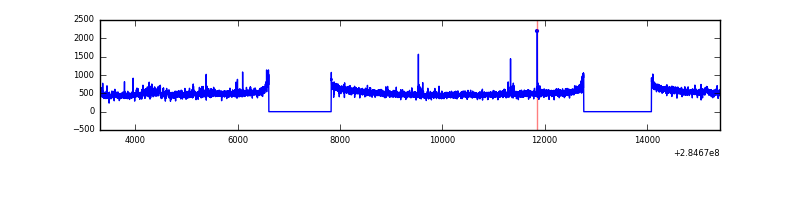 |
| D | 12118 | 9575 | 79 | 79 | 0.65% | 0.83% |  |
Top three noisy pixels from each quadrant. If the there are fewer than three noisy pixels in the level2.evt file, extra rows are filled as -1
| Pixel properties | Quadrant properties | ||||||
|---|---|---|---|---|---|---|---|
| Quadrant | DetID | PixID | Counts | Sigma | Mean | Median | Sigma |
| A | 15 | 174 | 1700563 | 7357.65 | 1153 | 1128 | 231.0 |
| A | 15 | 191 | 40672 | 171.2 | 1153 | 1128 | 231.0 |
| A | 0 | 226 | 10166 | 39.13 | 1153 | 1128 | 231.0 |
| B | 0 | 219 | 76642 | 344.3 | 1180 | 1153 | 219.3 |
| B | 10 | 245 | 62735 | 280.87 | 1180 | 1153 | 219.3 |
| B | 0 | 230 | 31659 | 139.13 | 1180 | 1153 | 219.3 |
| C | 14 | 238 | 177941 | 668.83 | 1136 | 1146 | 264.3 |
| C | 3 | 233 | 118167 | 442.7 | 1136 | 1146 | 264.3 |
| C | 5 | 218 | 90652 | 338.61 | 1136 | 1146 | 264.3 |
| D | 1 | 52 | 1109602 | 3750.63 | 1123 | 1102 | 295.6 |
| D | 7 | 238 | 155615 | 522.8 | 1123 | 1102 | 295.6 |
| D | 13 | 168 | 111659 | 374.07 | 1123 | 1102 | 295.6 |
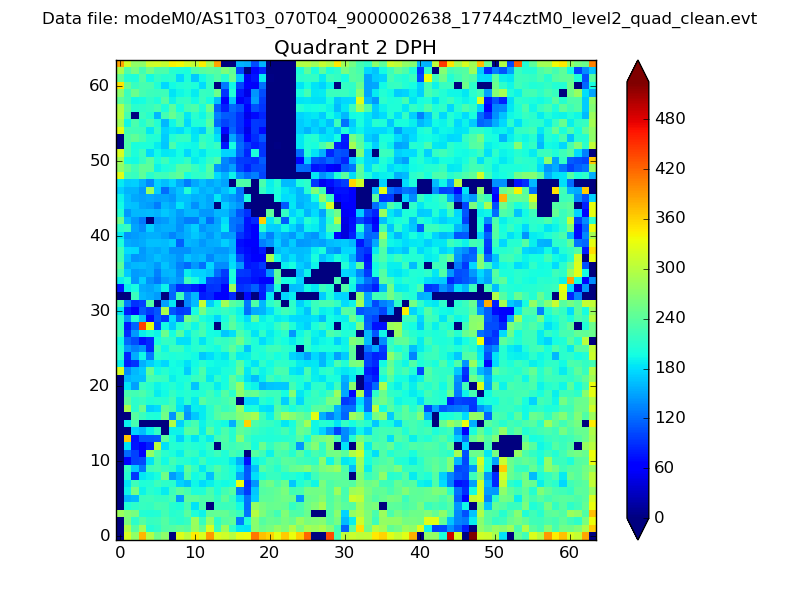
Histogram calculated using DETX and DETY for each event in the final _common_clean file
| Quadrant A | 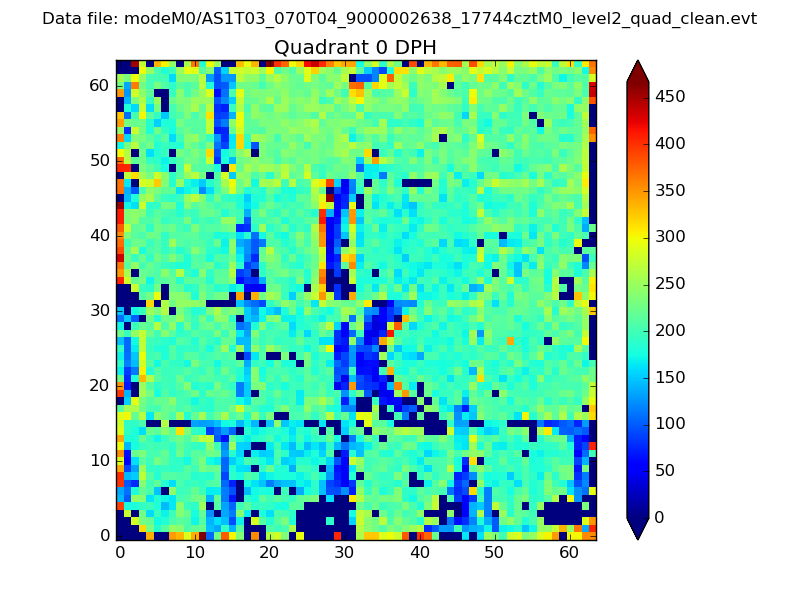 |
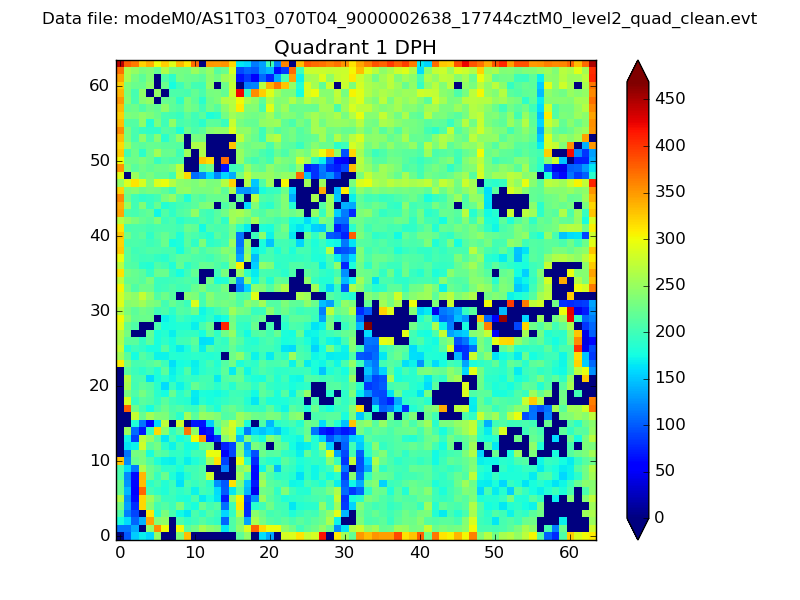 |
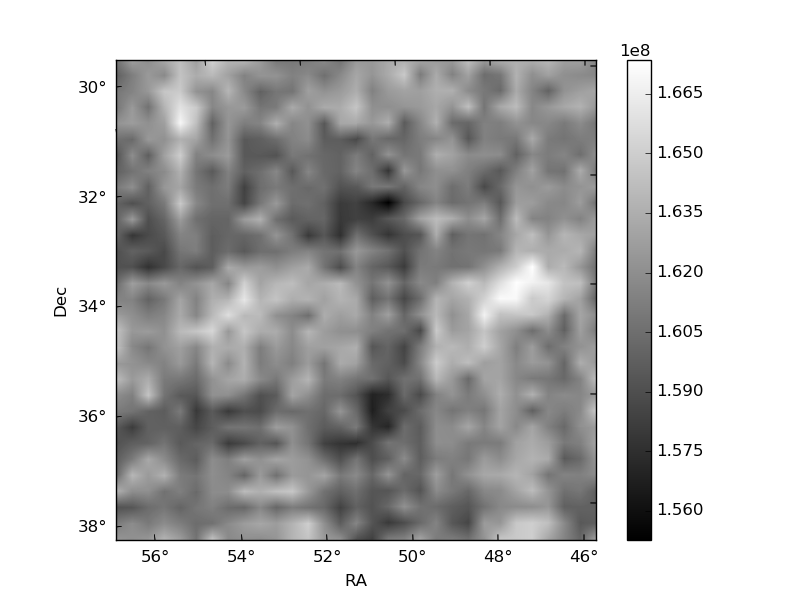
Quadrant B |
|---|---|---|---|
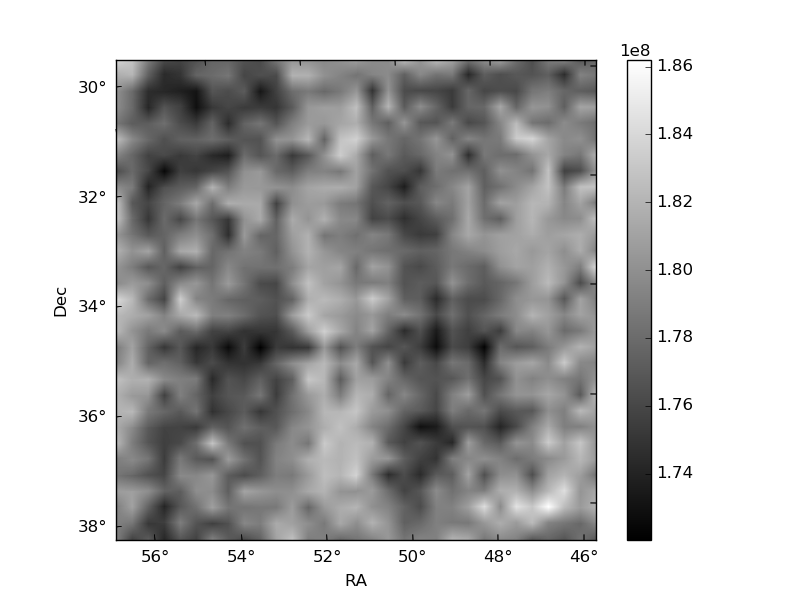
| Quadrant D | 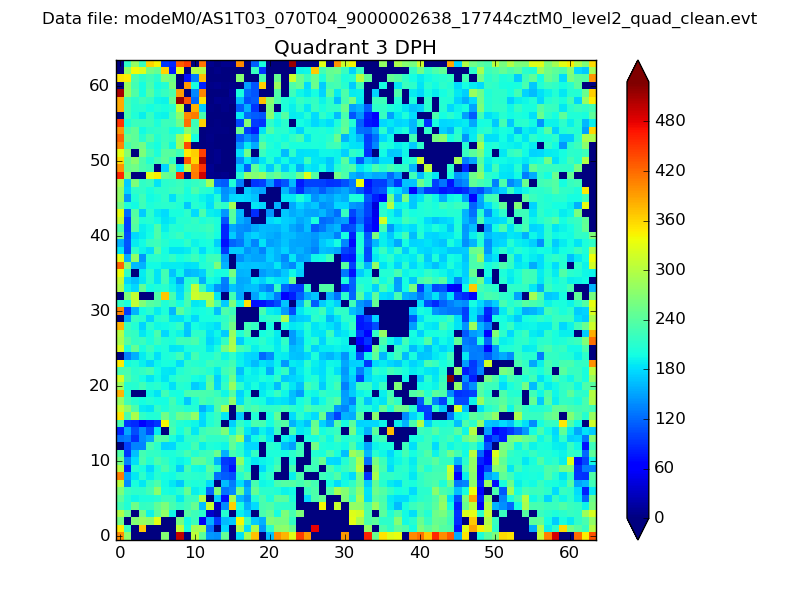 |
 |
Quadrant C |
| Plot type | Count rate plots | Images |
|---|---|---|
| Comparison with Poisson distribution Blue bars denote a histogram of data divided into 1 sec bins. Red curve is a Poisson curve with rate = median count rate of data. |
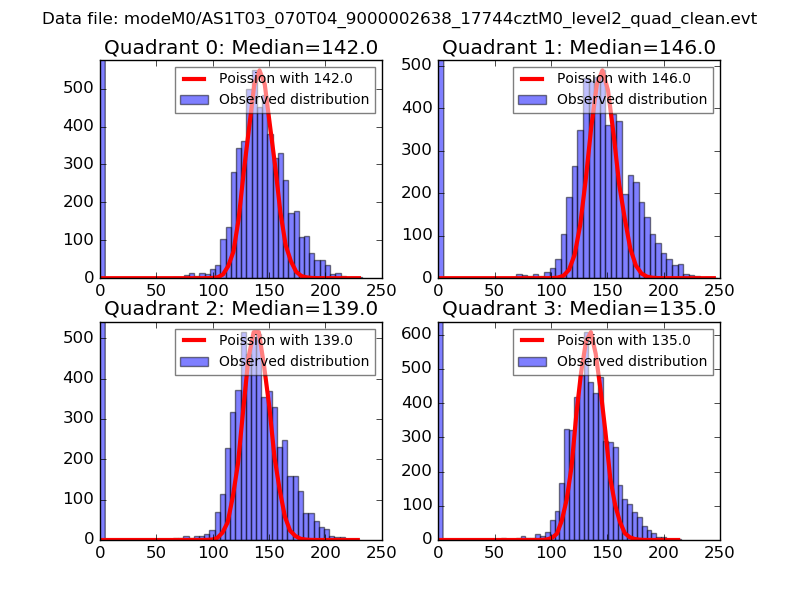 |
 |
| Quadrant-wise count rates Data is divided into 100 sec bins |
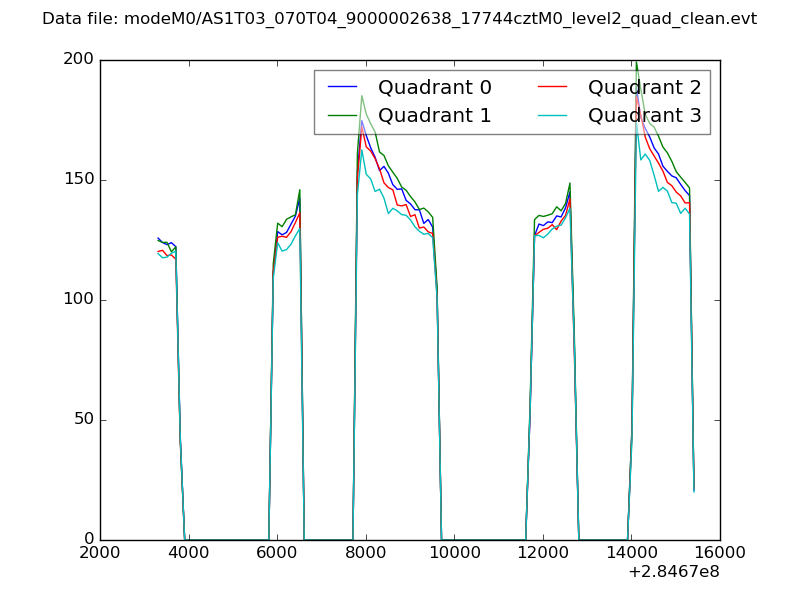 |
|
| Module-wise count rates for Quadrant A Data is divided into 100 sec bins |
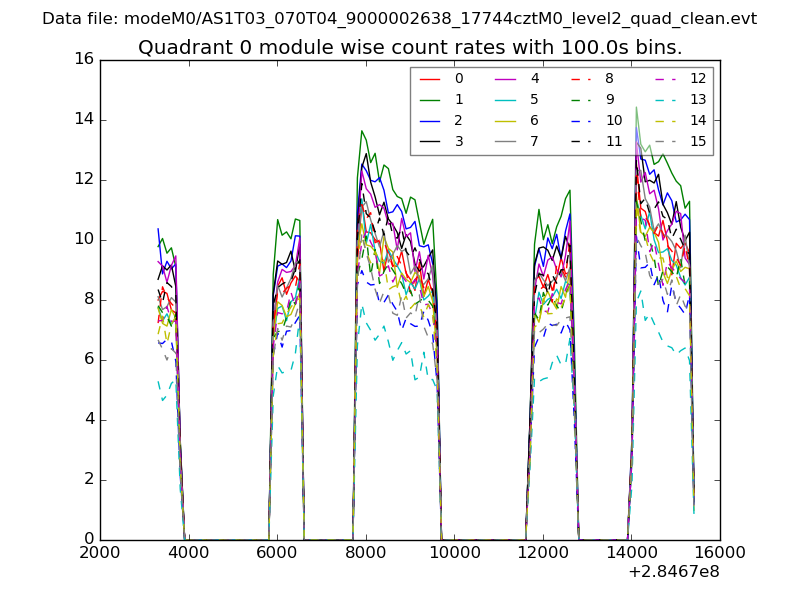 |
 |
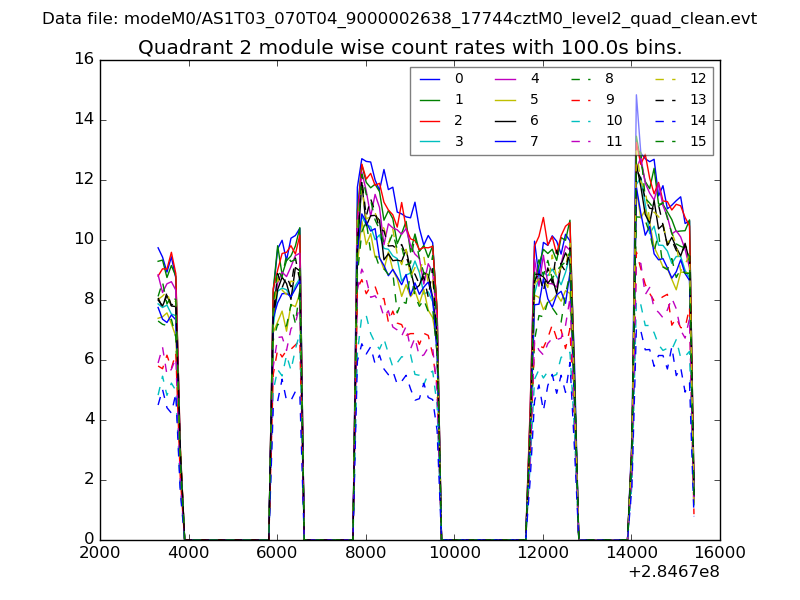
| Module-wise count rates for Quadrant B Data is divided into 100 sec bins |
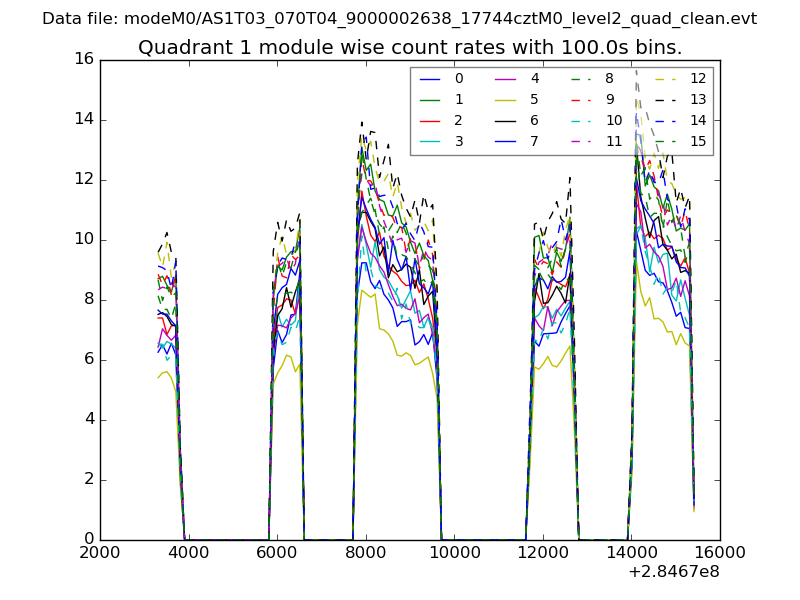 |
 |
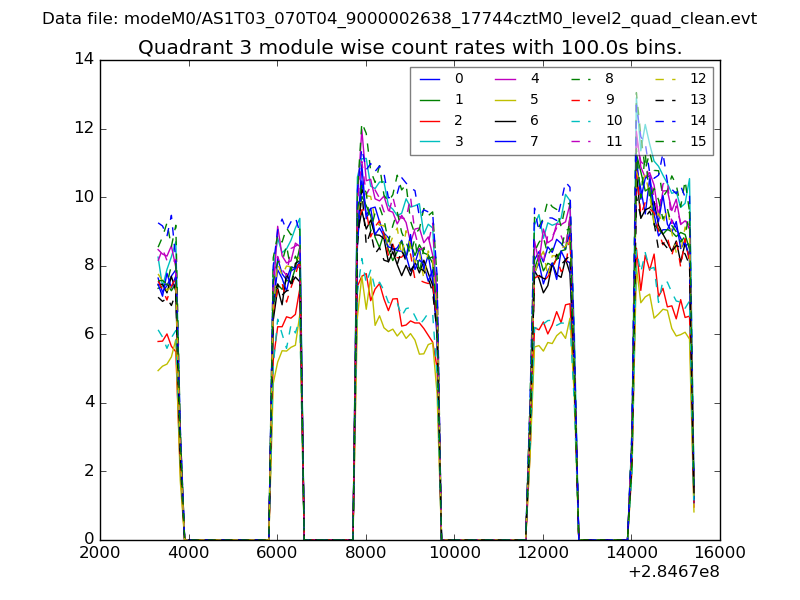
| Module-wise count rates for Quadrant C Data is divided into 100 sec bins |
 |
 |
| Module-wise count rates for Quadrant D Data is divided into 100 sec bins |
 |
 |
| Parameter | Plot |
|---|---|
| CZT HV Monitor | 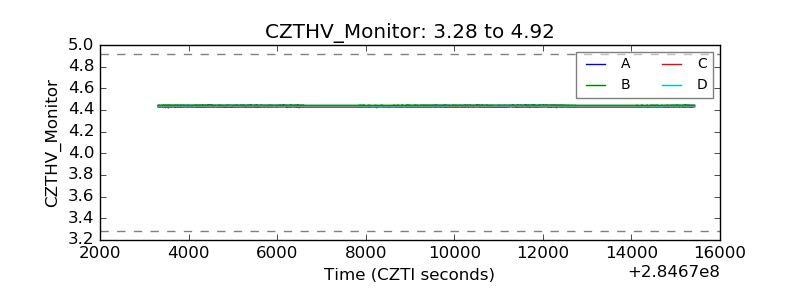 |
| D_VDD |  |
| Temperature 1 | 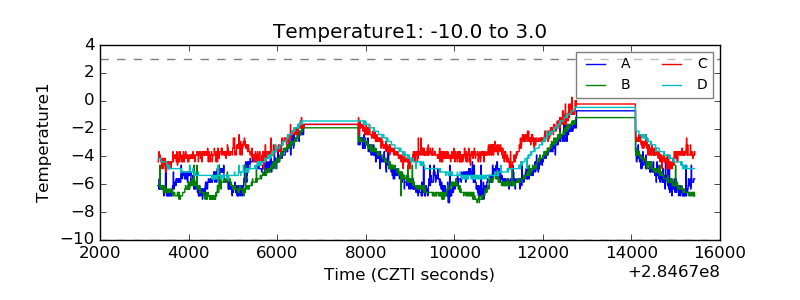 |
| Veto HV Monitor |  |
| Veto LLD | 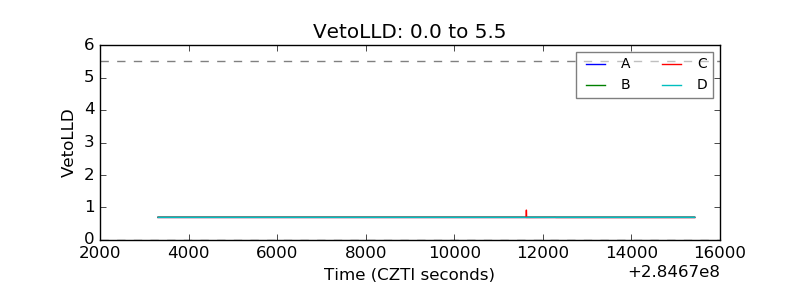 |
| Alpha Counter | 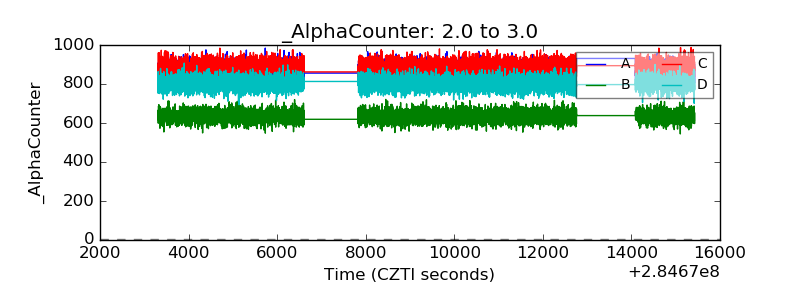 |
| _CPM_Rate | 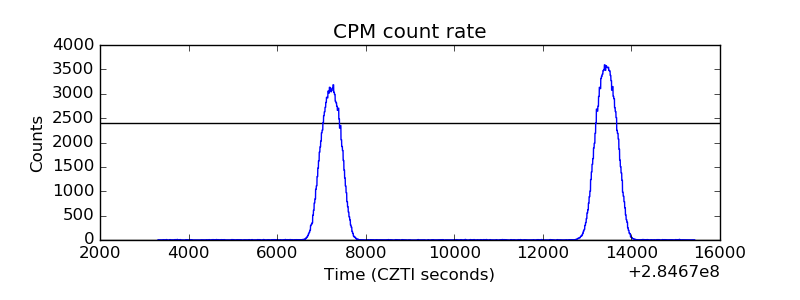 |
| CZT Counter | 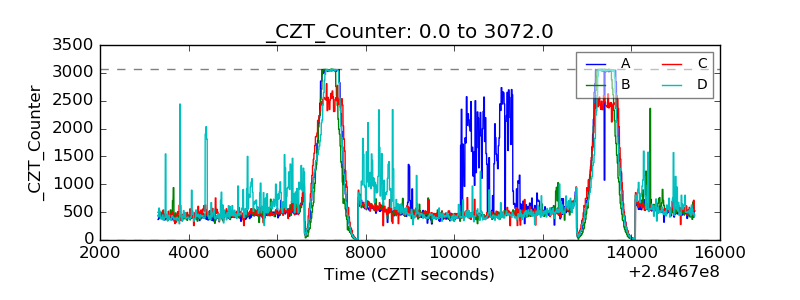 |
| +2.5 Volts monitor |  |
| +5 Volts monitor |  |
| _ROLL_ROT | 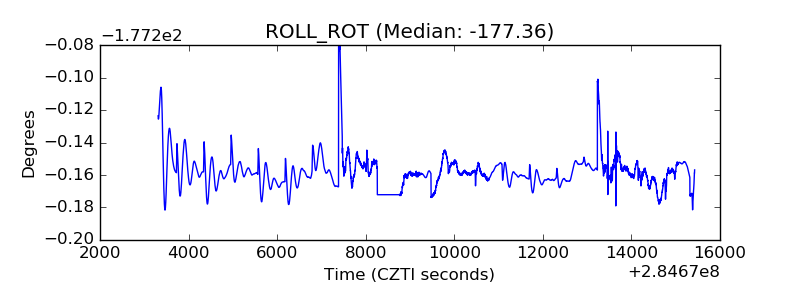 |
| _Roll_DEC | 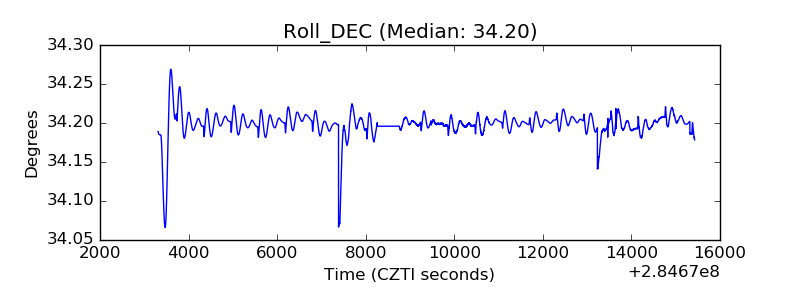 |
| _Roll_RA |  |
| Veto Counter | 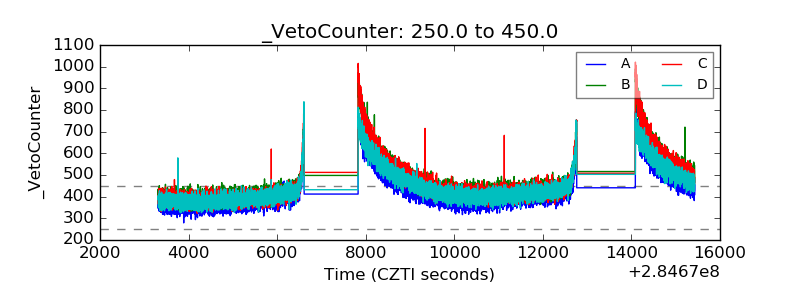 |