| Param | Original file | Final file |
|---|---|---|
| Filename | modeM0/AS1T03_070T04_9000002638_17745cztM0_level2.evt | modeM0/AS1T03_070T04_9000002638_17745cztM0_level2_quad_clean.evt |
| Size (bytes) | 447,716,160 | 90,141,120 |
| Size | 427.0 MB | 86.0 MB |
| Events in quadrant A | 3,113,316 | 587,182 |
| Events in quadrant B | 3,584,052 | 596,966 |
| Events in quadrant C | 3,181,016 | 571,503 |
| Events in quadrant D | 3,270,645 | 552,517 |
| Mode SS | |||
|---|---|---|---|
| Quadrant | BADHDUFLAG | Total packets | Discarded packets |
| A | 0 | 122 | 0 |
| B | 0 | 122 | 0 |
| C | 0 | 122 | 0 |
| D | 0 | 122 | 0 |
| Mode M9 | |||
|---|---|---|---|
| Quadrant | BADHDUFLAG | Total packets | Discarded packets |
| A | 0 | 26 | 0 |
| B | 0 | 27 | 0 |
| C | 0 | 27 | 0 |
| D | 0 | 27 | 0 |
| Mode M0 | |||
|---|---|---|---|
| Quadrant | BADHDUFLAG | Total packets | Discarded packets |
| A | 0 | 13017 | 1 |
| B | 0 | 14452 | 1 |
| C | 0 | 12966 | 1 |
| D | 0 | 13774 | 1 |
| Quadrant | Total seconds | Saturated seconds | Saturation percentage |
|---|---|---|---|
| A | 6038 | 36 | 0.596224% |
| B | 6038 | 160 | 2.649884% |
| C | 6038 | 57 | 0.944021% |
| D | 6038 | 67 | 1.109639% |
Noise dominated data is calculated using 1-second bins in cleaned event files. If a bin has >2000 counts, and if more than 50% of those come from <1% of pixels, then it is considered to be noise-dominated and hence unusable.
| Quadrant | # 1 sec bins | Bins with >0 counts | Bins with >2000 counts | High rate bins dominated by noise | Noise dominated (total time) | Noise dominated (detector-on time) | Marked lightcurve |
|---|---|---|---|---|---|---|---|
| A | 7408 | 6039 | 11 | 11 | 0.15% | 0.18% | 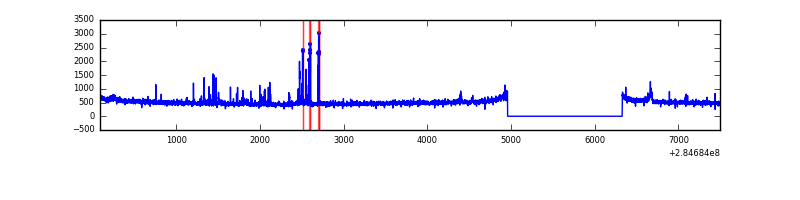 |
| B | 7408 | 6039 | 110 | 110 | 1.48% | 1.82% | 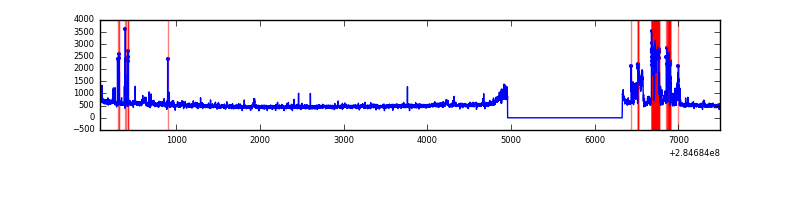 |
| C | 7408 | 6039 | 2 | 2 | 0.03% | 0.03% | 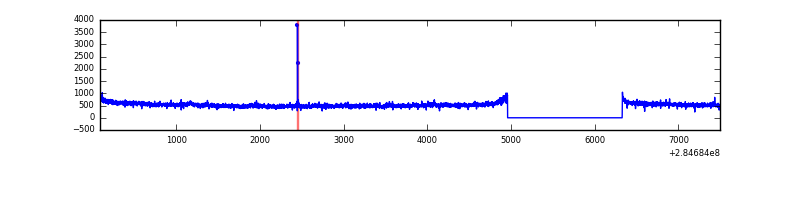 |
| D | 7408 | 6039 | 47 | 47 | 0.63% | 0.78% |  |
Top three noisy pixels from each quadrant. If the there are fewer than three noisy pixels in the level2.evt file, extra rows are filled as -1
| Pixel properties | Quadrant properties | ||||||
|---|---|---|---|---|---|---|---|
| Quadrant | DetID | PixID | Counts | Sigma | Mean | Median | Sigma |
| A | 15 | 174 | 146172 | 945.05 | 767 | 752 | 153.9 |
| A | 15 | 191 | 17074 | 106.07 | 767 | 752 | 153.9 |
| A | 0 | 226 | 6668 | 38.44 | 767 | 752 | 153.9 |
| B | 10 | 245 | 448366 | 3127.06 | 771 | 754 | 143.1 |
| B | 0 | 219 | 47784 | 328.56 | 771 | 754 | 143.1 |
| B | 0 | 230 | 27044 | 183.66 | 771 | 754 | 143.1 |
| C | 14 | 238 | 116869 | 666.66 | 750 | 757 | 174.2 |
| C | 5 | 218 | 56885 | 322.26 | 750 | 757 | 174.2 |
| C | 3 | 233 | 49691 | 280.95 | 750 | 757 | 174.2 |
| D | 7 | 238 | 125108 | 641.54 | 738 | 726 | 193.9 |
| D | 1 | 20 | 89420 | 457.47 | 738 | 726 | 193.9 |
| D | 10 | 70 | 81521 | 416.73 | 738 | 726 | 193.9 |
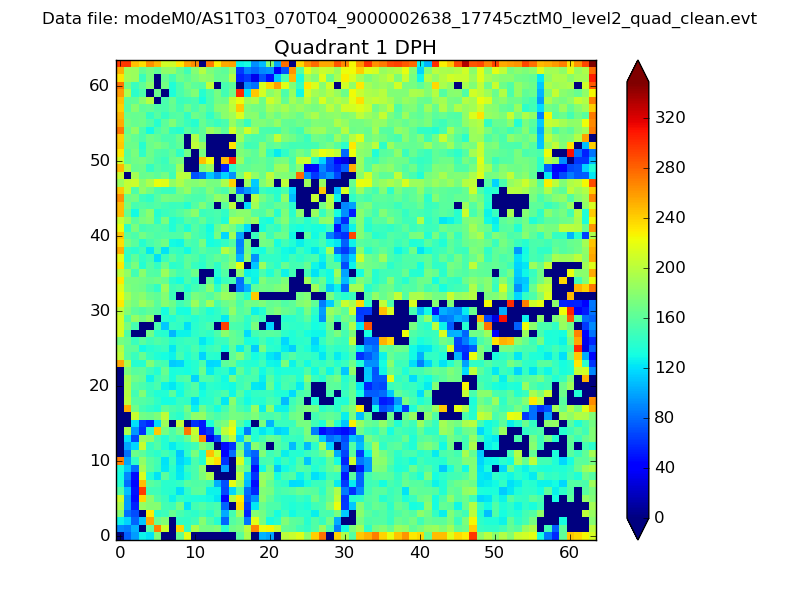
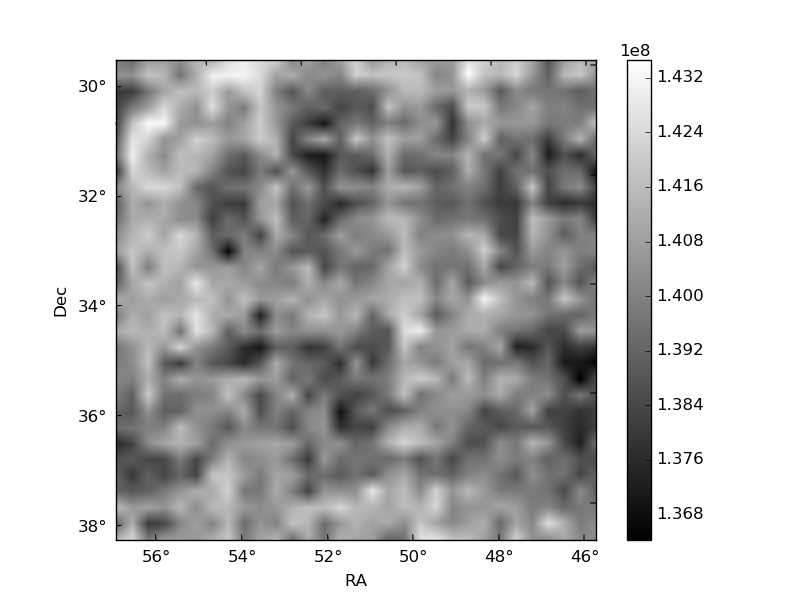
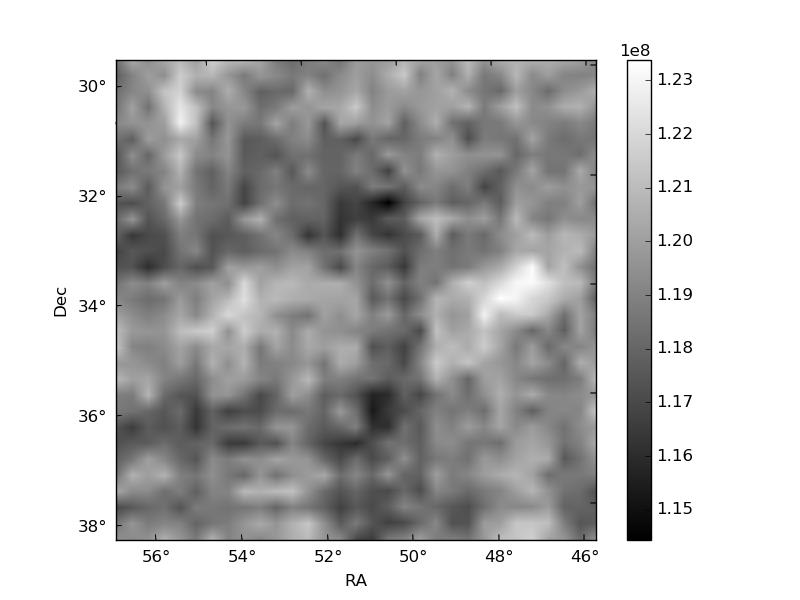
Histogram calculated using DETX and DETY for each event in the final _common_clean file
| Quadrant A |  |
 |
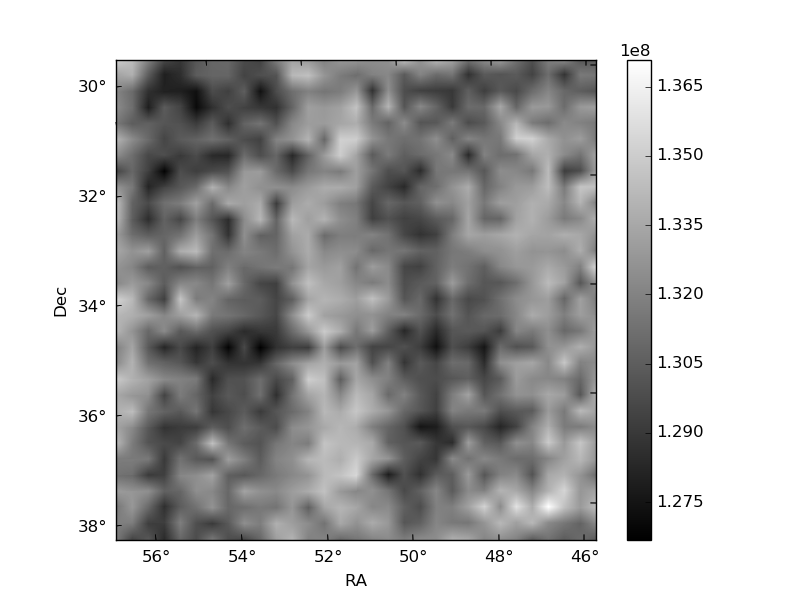
Quadrant B |
|---|---|---|---|
| Quadrant D | 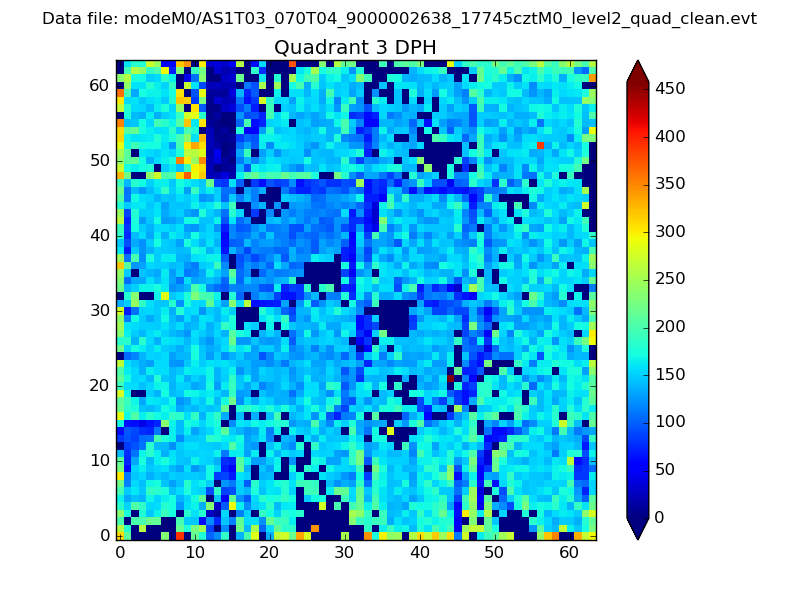 |
 |
Quadrant C |
| Plot type | Count rate plots | Images |
|---|---|---|
| Comparison with Poisson distribution Blue bars denote a histogram of data divided into 1 sec bins. Red curve is a Poisson curve with rate = median count rate of data. |
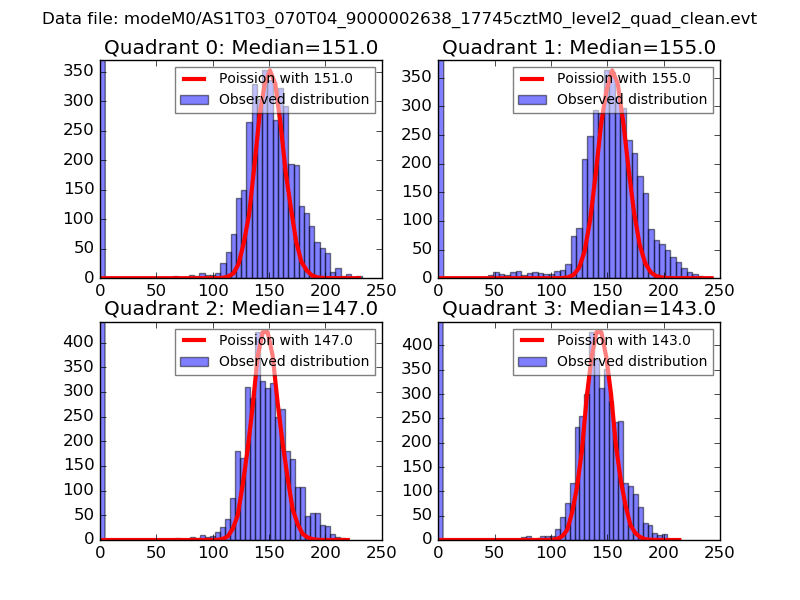 |
 |
| Quadrant-wise count rates Data is divided into 100 sec bins |
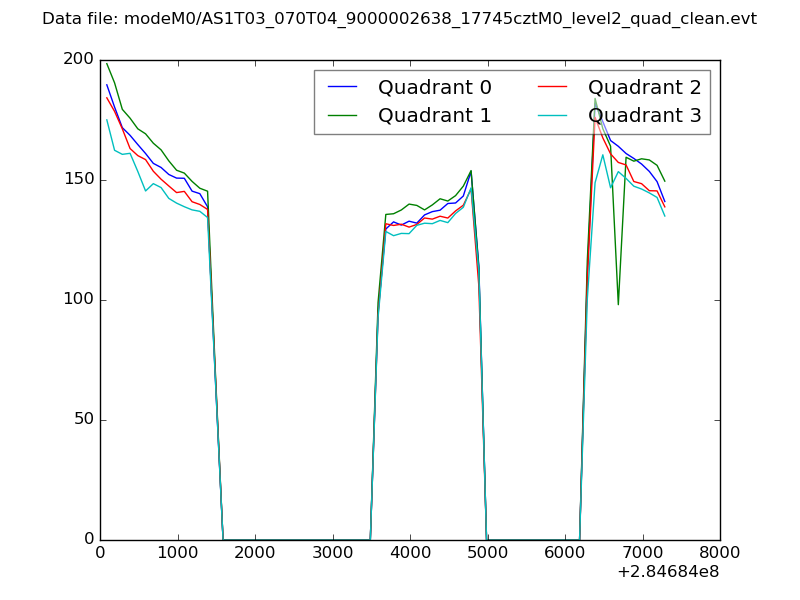 |
|
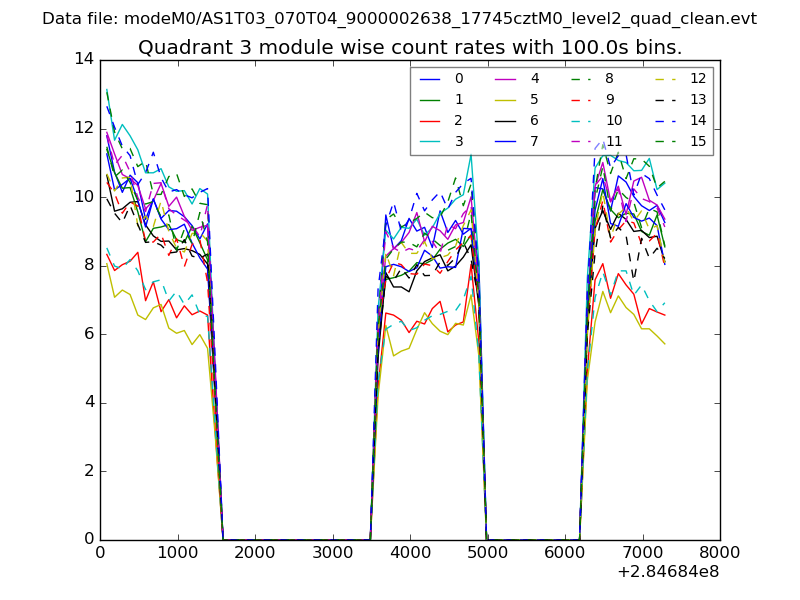
| Module-wise count rates for Quadrant A Data is divided into 100 sec bins |
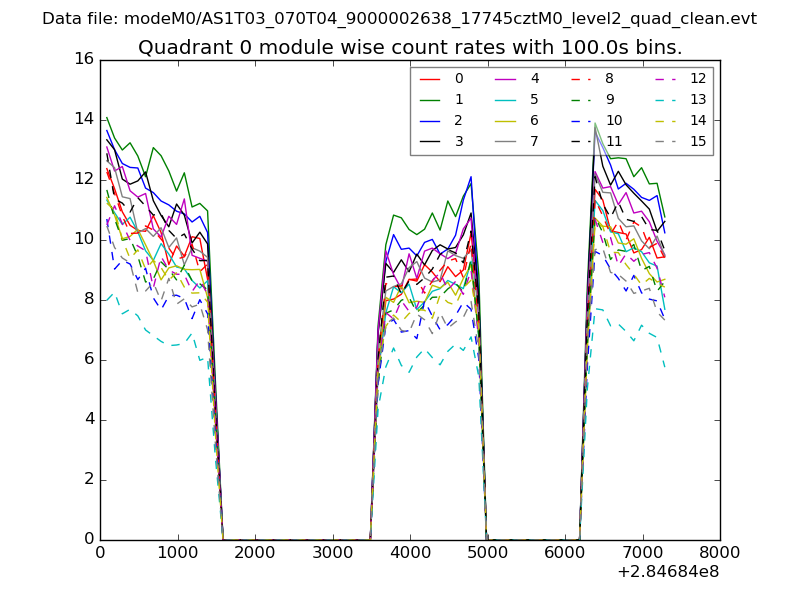 |
 |
| Module-wise count rates for Quadrant B Data is divided into 100 sec bins |
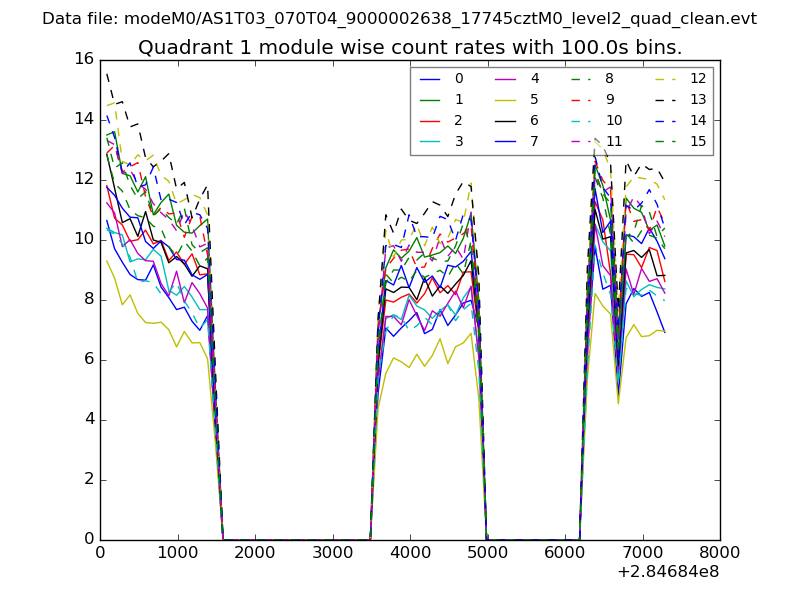 |
 |
| Module-wise count rates for Quadrant C Data is divided into 100 sec bins |
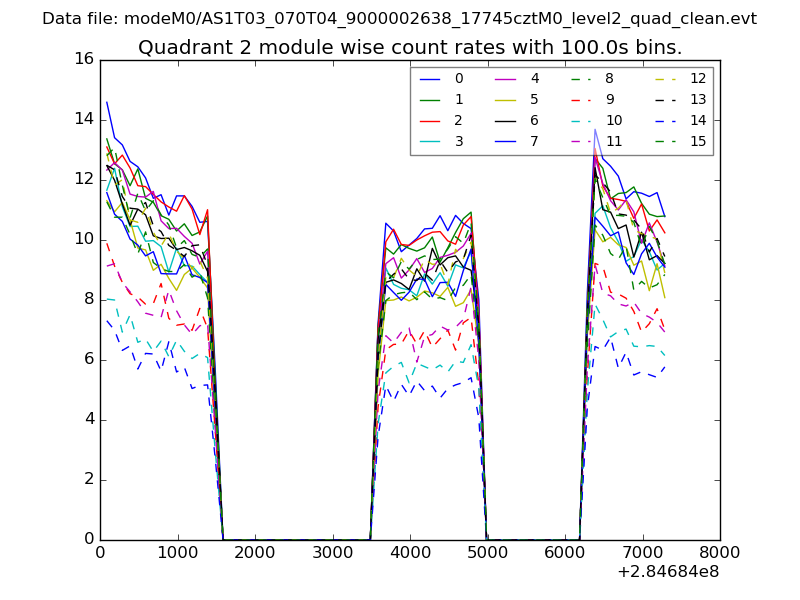 |
 |
| Module-wise count rates for Quadrant D Data is divided into 100 sec bins |
 |
 |
| Parameter | Plot |
|---|---|
| CZT HV Monitor | 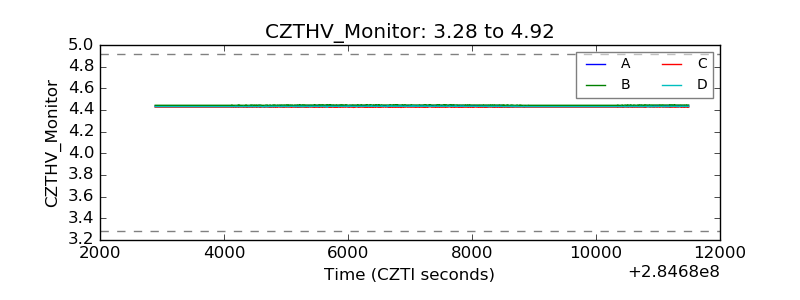 |
| D_VDD | 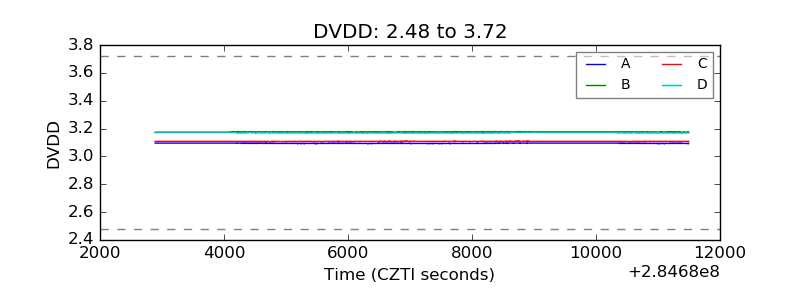 |
| Temperature 1 | 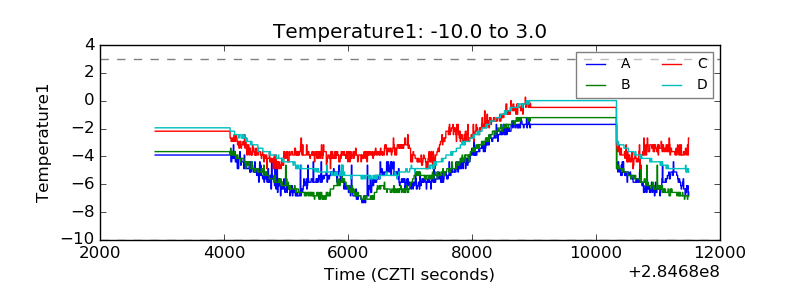 |
| Veto HV Monitor | 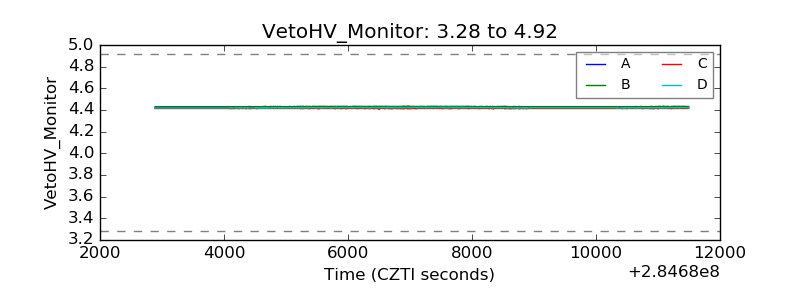 |
| Veto LLD | 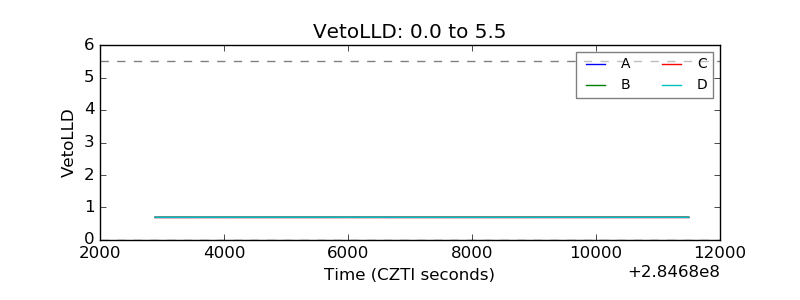 |
| Alpha Counter | 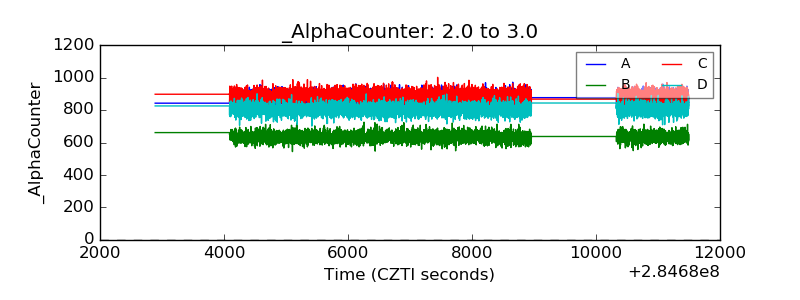 |
| _CPM_Rate | 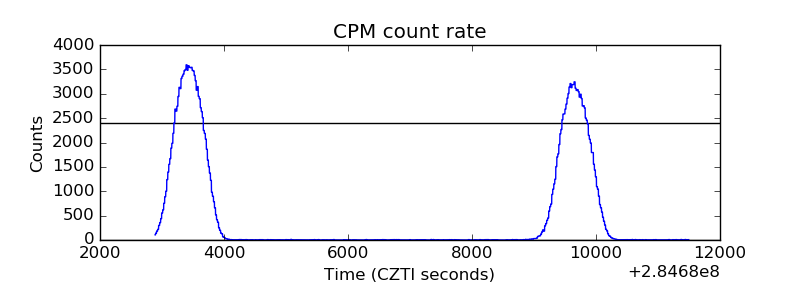 |
| CZT Counter | 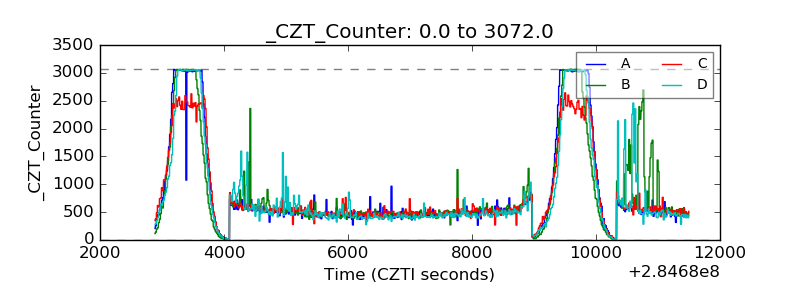 |
| +2.5 Volts monitor |  |
| +5 Volts monitor |  |
| _ROLL_ROT | 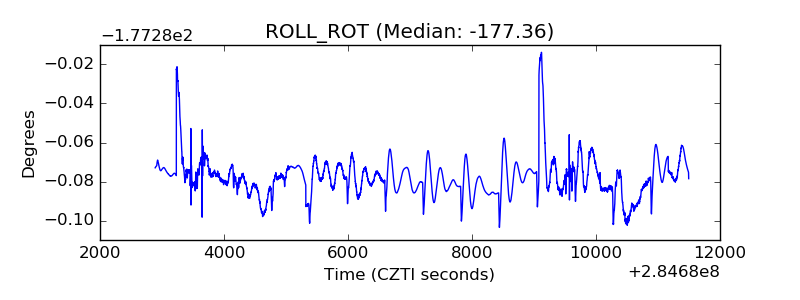 |
| _Roll_DEC | 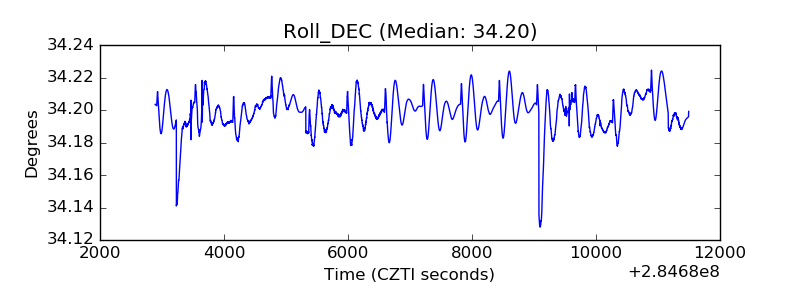 |
| _Roll_RA | 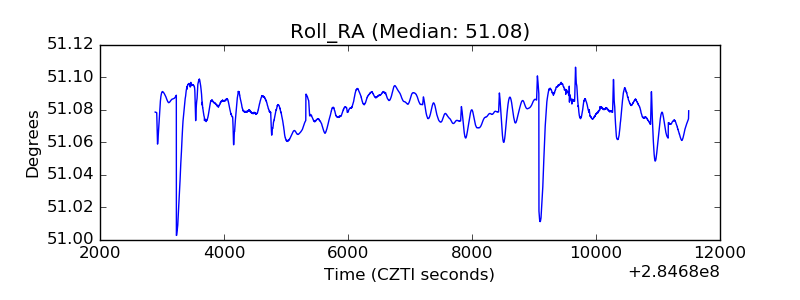 |
| Veto Counter | 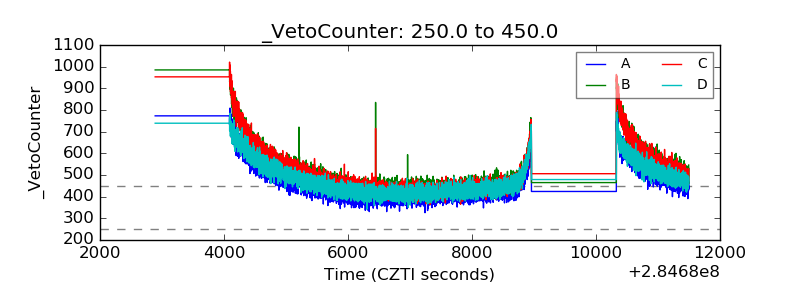 |