| Param | Original file | Final file |
|---|---|---|
| Filename | modeM0/AS1T03_070T04_9000002638_17746cztM0_level2.evt | modeM0/AS1T03_070T04_9000002638_17746cztM0_level2_quad_clean.evt |
| Size (bytes) | 100,687,680 | 24,042,240 |
| Size | 96.0 MB | 22.9 MB |
| Events in quadrant A | 606,096 | 166,374 |
| Events in quadrant B | 1,017,655 | 161,672 |
| Events in quadrant C | 625,727 | 160,022 |
| Events in quadrant D | 719,246 | 152,570 |
| Mode SS | |||
|---|---|---|---|
| Quadrant | BADHDUFLAG | Total packets | Discarded packets |
| A | 0 | 24 | 0 |
| B | 0 | 24 | 0 |
| C | 0 | 24 | 0 |
| D | 0 | 24 | 0 |
| Mode M0 | |||
|---|---|---|---|
| Quadrant | BADHDUFLAG | Total packets | Discarded packets |
| A | 0 | 2471 | 1 |
| B | 0 | 3764 | 1 |
| C | 0 | 2508 | 1 |
| D | 0 | 2868 | 1 |
| Quadrant | Total seconds | Saturated seconds | Saturation percentage |
|---|---|---|---|
| A | 1140 | 3 | 0.263158% |
| B | 1141 | 107 | 9.377739% |
| C | 1141 | 4 | 0.350570% |
| D | 1141 | 29 | 2.541630% |
Noise dominated data is calculated using 1-second bins in cleaned event files. If a bin has >2000 counts, and if more than 50% of those come from <1% of pixels, then it is considered to be noise-dominated and hence unusable.
| Quadrant | # 1 sec bins | Bins with >0 counts | Bins with >2000 counts | High rate bins dominated by noise | Noise dominated (total time) | Noise dominated (detector-on time) | Marked lightcurve |
|---|---|---|---|---|---|---|---|
| A | 1140 | 1140 | 0 | 0 | 0.00% | 0.00% | 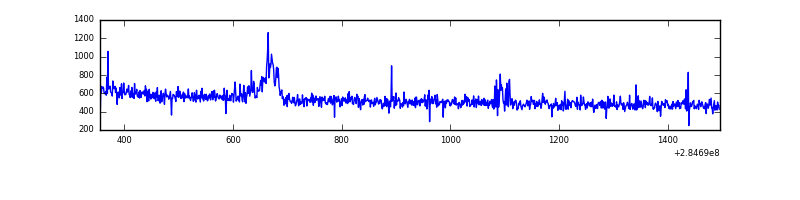 |
| B | 1141 | 1141 | 101 | 101 | 8.85% | 8.85% | 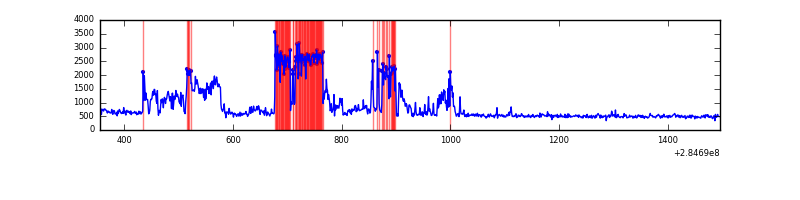 |
| C | 1141 | 1141 | 0 | 0 | 0.00% | 0.00% | 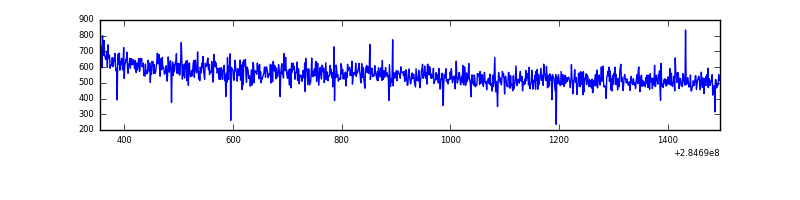 |
| D | 1141 | 1141 | 32 | 32 | 2.80% | 2.80% | 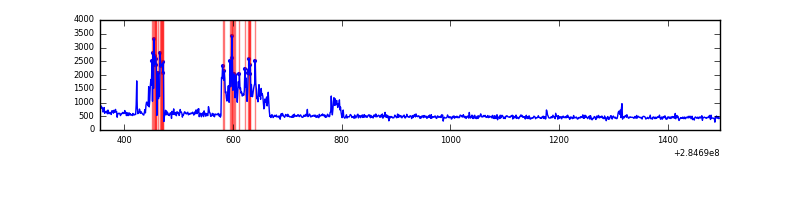 |
Top three noisy pixels from each quadrant. If the there are fewer than three noisy pixels in the level2.evt file, extra rows are filled as -1
| Pixel properties | Quadrant properties | ||||||
|---|---|---|---|---|---|---|---|
| Quadrant | DetID | PixID | Counts | Sigma | Mean | Median | Sigma |
| A | 15 | 174 | 17673 | 548.17 | 152 | 150 | 32.0 |
| A | 0 | 226 | 1320 | 36.6 | 152 | 150 | 32.0 |
| A | 12 | 194 | 1131 | 30.69 | 152 | 150 | 32.0 |
| B | 10 | 245 | 391305 | 13010.33 | 150 | 146 | 30.1 |
| B | 0 | 230 | 22350 | 738.53 | 150 | 146 | 30.1 |
| B | 0 | 219 | 9016 | 295.02 | 150 | 146 | 30.1 |
| C | 14 | 238 | 23716 | 642.95 | 150 | 151 | 36.7 |
| C | 5 | 218 | 8952 | 240.13 | 150 | 151 | 36.7 |
| C | 1 | 16 | 4072 | 106.98 | 150 | 151 | 36.7 |
| D | 7 | 238 | 107395 | 2924.18 | 146 | 142 | 36.7 |
| D | 10 | 70 | 40771 | 1107.72 | 146 | 142 | 36.7 |
| D | 7 | 38 | 7679 | 205.49 | 146 | 142 | 36.7 |
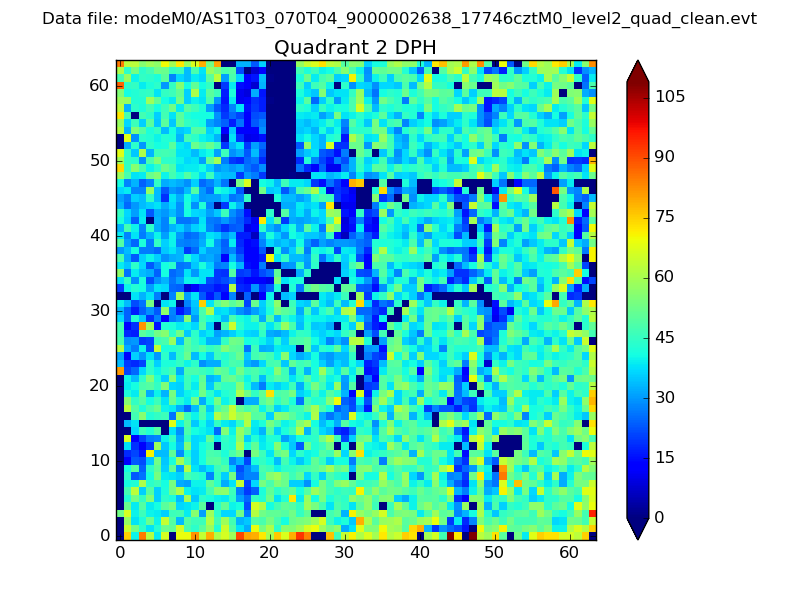
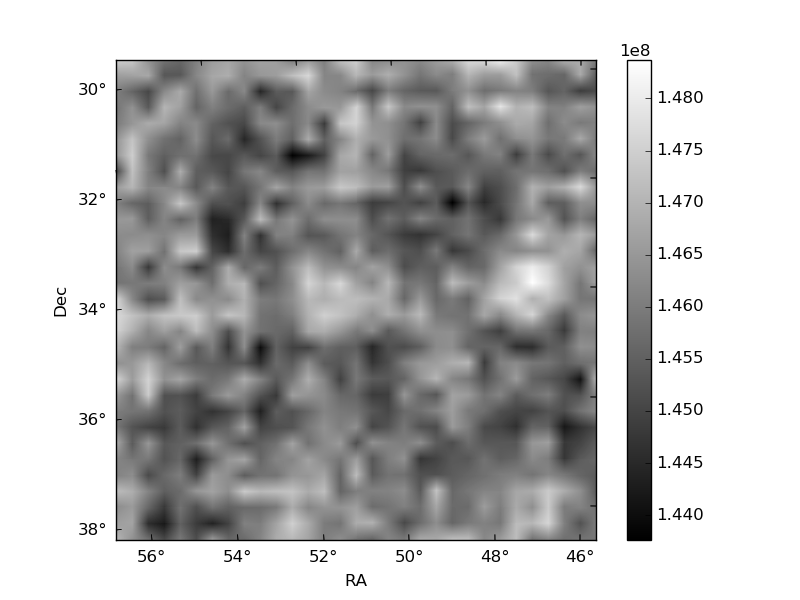
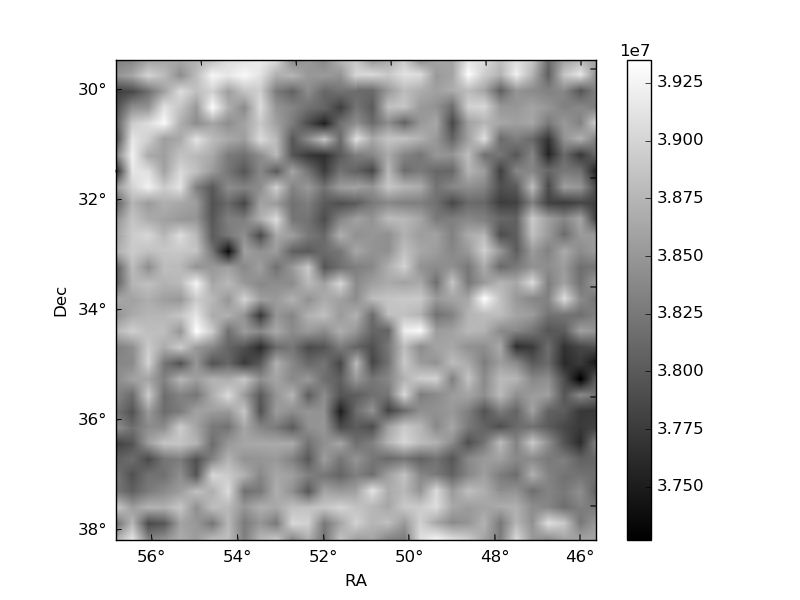
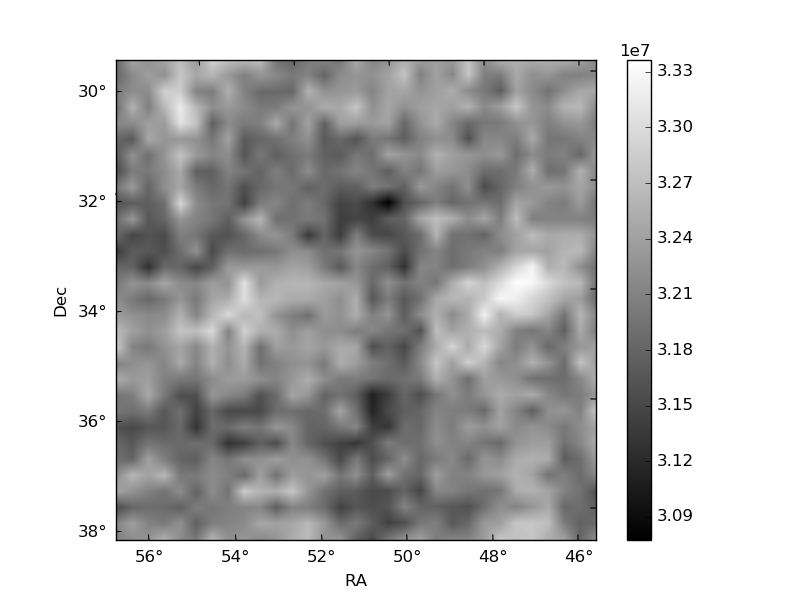
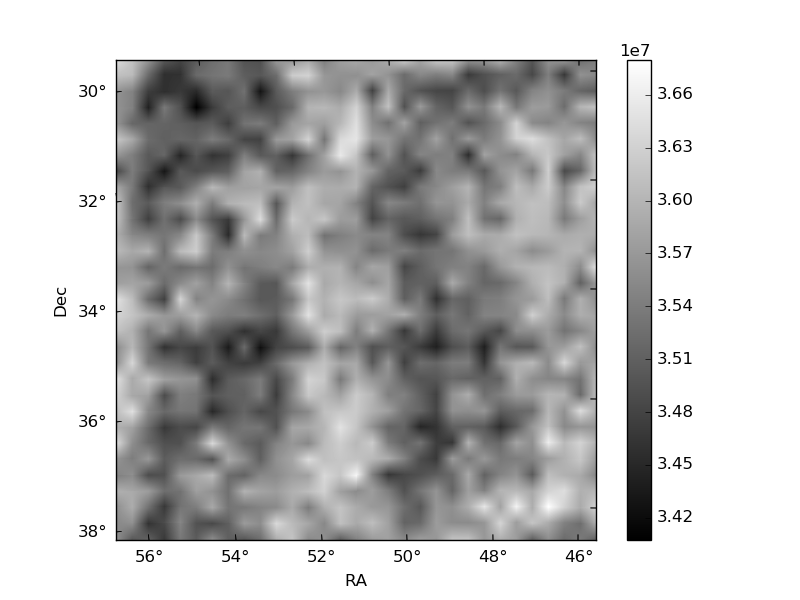
Histogram calculated using DETX and DETY for each event in the final _common_clean file
| Quadrant A | 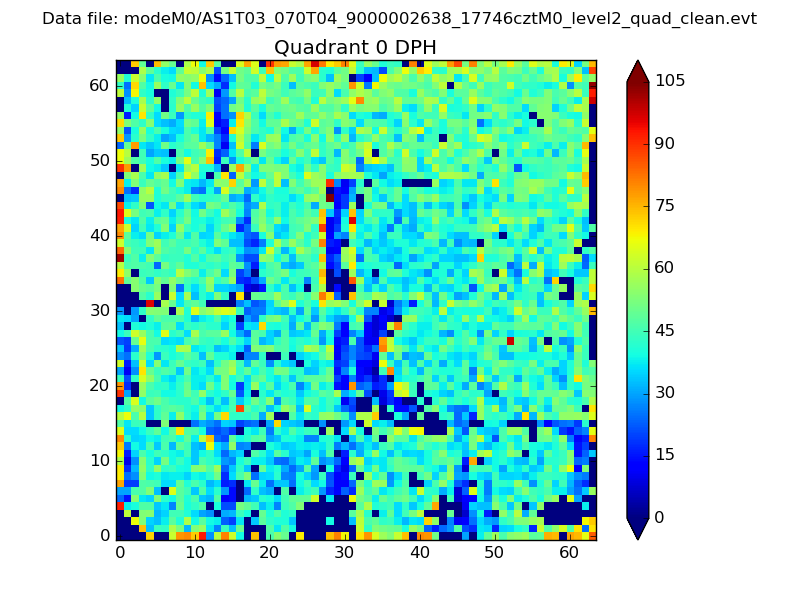 |
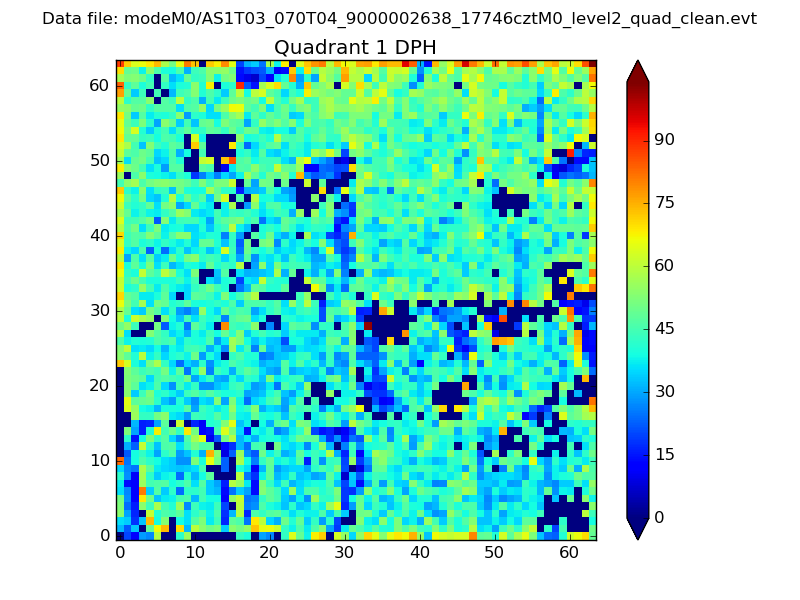 |
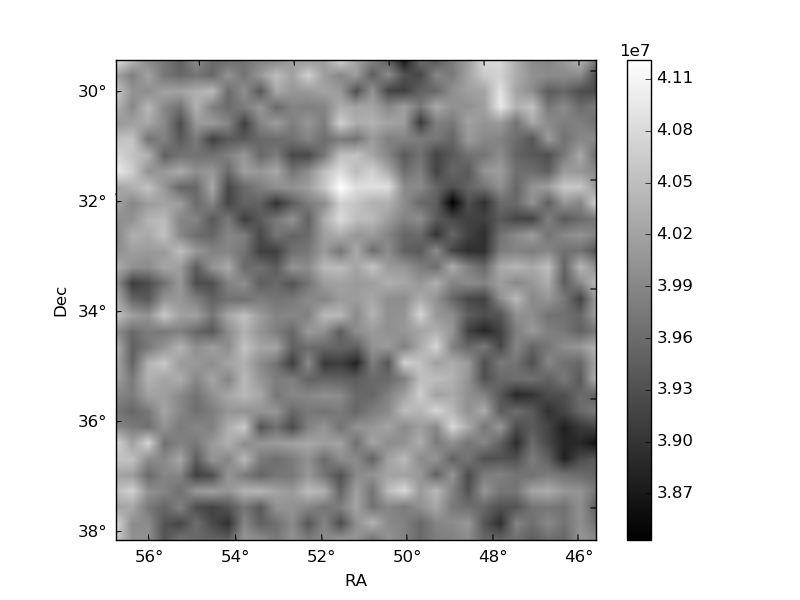
Quadrant B |
|---|---|---|---|
| Quadrant D | 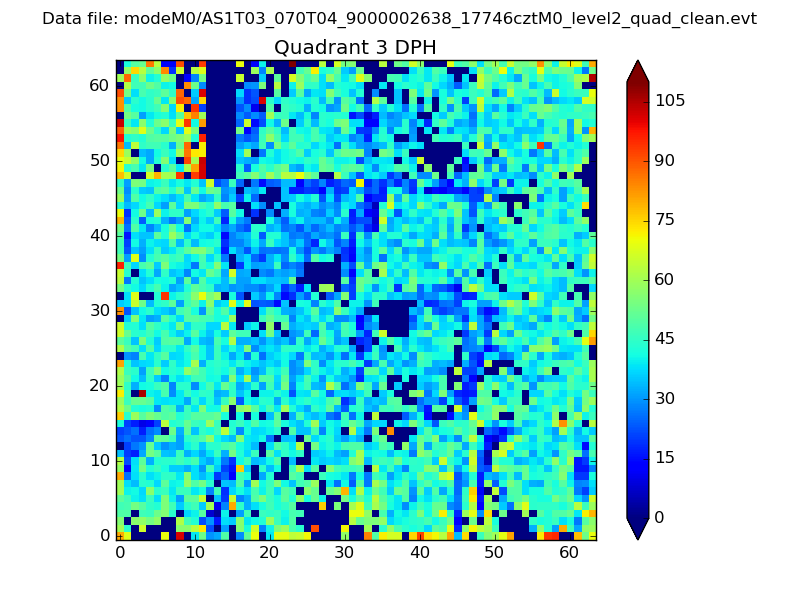 |
 |
Quadrant C |
| Plot type | Count rate plots | Images |
|---|---|---|
| Comparison with Poisson distribution Blue bars denote a histogram of data divided into 1 sec bins. Red curve is a Poisson curve with rate = median count rate of data. |
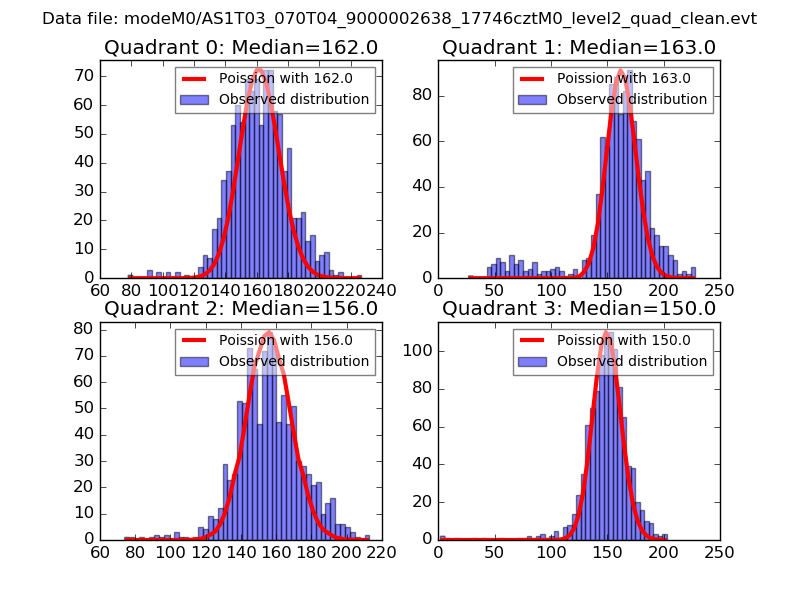 |
 |
| Quadrant-wise count rates Data is divided into 100 sec bins |
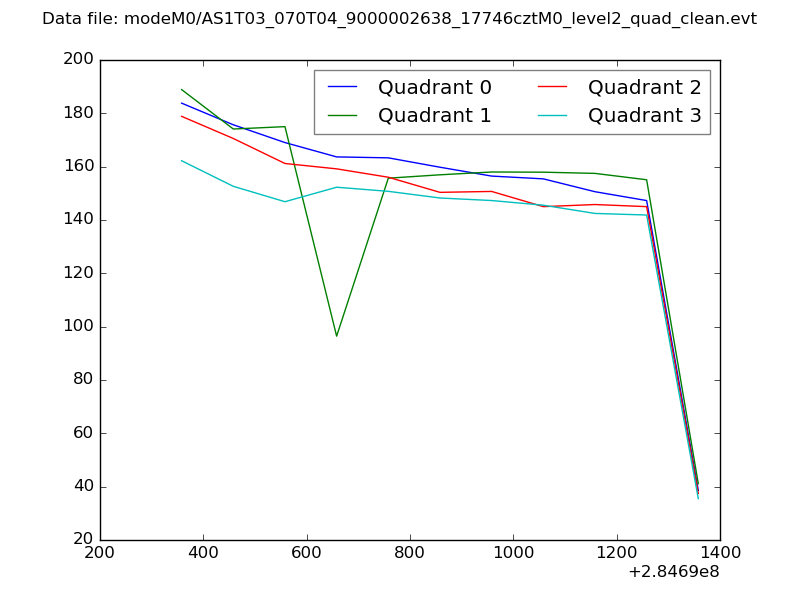 |
|
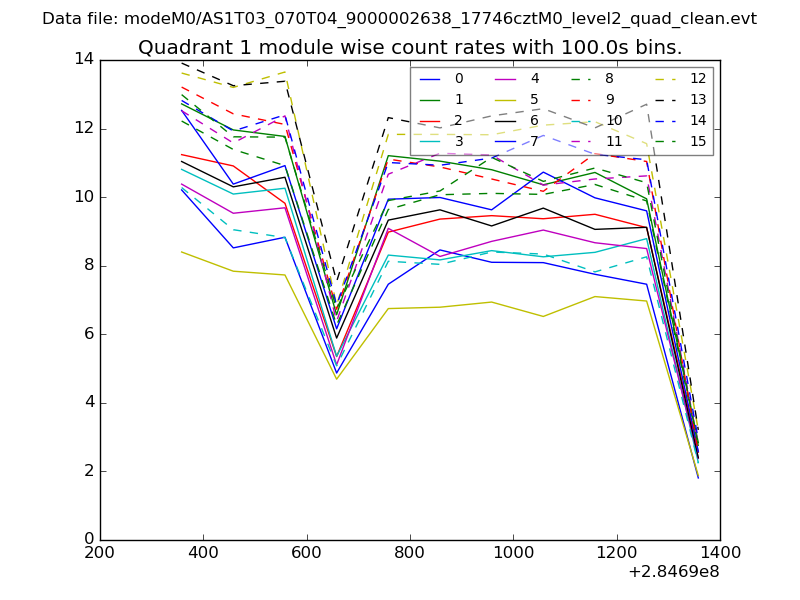
| Module-wise count rates for Quadrant A Data is divided into 100 sec bins |
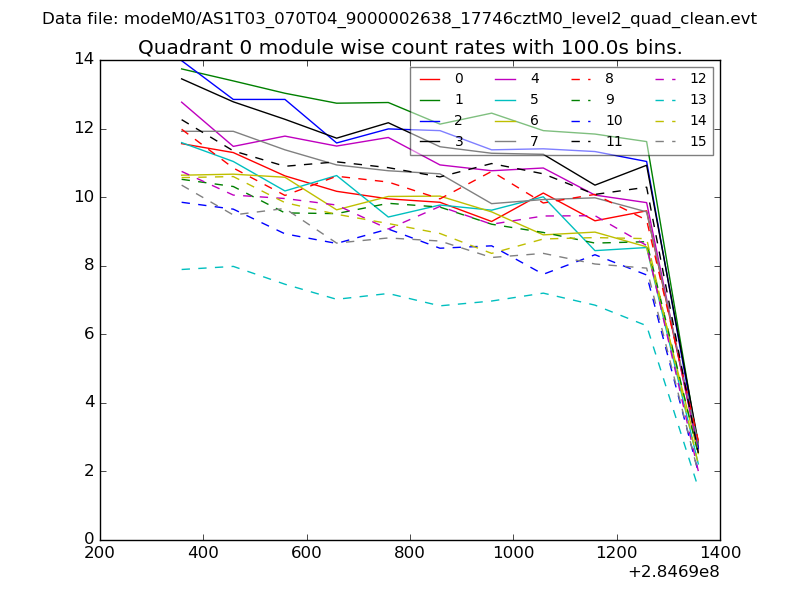 |
 |
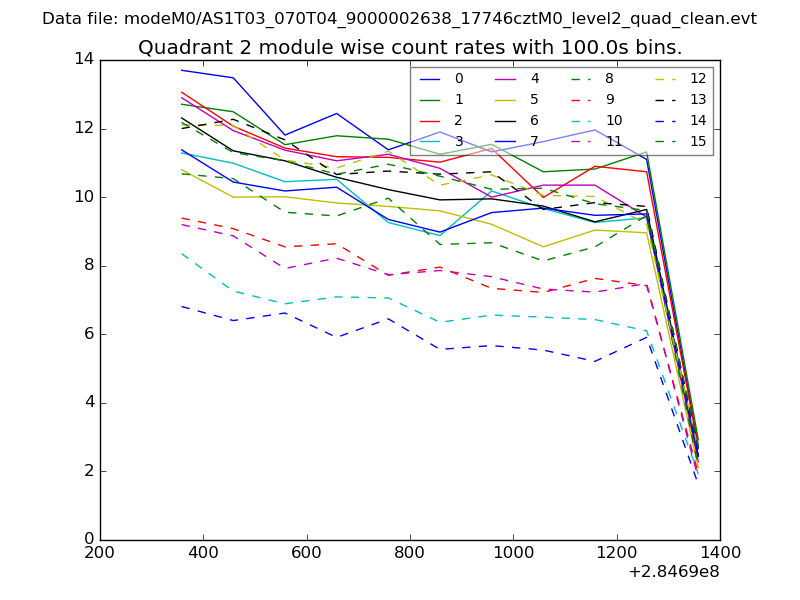
| Module-wise count rates for Quadrant B Data is divided into 100 sec bins |
 |
 |
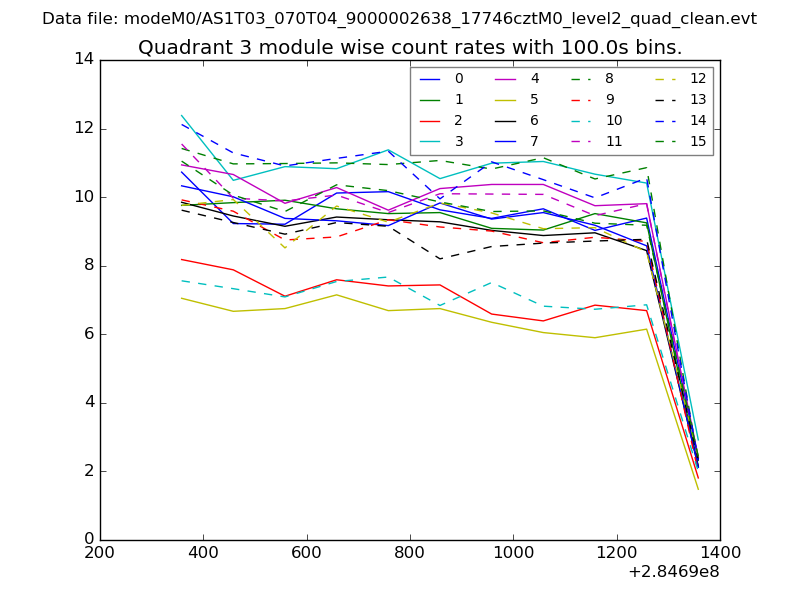
| Module-wise count rates for Quadrant C Data is divided into 100 sec bins |
 |
 |
| Module-wise count rates for Quadrant D Data is divided into 100 sec bins |
 |
 |
| Parameter | Plot |
|---|---|
| CZT HV Monitor | 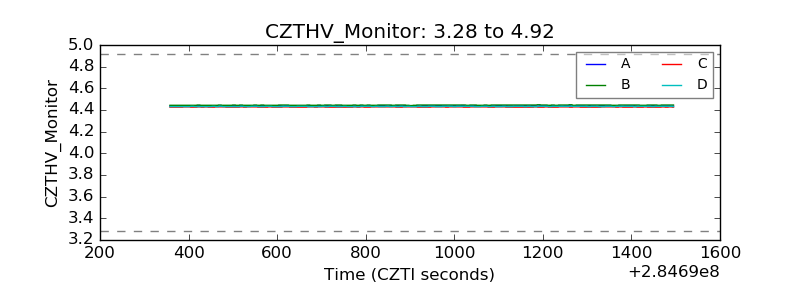 |
| D_VDD | 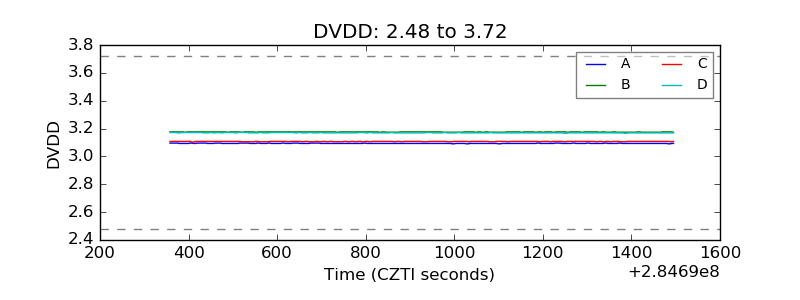 |
| Temperature 1 | 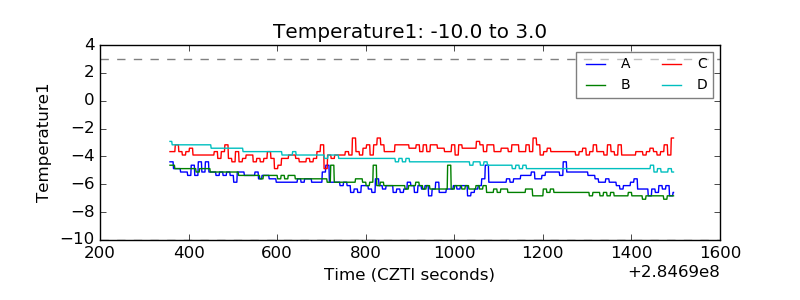 |
| Veto HV Monitor | 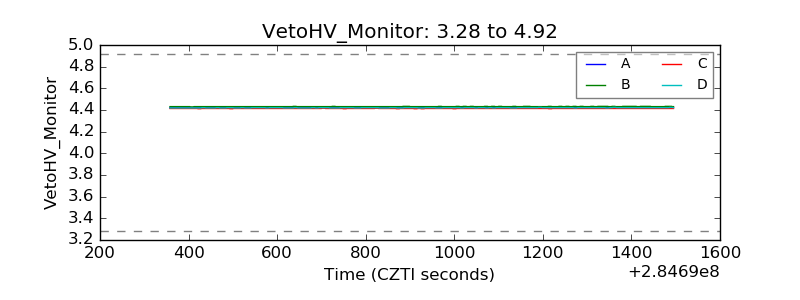 |
| Veto LLD | 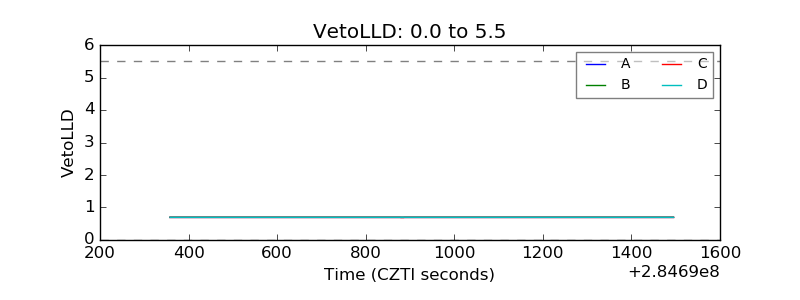 |
| Alpha Counter | 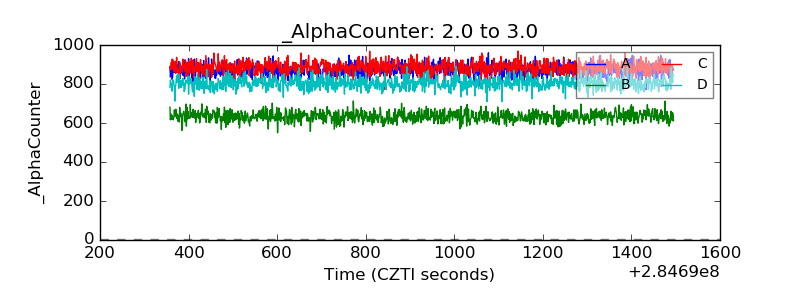 |
| _CPM_Rate | 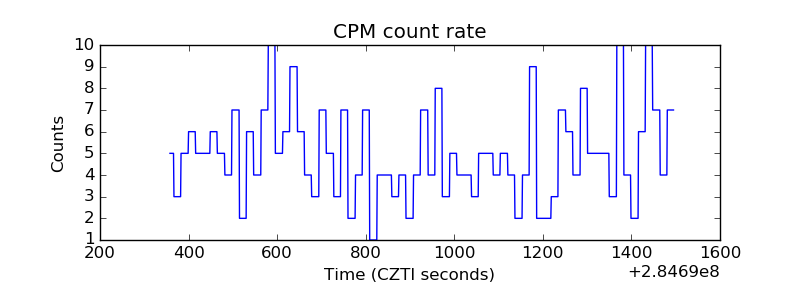 |
| CZT Counter | 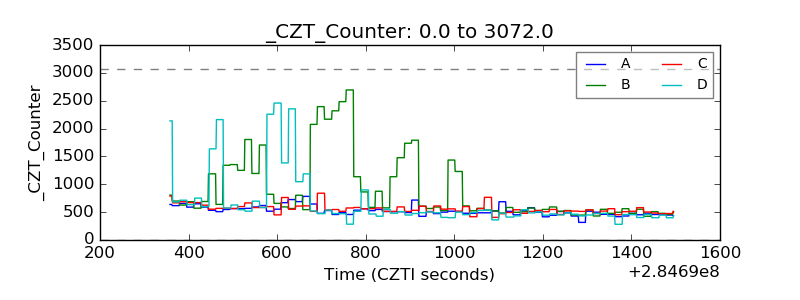 |
| +2.5 Volts monitor | 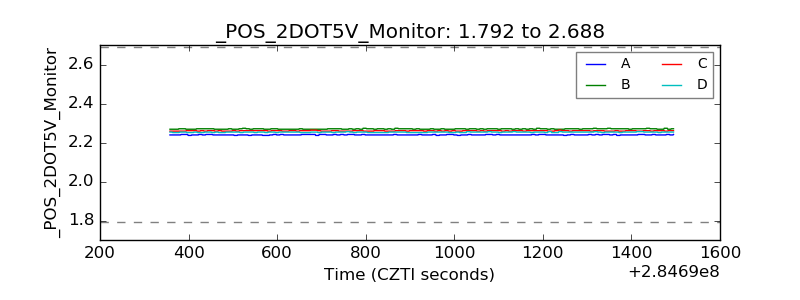 |
| +5 Volts monitor |  |
| _ROLL_ROT | 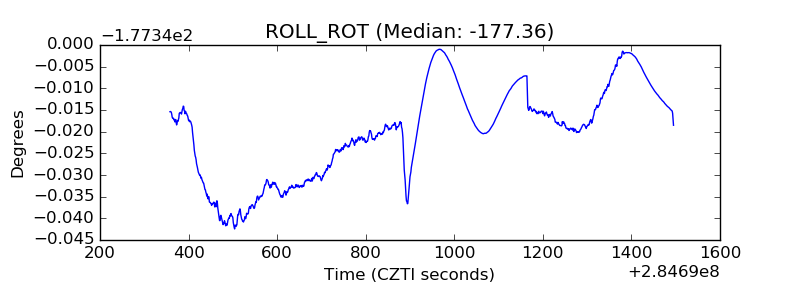 |
| _Roll_DEC | 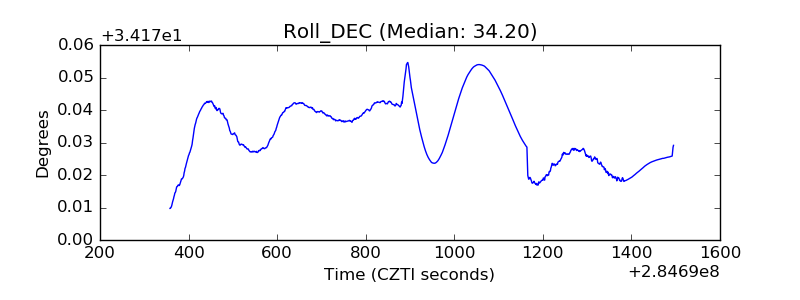 |
| _Roll_RA | 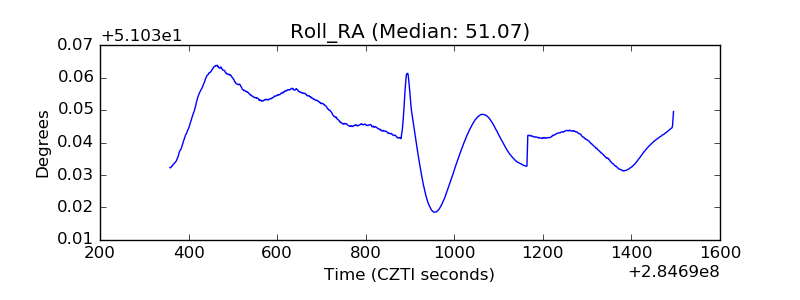 |
| Veto Counter | 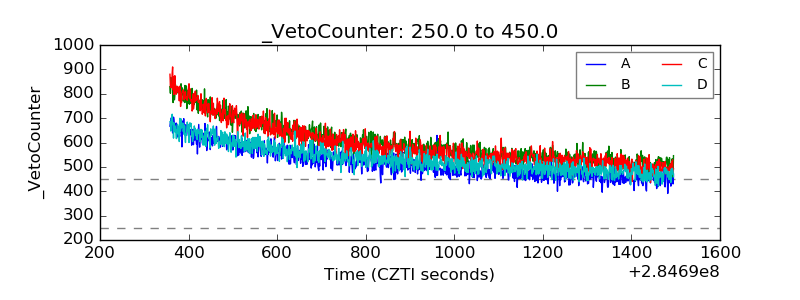 |