| Param | Original file | Final file |
|---|---|---|
| Filename | modeM0/AS1T03_070T05_9000002640cztM0_level2.fits | modeM0/AS1T03_070T05_9000002640cztM0_level2_quad_clean.evt |
| Size (bytes) | 232,076,160 | 207,990,720 |
| Size | 221.3 MB | 198.4 MB |
| Events in quadrant A | 1,424,734 | 1,218,442 |
| Events in quadrant B | 1,366,350 | 1,203,099 |
| Events in quadrant C | 1,378,780 | 1,158,405 |
| Events in quadrant D | 1,205,098 | 1,064,726 |
| Mode M9 | |||
|---|---|---|---|
| Quadrant | BADHDUFLAG | Total packets | Discarded packets |
| A | 0 | 38 | 0 |
| B | 0 | 38 | 0 |
| C | 0 | 38 | 0 |
| D | 0 | 38 | 0 |
| Mode SS | |||
|---|---|---|---|
| Quadrant | BADHDUFLAG | Total packets | Discarded packets |
| A | 0 | 490 | 0 |
| B | 0 | 490 | 0 |
| C | 0 | 490 | 0 |
| D | 0 | 490 | 0 |
| Mode M0 | |||
|---|---|---|---|
| Quadrant | BADHDUFLAG | Total packets | Discarded packets |
| A | 0 | 49220 | 0 |
| B | 0 | 53256 | 0 |
| C | 0 | 49485 | 0 |
| D | 0 | 52237 | 0 |
| Quadrant | Total seconds | Saturated seconds | Saturation percentage |
|---|---|---|---|
| A | 24028 | 249 | 1.036291% |
| B | 24028 | 589 | 2.451307% |
| C | 24028 | 300 | 1.248543% |
| D | 24028 | 372 | 1.548194% |
Noise dominated data is calculated using 1-second bins in cleaned event files. If a bin has >2000 counts, and if more than 50% of those come from <1% of pixels, then it is considered to be noise-dominated and hence unusable.
| Quadrant | # 1 sec bins | Bins with >0 counts | Bins with >2000 counts | High rate bins dominated by noise | Noise dominated (total time) | Noise dominated (detector-on time) | Marked lightcurve |
|---|---|---|---|---|---|---|---|
| A | 27883 | 24028 | 0 | 0 | 0.00% | 0.00% |  |
| B | 27883 | 24026 | 0 | 0 | 0.00% | 0.00% | 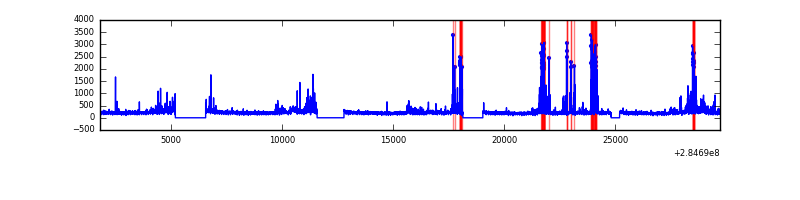 |
| C | 27883 | 24028 | 0 | 0 | 0.00% | 0.00% |  |
| D | 27883 | 24024 | 0 | 0 | 0.00% | 0.00% |  |
Top three noisy pixels from each quadrant. If the there are fewer than three noisy pixels in the level2.evt file, extra rows are filled as -1
| Pixel properties | Quadrant properties | ||||||
|---|---|---|---|---|---|---|---|
| Quadrant | DetID | PixID | Counts | Sigma | Mean | Median | Sigma |
| A | 0 | 29 | 1318 | 10.35 | 370 | 347 | 93.8 |
| A | 7 | 110 | 1203 | 9.13 | 370 | 347 | 93.8 |
| A | 0 | 30 | 1081 | 7.83 | 370 | 347 | 93.8 |
| B | 2 | 9 | 1066 | 9.81 | 361 | 345 | 73.5 |
| B | 2 | 8 | 922 | 7.85 | 361 | 345 | 73.5 |
| B | 5 | 232 | 911 | 7.7 | 361 | 345 | 73.5 |
| C | 1 | 81 | 1057 | 7.5 | 364 | 340 | 95.6 |
| C | 1 | 80 | 1036 | 7.28 | 364 | 340 | 95.6 |
| C | 12 | 241 | 1031 | 7.23 | 364 | 340 | 95.6 |
| D | 7 | 3 | 906 | 6.33 | 344 | 313 | 93.7 |
| D | 3 | 14 | 901 | 6.28 | 344 | 313 | 93.7 |
| D | 6 | 231 | 865 | 5.89 | 344 | 313 | 93.7 |
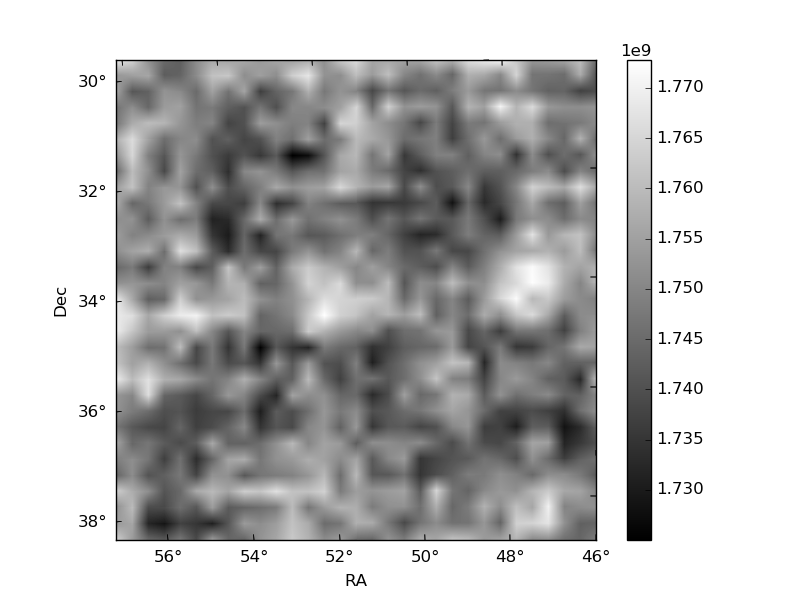
Histogram calculated using DETX and DETY for each event in the final _common_clean file
| Quadrant A |  |
 |
Quadrant B |
|---|---|---|---|
| Quadrant D |  |
 |
Quadrant C |
| Plot type | Count rate plots | Images |
|---|---|---|
| Comparison with Poisson distribution Blue bars denote a histogram of data divided into 1 sec bins. Red curve is a Poisson curve with rate = median count rate of data. |
 |
 |
| Quadrant-wise count rates Data is divided into 100 sec bins |
 |
|
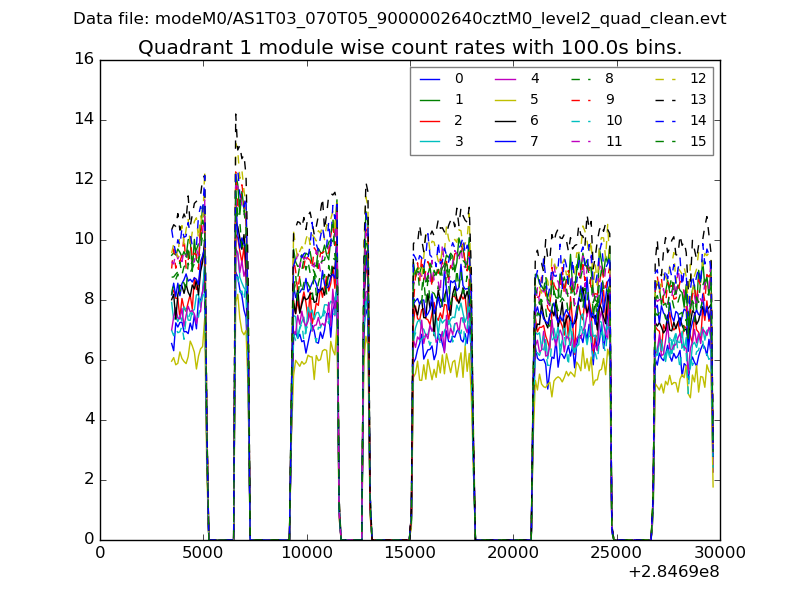
| Module-wise count rates for Quadrant A Data is divided into 100 sec bins |
 |
 |
| Module-wise count rates for Quadrant B Data is divided into 100 sec bins |
 |
 |
| Module-wise count rates for Quadrant C Data is divided into 100 sec bins |
 |
 |
| Module-wise count rates for Quadrant D Data is divided into 100 sec bins |
 |
 |
| Parameter | Plot |
|---|---|
| CZT HV Monitor | 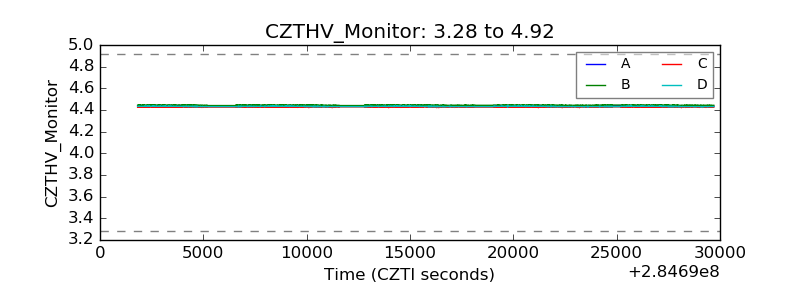 |
| D_VDD |  |
| Temperature 1 |  |
| Veto HV Monitor | 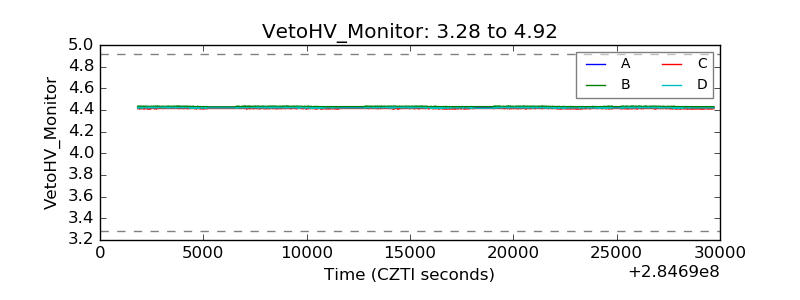 |
| Veto LLD |  |
| Alpha Counter |  |
| _CPM_Rate |  |
| CZT Counter |  |
| +2.5 Volts monitor | 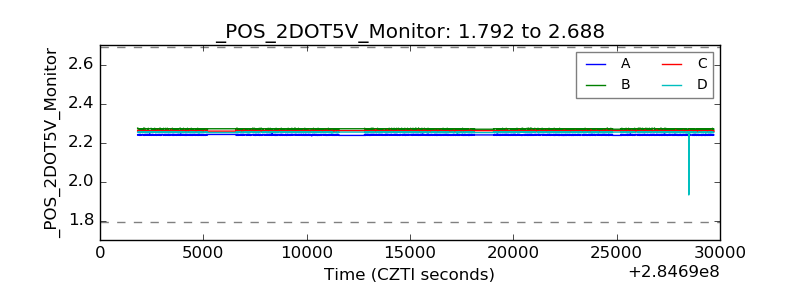 |
| +5 Volts monitor |  |
| _ROLL_ROT |  |
| _Roll_DEC | 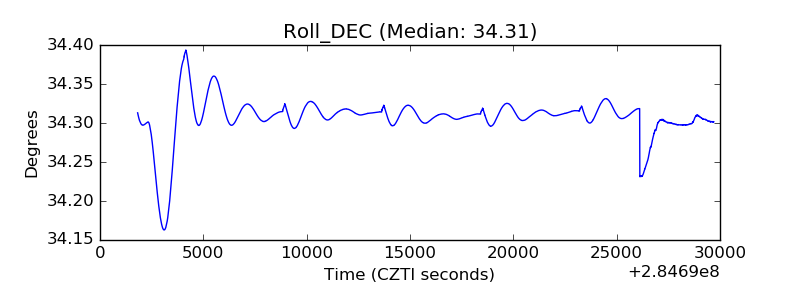 |
| _Roll_RA |  |
| Veto Counter |  |