| Param | Original file | Final file |
|---|---|---|
| Filename | modeM0/AS1T03_070T05_9000002640_17747cztM0_level2.evt | modeM0/AS1T03_070T05_9000002640_17747cztM0_level2_quad_clean.evt |
| Size (bytes) | 449,444,160 | 77,241,600 |
| Size | 428.6 MB | 73.7 MB |
| Events in quadrant A | 3,213,987 | 477,187 |
| Events in quadrant B | 3,496,727 | 486,869 |
| Events in quadrant C | 3,322,870 | 459,142 |
| Events in quadrant D | 3,126,529 | 452,767 |
| Mode M9 | |||
|---|---|---|---|
| Quadrant | BADHDUFLAG | Total packets | Discarded packets |
| A | 0 | 26 | 0 |
| B | 0 | 26 | 0 |
| C | 0 | 26 | 0 |
| D | 0 | 26 | 0 |
| Mode SS | |||
|---|---|---|---|
| Quadrant | BADHDUFLAG | Total packets | Discarded packets |
| A | 0 | 138 | 0 |
| B | 0 | 138 | 0 |
| C | 0 | 138 | 0 |
| D | 0 | 138 | 0 |
| Mode M0 | |||
|---|---|---|---|
| Quadrant | BADHDUFLAG | Total packets | Discarded packets |
| A | 0 | 13780 | 1 |
| B | 0 | 14574 | 1 |
| C | 0 | 13890 | 1 |
| D | 0 | 13919 | 1 |
| Quadrant | Total seconds | Saturated seconds | Saturation percentage |
|---|---|---|---|
| A | 6636 | 66 | 0.994575% |
| B | 6636 | 130 | 1.959011% |
| C | 6636 | 81 | 1.220615% |
| D | 6635 | 20 | 0.301432% |
Noise dominated data is calculated using 1-second bins in cleaned event files. If a bin has >2000 counts, and if more than 50% of those come from <1% of pixels, then it is considered to be noise-dominated and hence unusable.
| Quadrant | # 1 sec bins | Bins with >0 counts | Bins with >2000 counts | High rate bins dominated by noise | Noise dominated (total time) | Noise dominated (detector-on time) | Marked lightcurve |
|---|---|---|---|---|---|---|---|
| A | 9211 | 6638 | 0 | 0 | 0.00% | 0.00% | 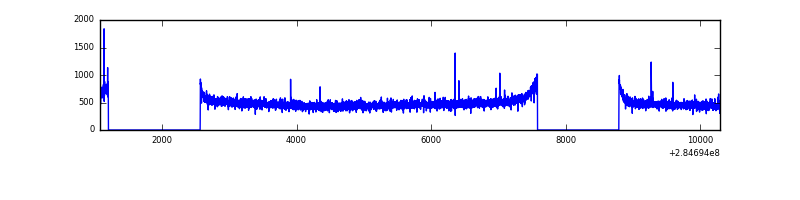 |
| B | 9211 | 6638 | 10 | 10 | 0.11% | 0.15% | 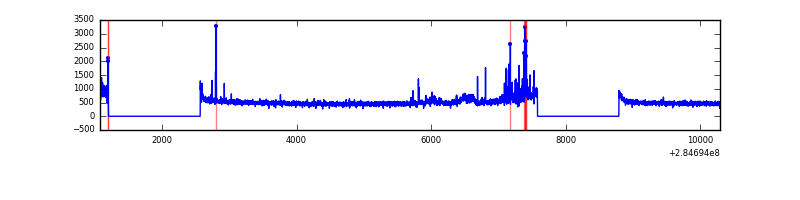 |
| C | 9211 | 6638 | 0 | 0 | 0.00% | 0.00% | 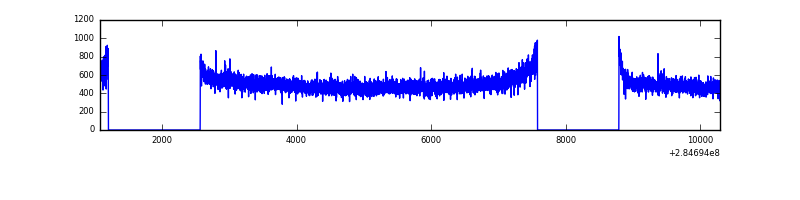 |
| D | 9210 | 6637 | 1 | 1 | 0.01% | 0.02% | 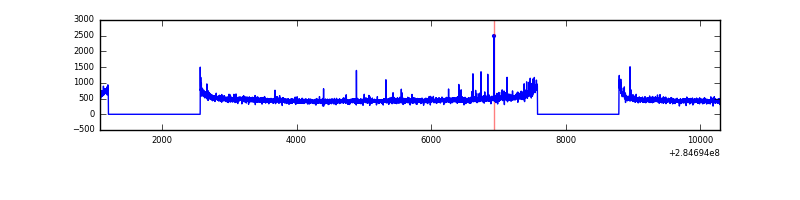 |
Top three noisy pixels from each quadrant. If the there are fewer than three noisy pixels in the level2.evt file, extra rows are filled as -1
| Pixel properties | Quadrant properties | ||||||
|---|---|---|---|---|---|---|---|
| Quadrant | DetID | PixID | Counts | Sigma | Mean | Median | Sigma |
| A | 15 | 174 | 12009 | 66.81 | 831 | 814 | 167.6 |
| A | 0 | 226 | 7303 | 38.72 | 831 | 814 | 167.6 |
| A | 12 | 194 | 6034 | 31.15 | 831 | 814 | 167.6 |
| B | 7 | 220 | 81370 | 515.16 | 836 | 818 | 156.4 |
| B | 0 | 189 | 71661 | 453.07 | 836 | 818 | 156.4 |
| B | 0 | 219 | 23732 | 146.54 | 836 | 818 | 156.4 |
| C | 14 | 238 | 125324 | 668.96 | 801 | 808 | 186.1 |
| C | 5 | 218 | 41231 | 217.17 | 801 | 808 | 186.1 |
| C | 5 | 219 | 15408 | 78.44 | 801 | 808 | 186.1 |
| D | 2 | 234 | 28556 | 130.75 | 796 | 784 | 212.4 |
| D | 1 | 52 | 27013 | 123.49 | 796 | 784 | 212.4 |
| D | 7 | 238 | 14404 | 64.12 | 796 | 784 | 212.4 |
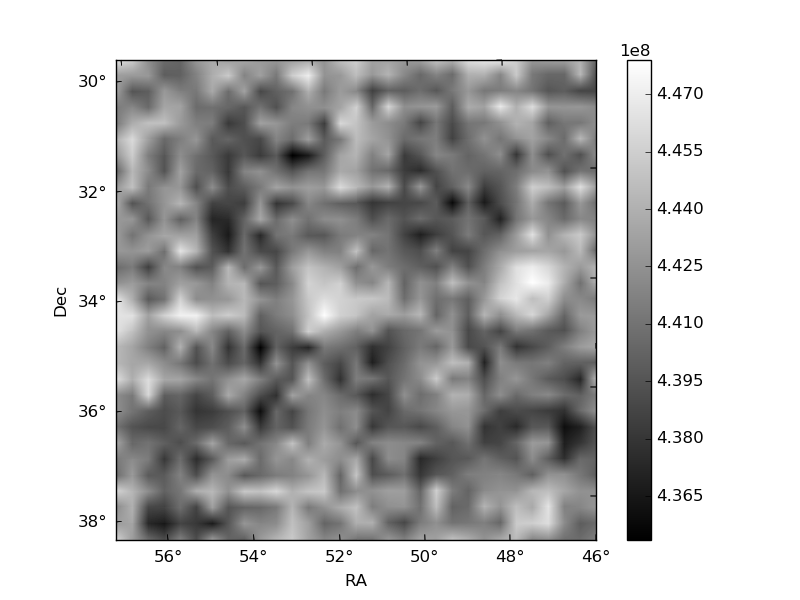
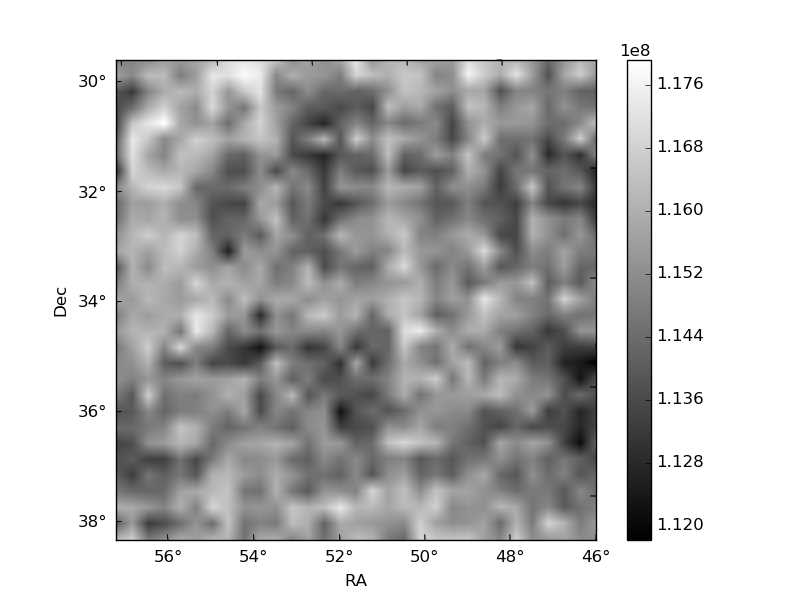
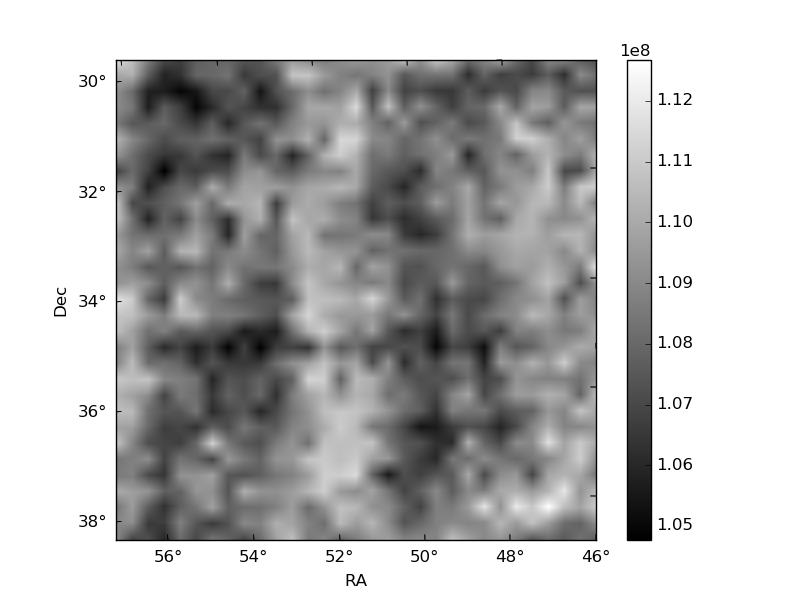
Histogram calculated using DETX and DETY for each event in the final _common_clean file
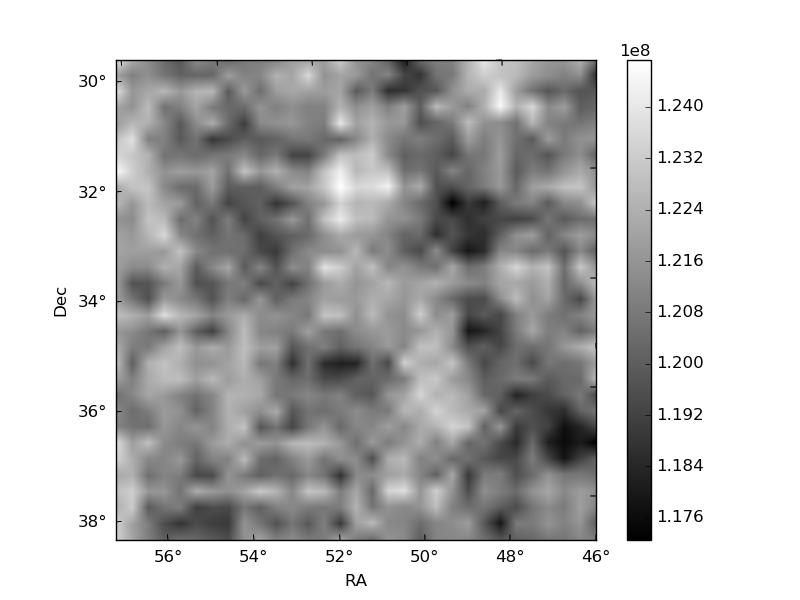
| Quadrant A | 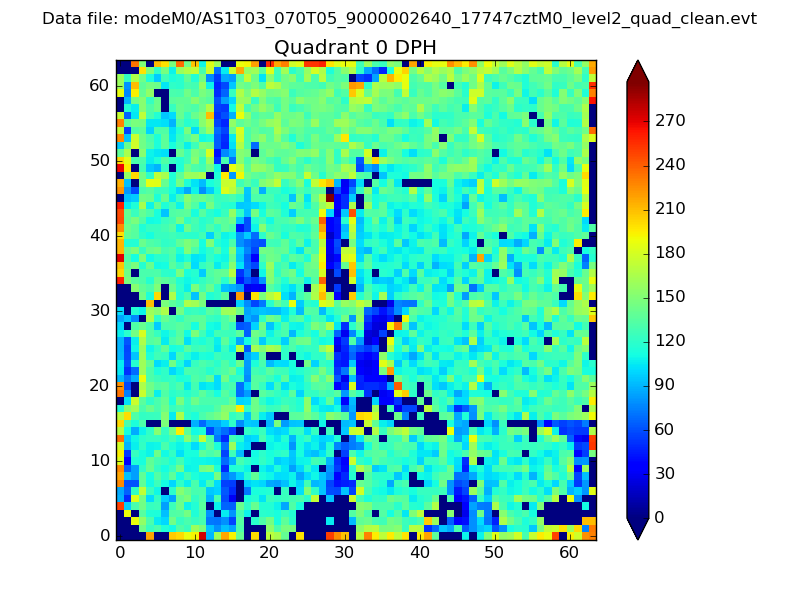 |
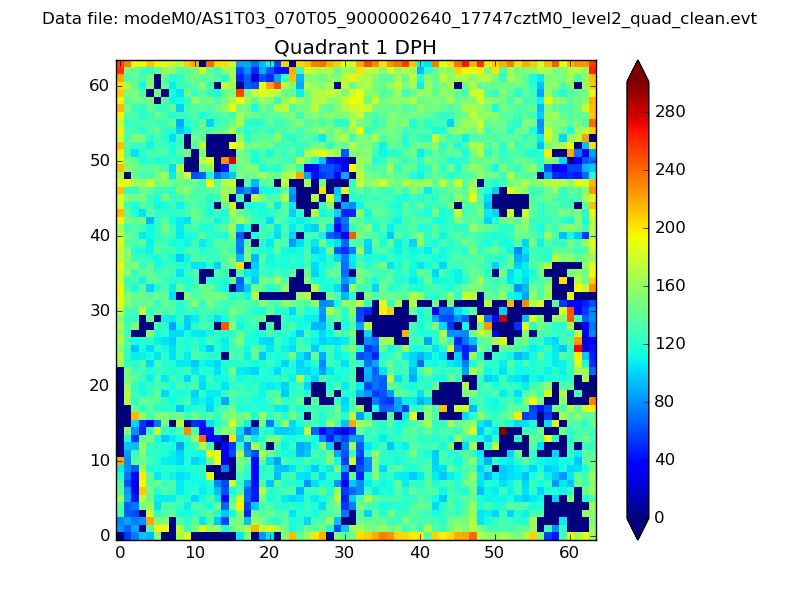 |
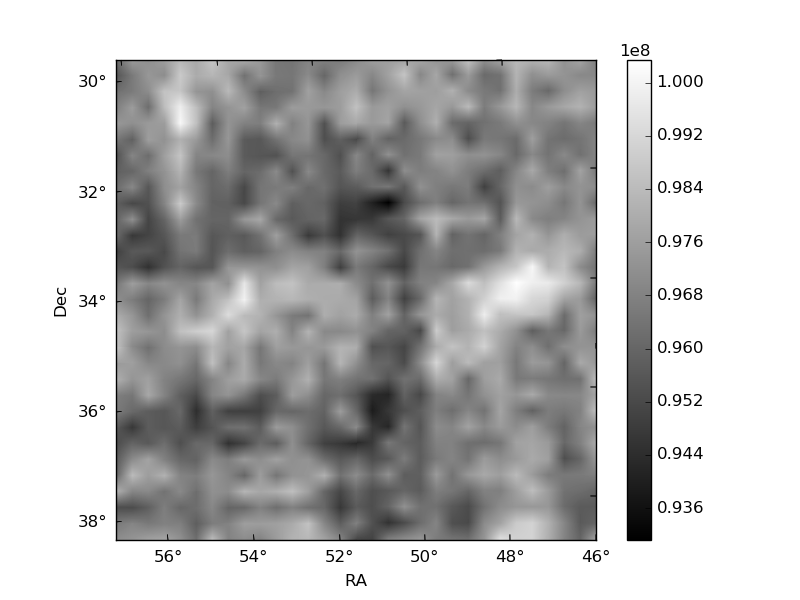
Quadrant B |
|---|---|---|---|
| Quadrant D | 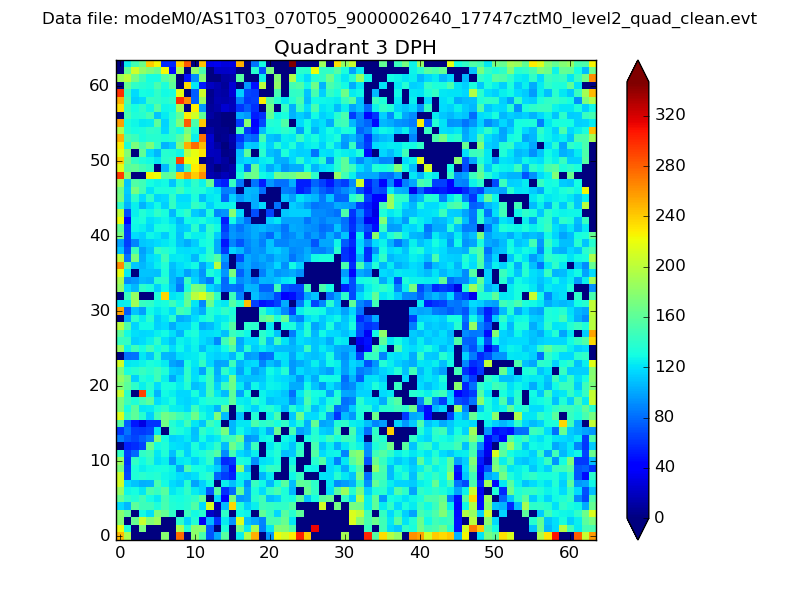 |
 |
Quadrant C |
| Plot type | Count rate plots | Images |
|---|---|---|
| Comparison with Poisson distribution Blue bars denote a histogram of data divided into 1 sec bins. Red curve is a Poisson curve with rate = median count rate of data. |
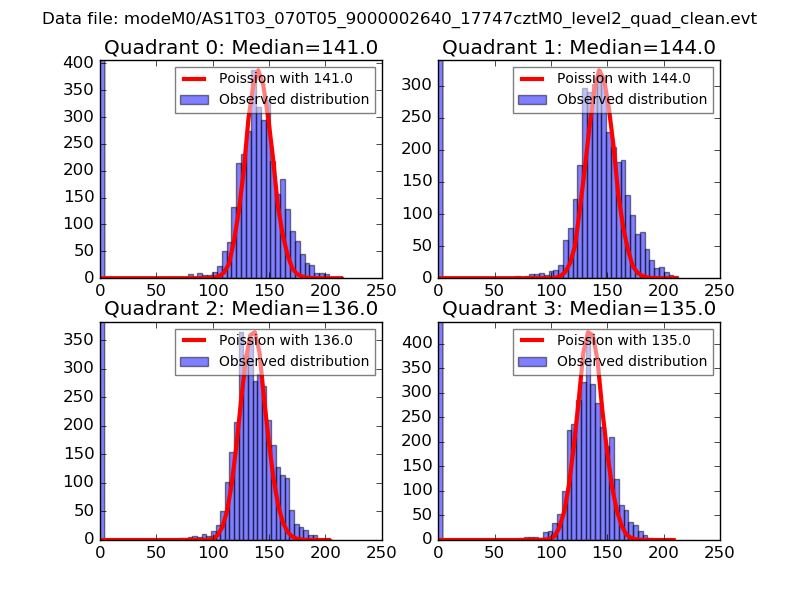 |
 |
| Quadrant-wise count rates Data is divided into 100 sec bins |
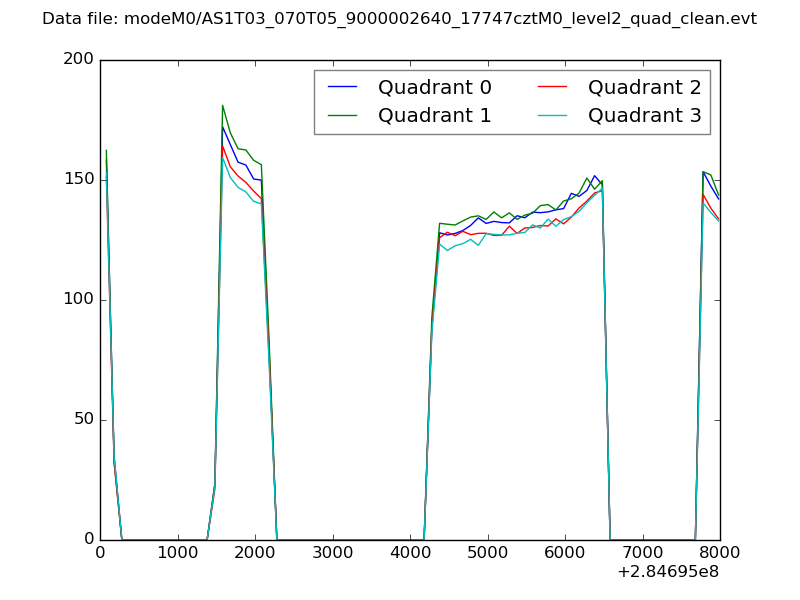 |
|
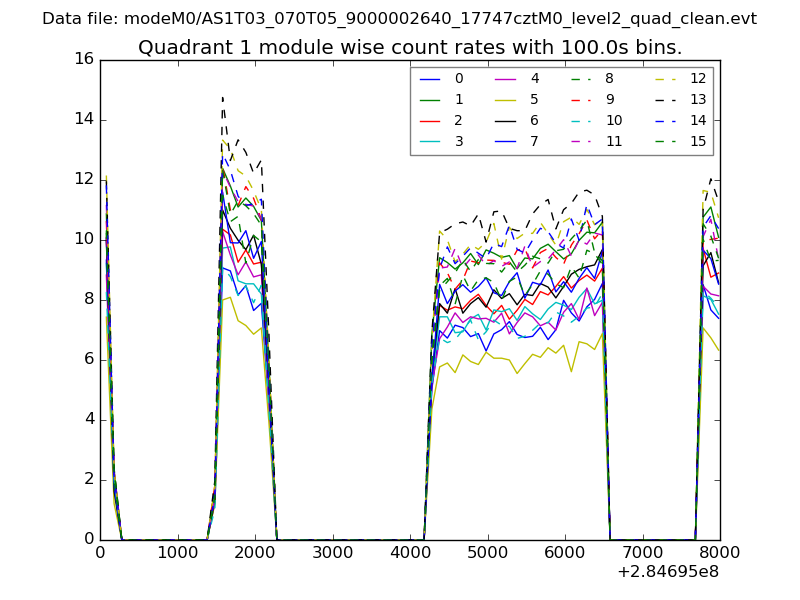
| Module-wise count rates for Quadrant A Data is divided into 100 sec bins |
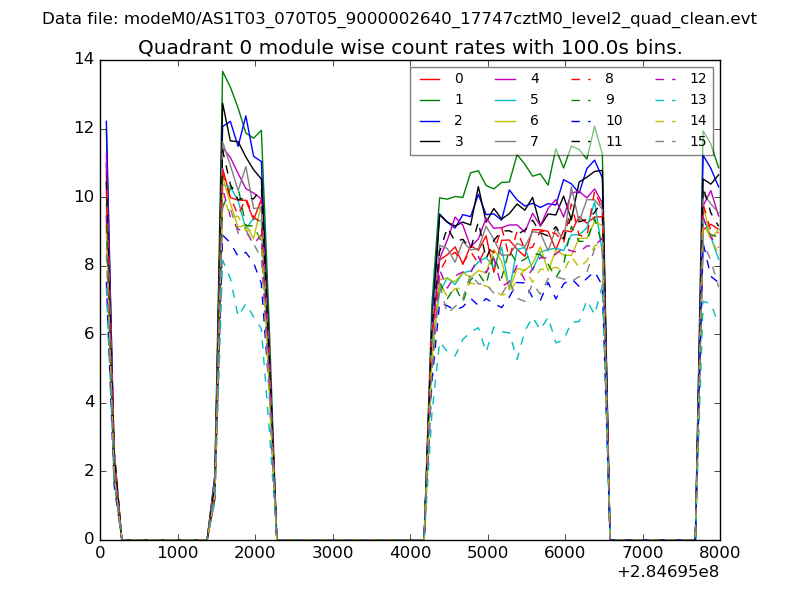 |
 |
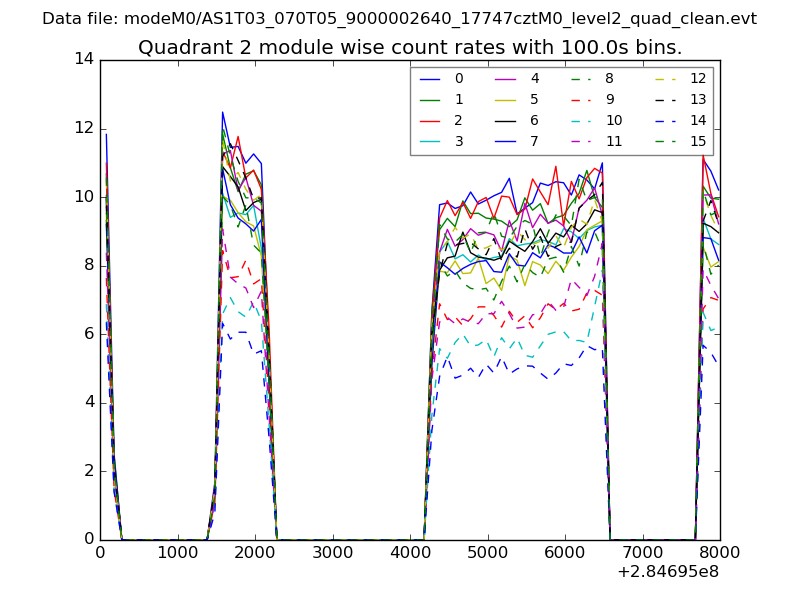
| Module-wise count rates for Quadrant B Data is divided into 100 sec bins |
 |
 |
| Module-wise count rates for Quadrant C Data is divided into 100 sec bins |
 |
 |
| Module-wise count rates for Quadrant D Data is divided into 100 sec bins |
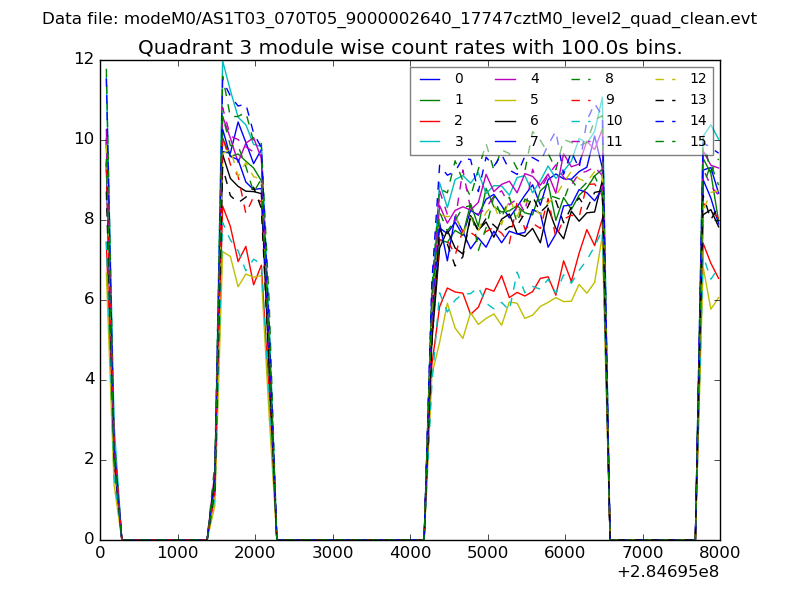 |
 |
| Parameter | Plot |
|---|---|
| CZT HV Monitor |  |
| D_VDD | 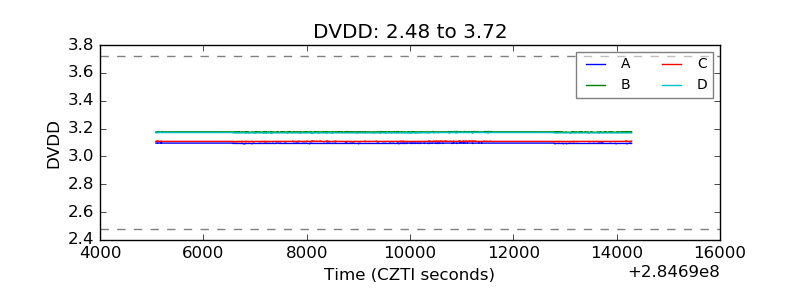 |
| Temperature 1 | 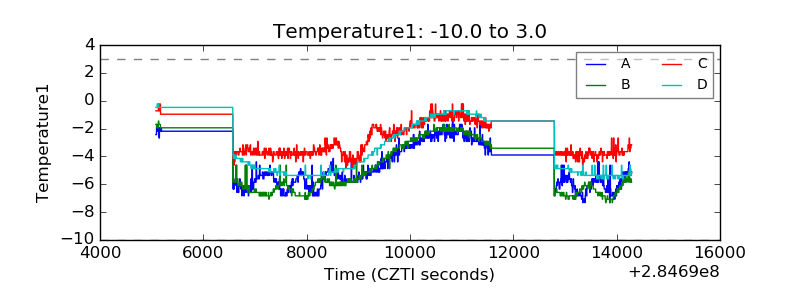 |
| Veto HV Monitor | 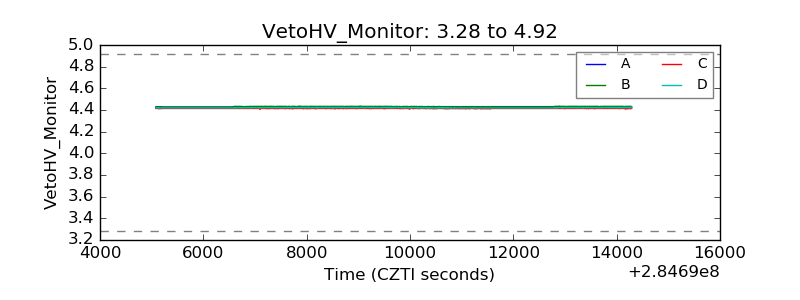 |
| Veto LLD | 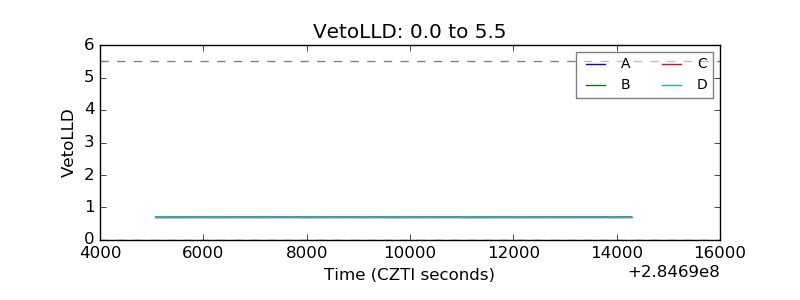 |
| Alpha Counter | 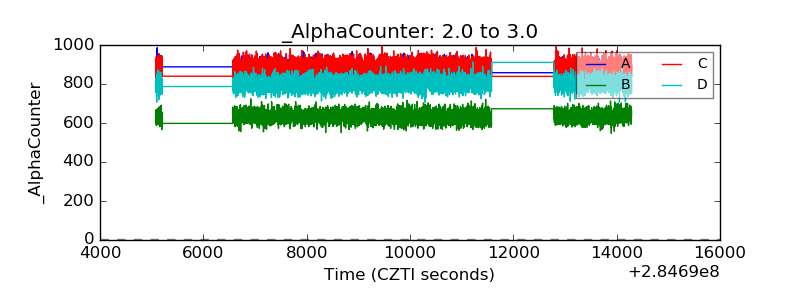 |
| _CPM_Rate | 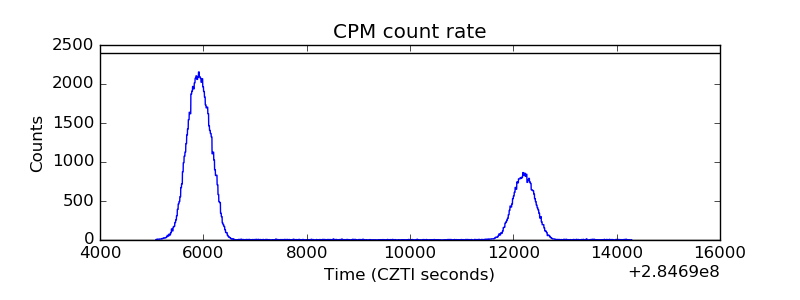 |
| CZT Counter |  |
| +2.5 Volts monitor |  |
| +5 Volts monitor | 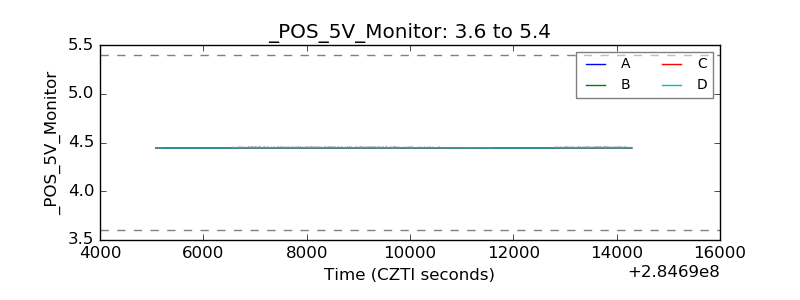 |
| _ROLL_ROT | 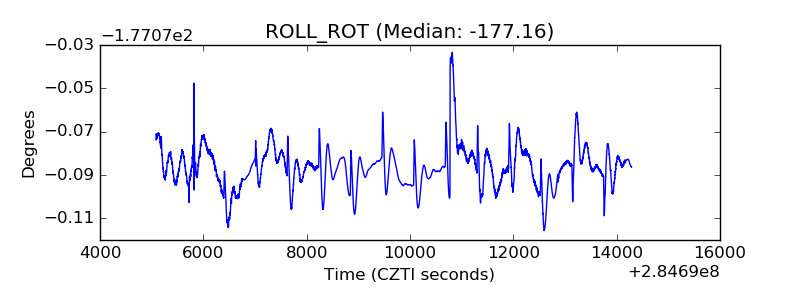 |
| _Roll_DEC | 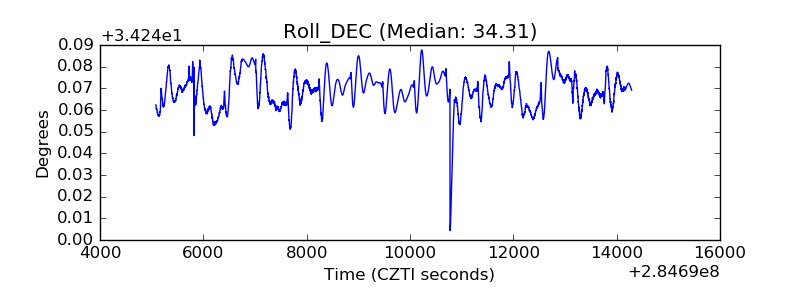 |
| _Roll_RA | 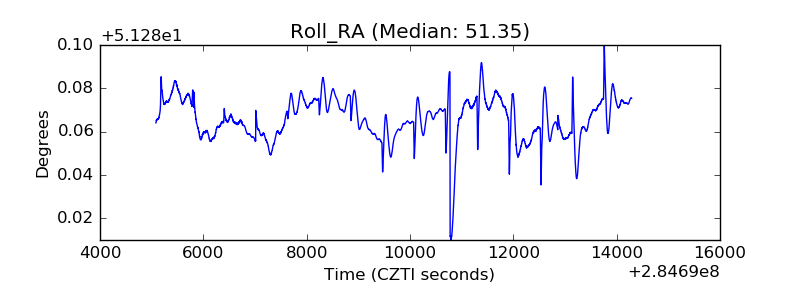 |
| Veto Counter | 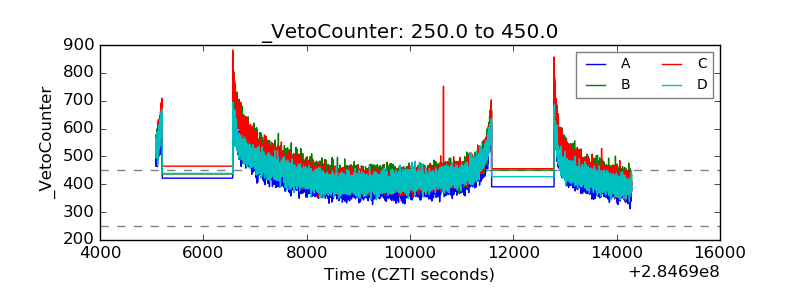 |