| Param | Original file | Final file |
|---|---|---|
| Filename | modeM0/AS1T03_070T05_9000002640_17750cztM0_level2.evt | modeM0/AS1T03_070T05_9000002640_17750cztM0_level2_quad_clean.evt |
| Size (bytes) | 372,559,680 | 72,423,360 |
| Size | 355.3 MB | 69.1 MB |
| Events in quadrant A | 2,494,827 | 460,885 |
| Events in quadrant B | 3,103,442 | 457,117 |
| Events in quadrant C | 2,610,062 | 448,041 |
| Events in quadrant D | 2,703,395 | 445,697 |
| Mode M9 | |||
|---|---|---|---|
| Quadrant | BADHDUFLAG | Total packets | Discarded packets |
| A | 0 | 3 | 0 |
| B | 0 | 3 | 0 |
| C | 0 | 3 | 0 |
| D | 0 | 3 | 0 |
| Mode SS | |||
|---|---|---|---|
| Quadrant | BADHDUFLAG | Total packets | Discarded packets |
| A | 0 | 114 | 0 |
| B | 0 | 114 | 0 |
| C | 0 | 114 | 0 |
| D | 0 | 114 | 0 |
| Mode M0 | |||
|---|---|---|---|
| Quadrant | BADHDUFLAG | Total packets | Discarded packets |
| A | 0 | 11183 | 1 |
| B | 0 | 12751 | 1 |
| C | 0 | 11275 | 1 |
| D | 0 | 11924 | 1 |
| Quadrant | Total seconds | Saturated seconds | Saturation percentage |
|---|---|---|---|
| A | 5436 | 125 | 2.299485% |
| B | 5437 | 267 | 4.910796% |
| C | 5437 | 137 | 2.519772% |
| D | 5437 | 142 | 2.611734% |
Noise dominated data is calculated using 1-second bins in cleaned event files. If a bin has >2000 counts, and if more than 50% of those come from <1% of pixels, then it is considered to be noise-dominated and hence unusable.
| Quadrant | # 1 sec bins | Bins with >0 counts | Bins with >2000 counts | High rate bins dominated by noise | Noise dominated (total time) | Noise dominated (detector-on time) | Marked lightcurve |
|---|---|---|---|---|---|---|---|
| A | 5816 | 5437 | 0 | 0 | 0.00% | 0.00% |  |
| B | 5817 | 5438 | 78 | 78 | 1.34% | 1.43% |  |
| C | 5817 | 5438 | 2 | 2 | 0.03% | 0.04% | 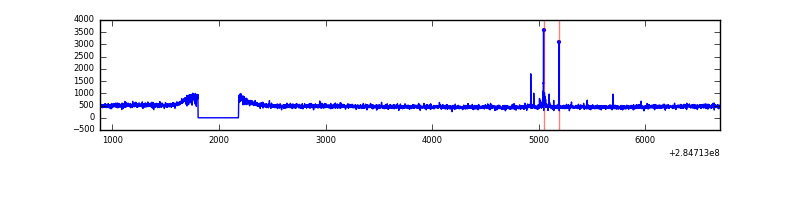 |
| D | 5817 | 5438 | 42 | 42 | 0.72% | 0.77% | 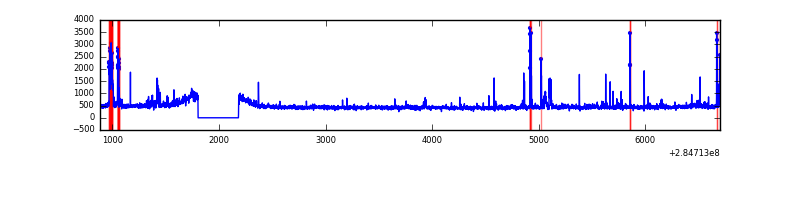 |
Top three noisy pixels from each quadrant. If the there are fewer than three noisy pixels in the level2.evt file, extra rows are filled as -1
| Pixel properties | Quadrant properties | ||||||
|---|---|---|---|---|---|---|---|
| Quadrant | DetID | PixID | Counts | Sigma | Mean | Median | Sigma |
| A | 0 | 226 | 5512 | 36.61 | 648 | 633 | 133.3 |
| A | 3 | 137 | 4971 | 32.55 | 648 | 633 | 133.3 |
| A | 12 | 194 | 4768 | 31.03 | 648 | 633 | 133.3 |
| B | 10 | 245 | 352146 | 2830.59 | 642 | 624 | 124.2 |
| B | 7 | 220 | 150883 | 1209.94 | 642 | 624 | 124.2 |
| B | 0 | 219 | 25830 | 202.97 | 642 | 624 | 124.2 |
| C | 14 | 238 | 94019 | 630.9 | 624 | 626 | 148.0 |
| C | 5 | 218 | 39827 | 264.82 | 624 | 626 | 148.0 |
| C | 0 | 207 | 25434 | 167.59 | 624 | 626 | 148.0 |
| D | 2 | 165 | 97623 | 631.56 | 631 | 613 | 153.6 |
| D | 5 | 222 | 90176 | 583.08 | 631 | 613 | 153.6 |
| D | 7 | 38 | 41568 | 266.63 | 631 | 613 | 153.6 |
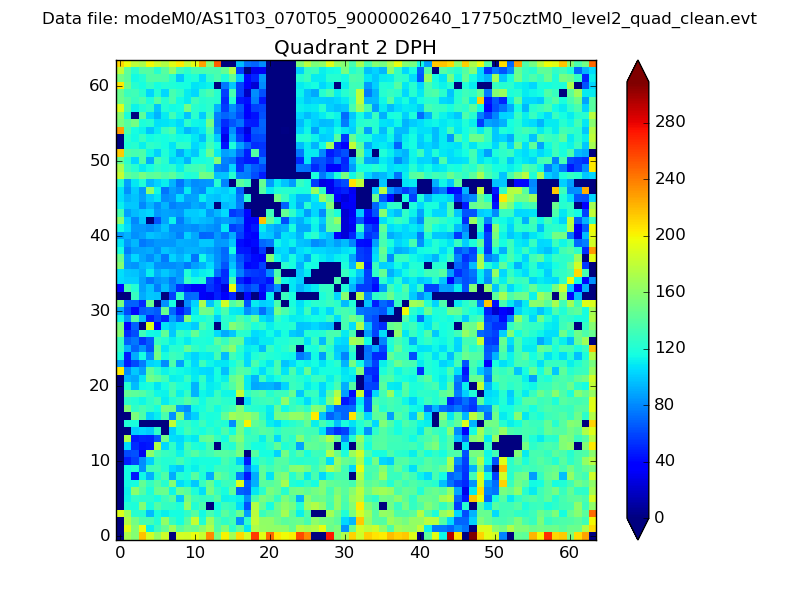
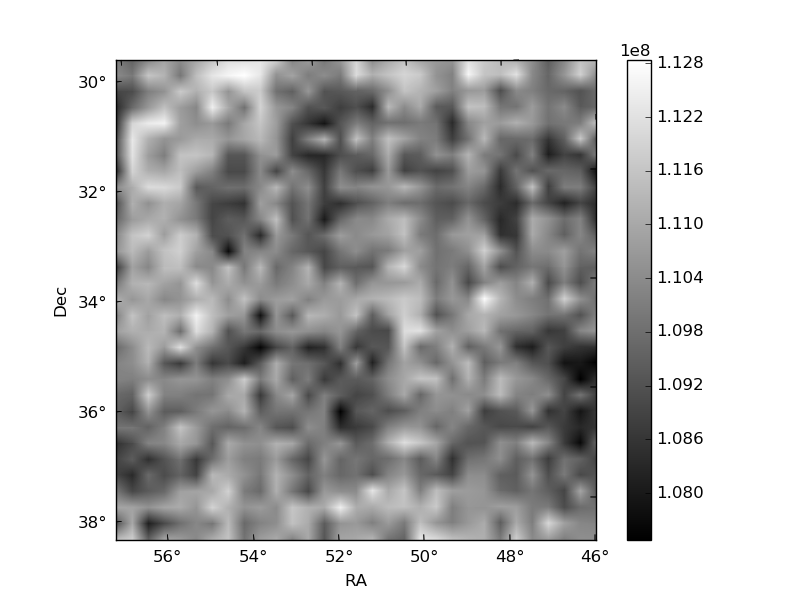
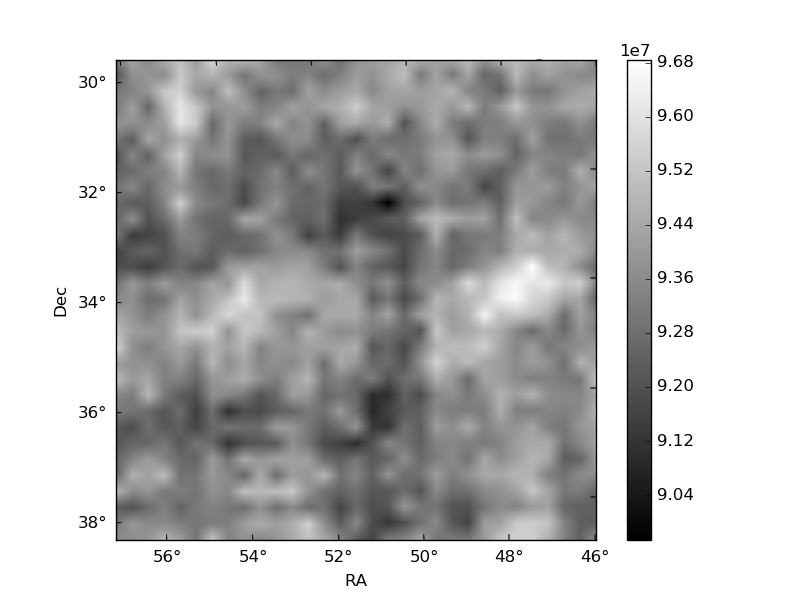
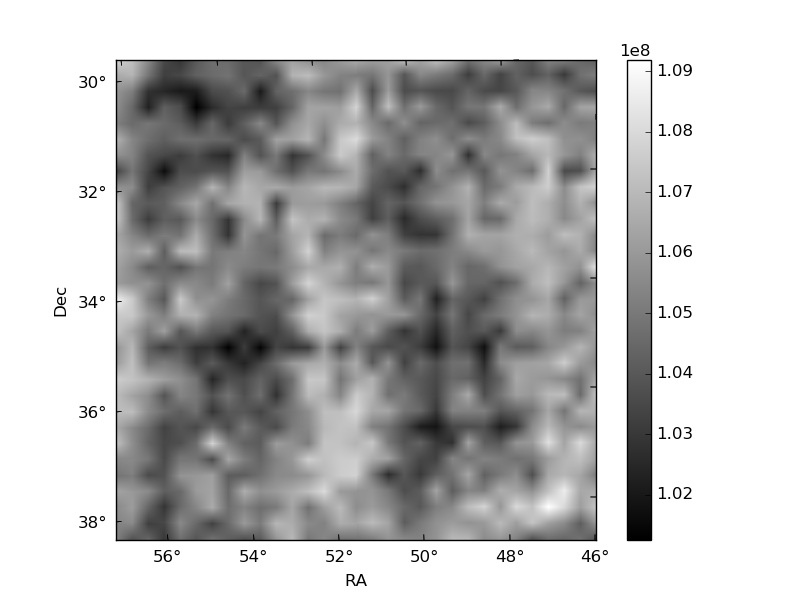
Histogram calculated using DETX and DETY for each event in the final _common_clean file
| Quadrant A | 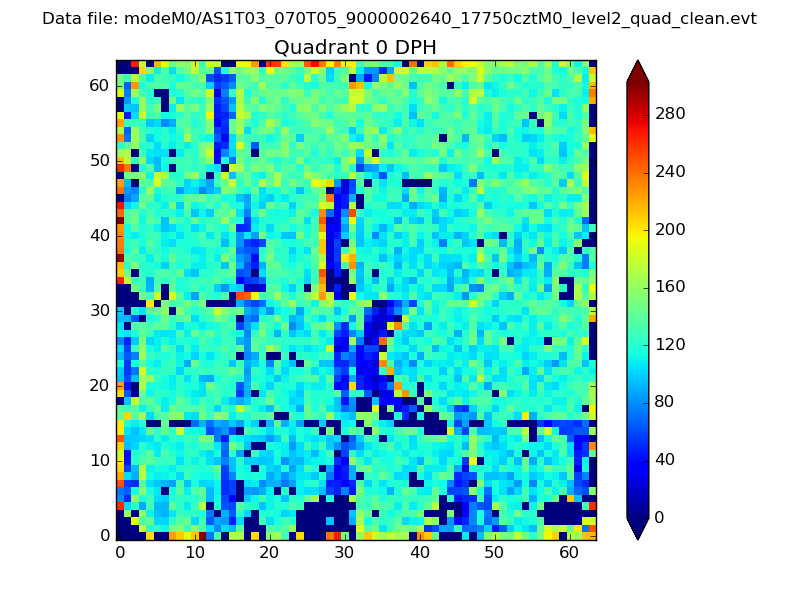 |
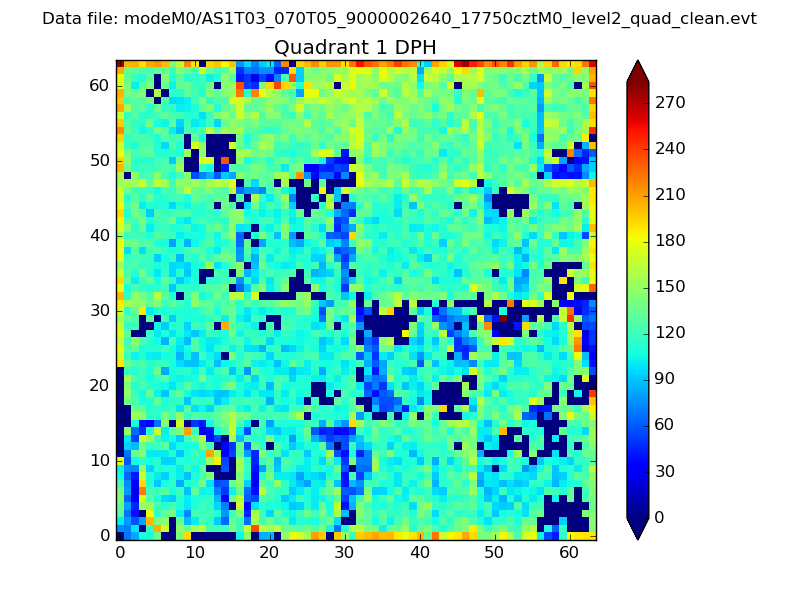 |
Quadrant B |
|---|---|---|---|
| Quadrant D | 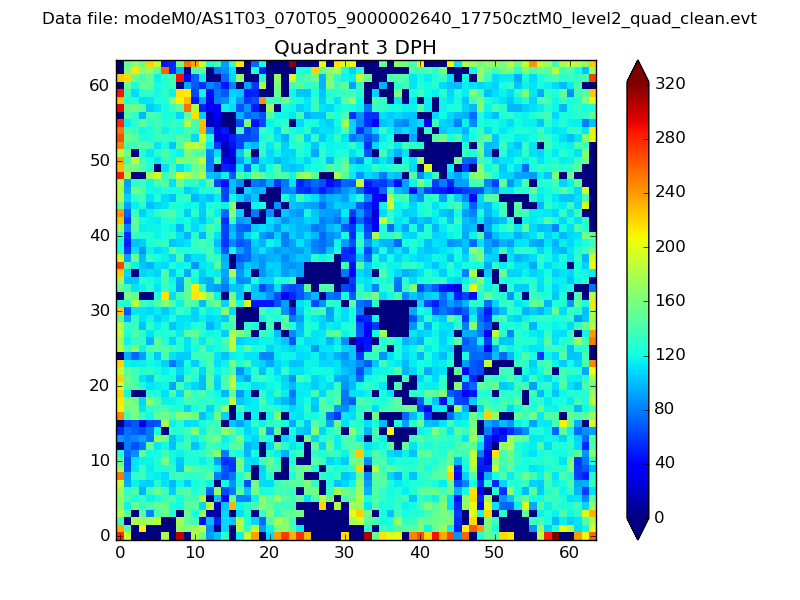 |
 |
Quadrant C |
| Plot type | Count rate plots | Images |
|---|---|---|
| Comparison with Poisson distribution Blue bars denote a histogram of data divided into 1 sec bins. Red curve is a Poisson curve with rate = median count rate of data. |
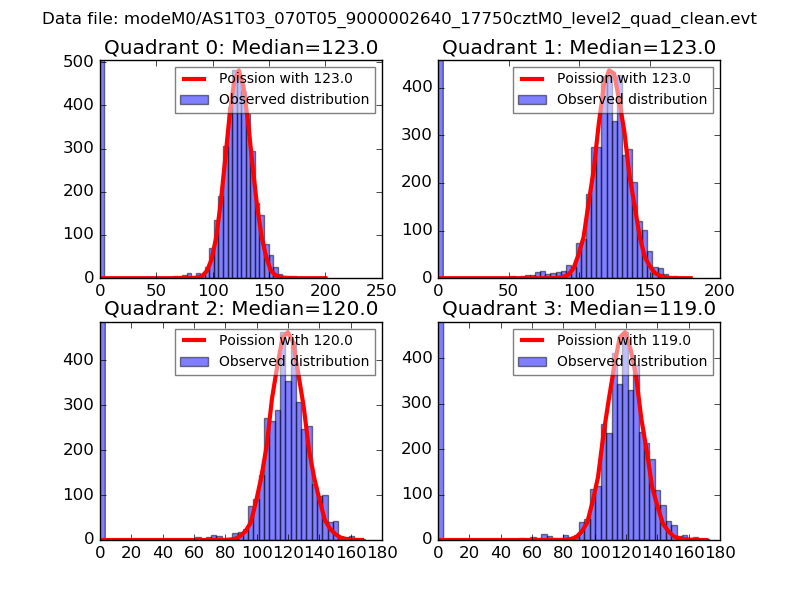 |
 |
| Quadrant-wise count rates Data is divided into 100 sec bins |
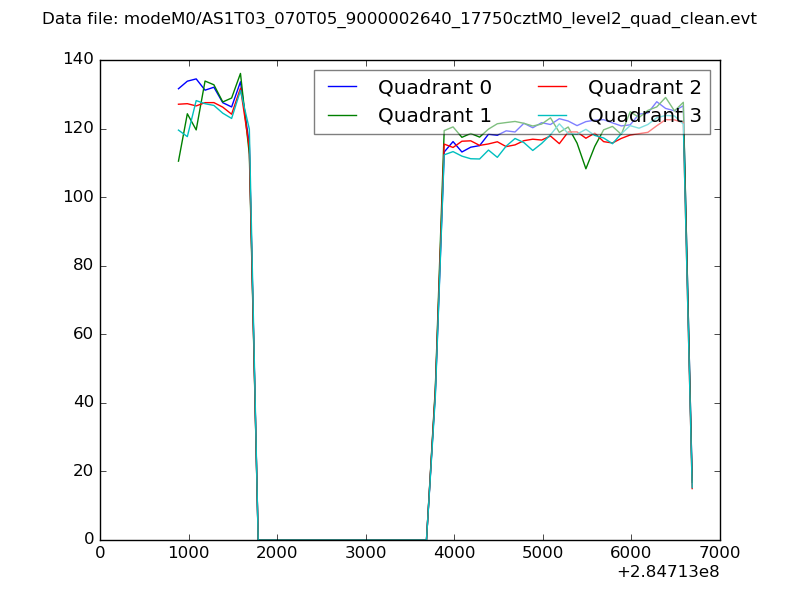 |
|
| Module-wise count rates for Quadrant A Data is divided into 100 sec bins |
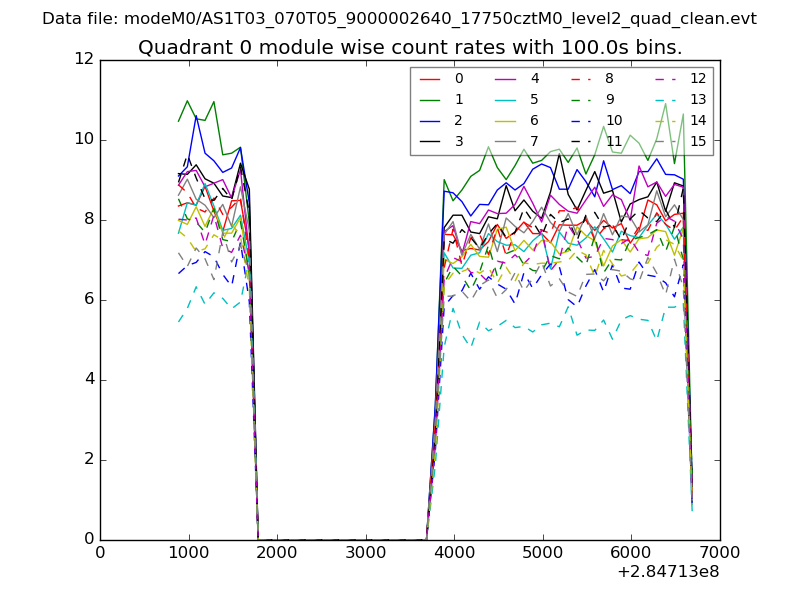 |
 |
| Module-wise count rates for Quadrant B Data is divided into 100 sec bins |
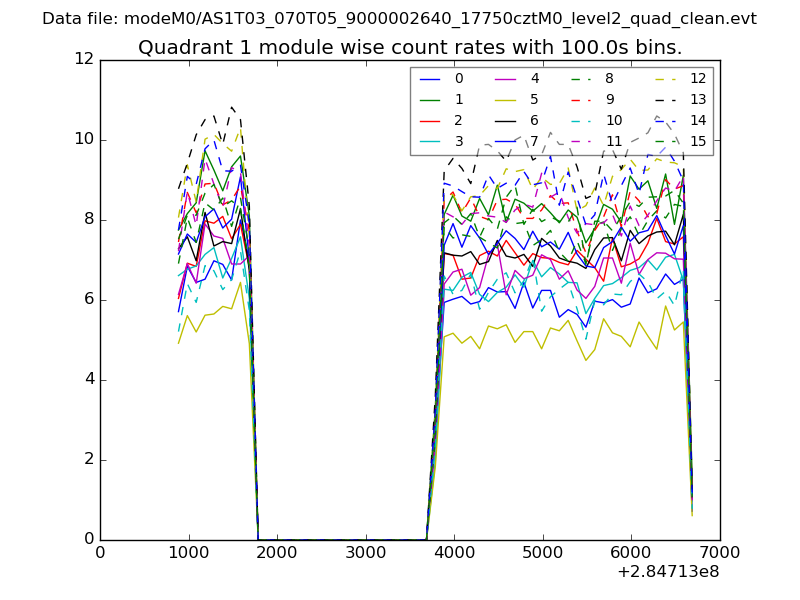 |
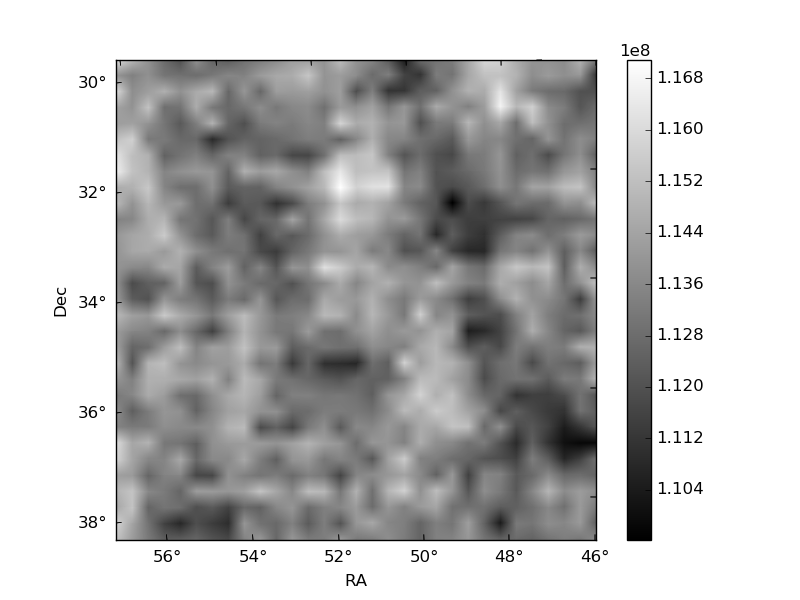 |
| Module-wise count rates for Quadrant C Data is divided into 100 sec bins |
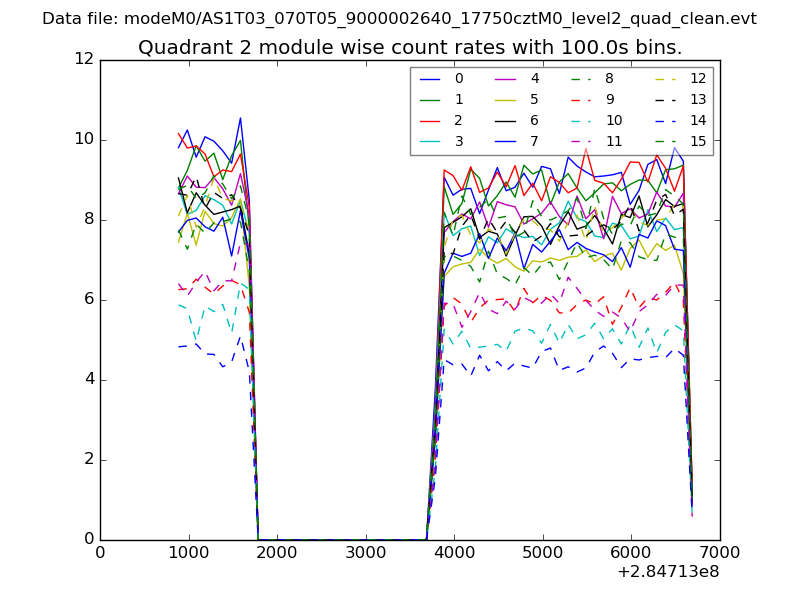 |
 |
| Module-wise count rates for Quadrant D Data is divided into 100 sec bins |
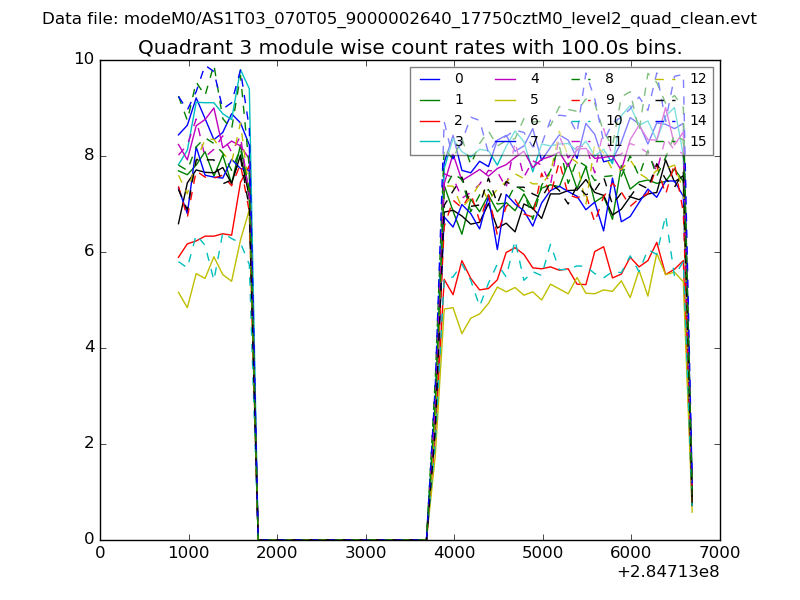 |
 |
| Parameter | Plot |
|---|---|
| CZT HV Monitor | 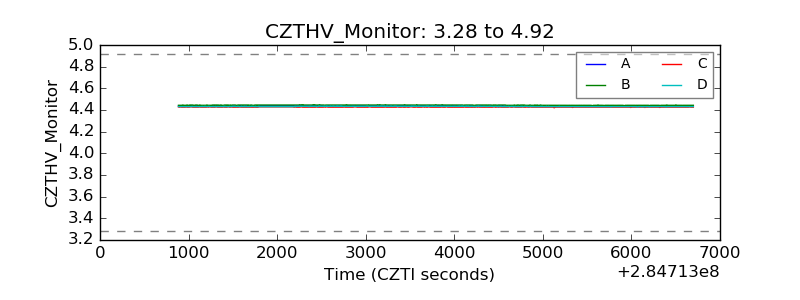 |
| D_VDD | 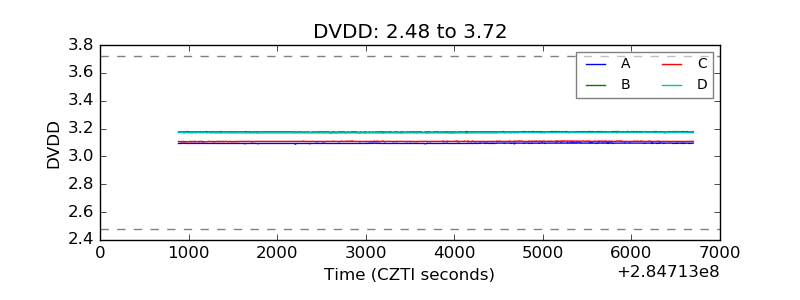 |
| Temperature 1 | 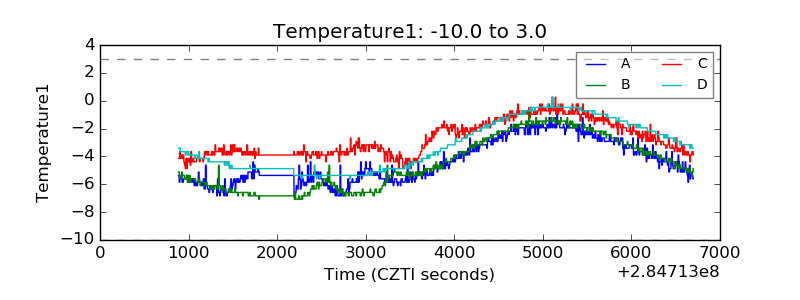 |
| Veto HV Monitor | 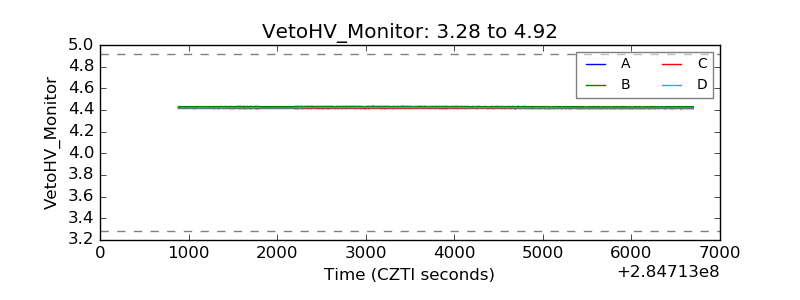 |
| Veto LLD | 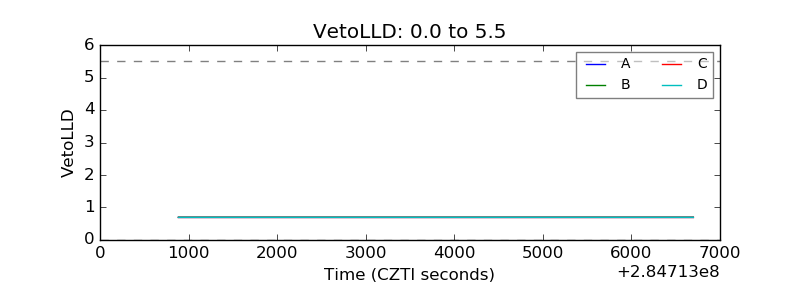 |
| Alpha Counter | 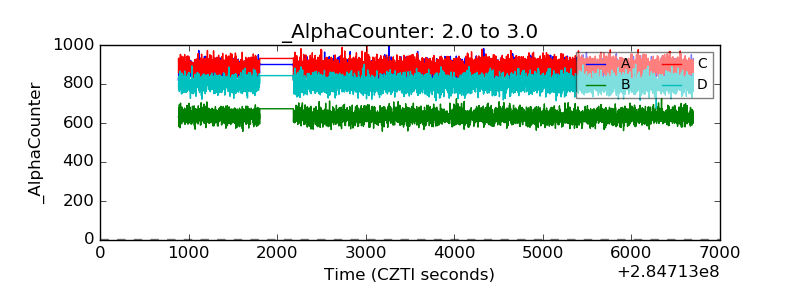 |
| _CPM_Rate | 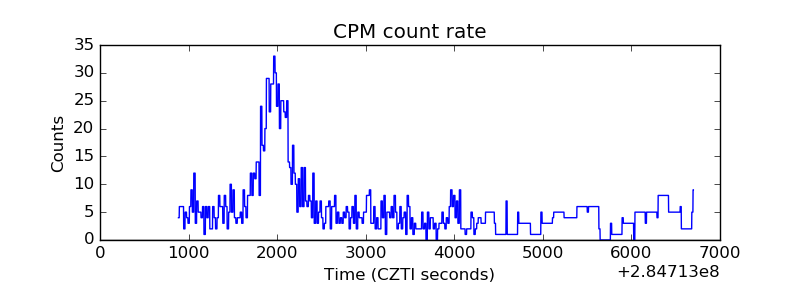 |
| CZT Counter | 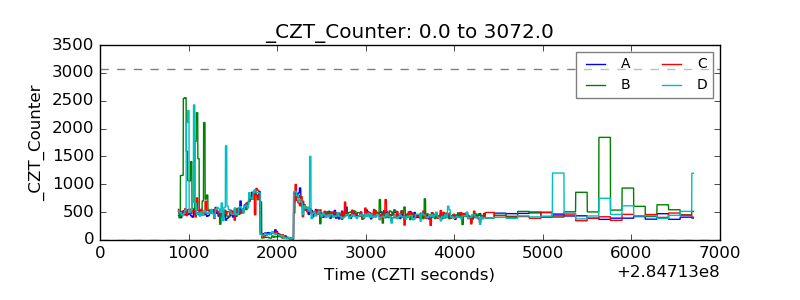 |
| +2.5 Volts monitor |  |
| +5 Volts monitor |  |
| _ROLL_ROT | 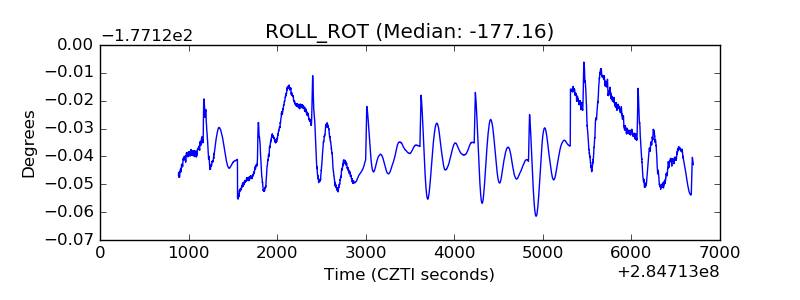 |
| _Roll_DEC | 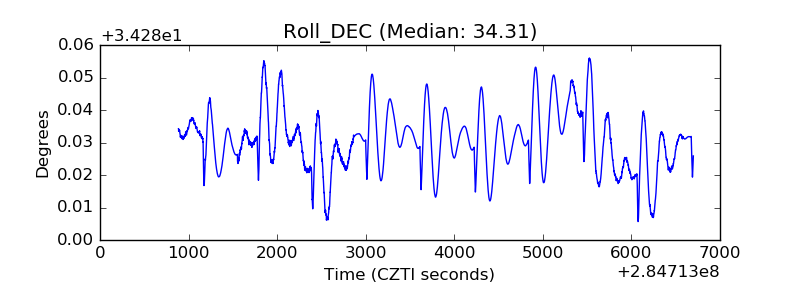 |
| _Roll_RA | 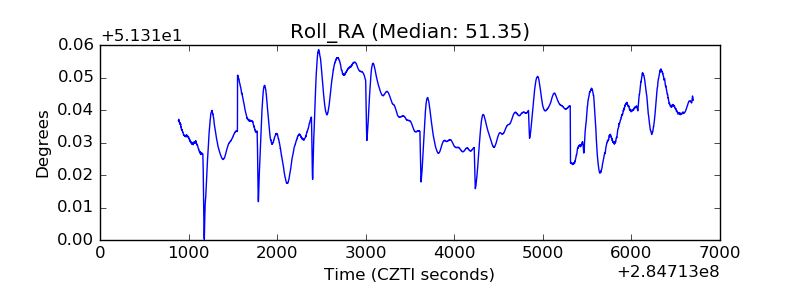 |
| Veto Counter | 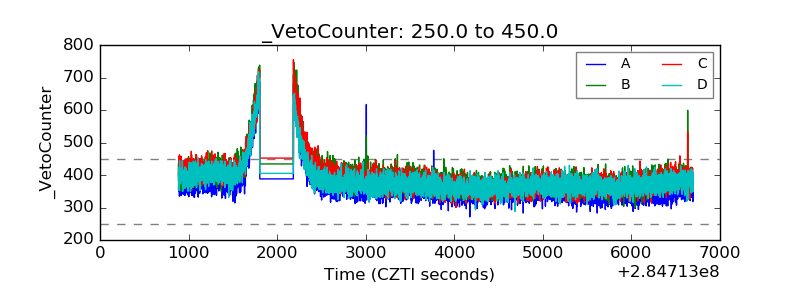 |