| Param | Original file | Final file |
|---|---|---|
| Filename | modeM0/AS1T03_070T06_9000002642cztM0_level2.fits | modeM0/AS1T03_070T06_9000002642cztM0_level2_quad_clean.evt |
| Size (bytes) | 148,864,320 | 151,009,920 |
| Size | 142.0 MB | 144.0 MB |
| Events in quadrant A | 897,586 | 907,425 |
| Events in quadrant B | 860,946 | 898,775 |
| Events in quadrant C | 864,922 | 848,061 |
| Events in quadrant D | 767,562 | 801,719 |
| Mode M9 | |||
|---|---|---|---|
| Quadrant | BADHDUFLAG | Total packets | Discarded packets |
| A | 0 | 8 | 0 |
| B | 0 | 8 | 0 |
| C | 0 | 8 | 0 |
| D | 0 | 8 | 0 |
| Mode SS | |||
|---|---|---|---|
| Quadrant | BADHDUFLAG | Total packets | Discarded packets |
| A | 0 | 328 | 0 |
| B | 0 | 328 | 0 |
| C | 0 | 328 | 0 |
| D | 0 | 328 | 0 |
| Mode M0 | |||
|---|---|---|---|
| Quadrant | BADHDUFLAG | Total packets | Discarded packets |
| A | 0 | 33380 | 0 |
| B | 0 | 34733 | 0 |
| C | 0 | 35571 | 0 |
| D | 0 | 35009 | 0 |
| Quadrant | Total seconds | Saturated seconds | Saturation percentage |
|---|---|---|---|
| A | 16199 | 461 | 2.845855% |
| B | 16199 | 549 | 3.389098% |
| C | 16199 | 633 | 3.907649% |
| D | 16199 | 405 | 2.500154% |
Noise dominated data is calculated using 1-second bins in cleaned event files. If a bin has >2000 counts, and if more than 50% of those come from <1% of pixels, then it is considered to be noise-dominated and hence unusable.
| Quadrant | # 1 sec bins | Bins with >0 counts | Bins with >2000 counts | High rate bins dominated by noise | Noise dominated (total time) | Noise dominated (detector-on time) | Marked lightcurve |
|---|---|---|---|---|---|---|---|
| A | 16919 | 16197 | 0 | 0 | 0.00% | 0.00% | 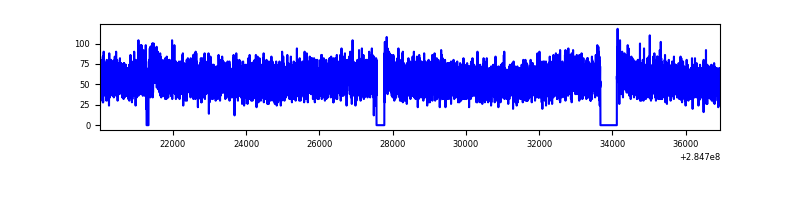 |
| B | 16919 | 16199 | 0 | 0 | 0.00% | 0.00% | 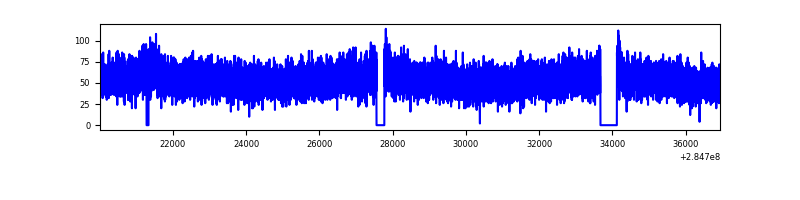 |
| C | 16919 | 16188 | 0 | 0 | 0.00% | 0.00% | 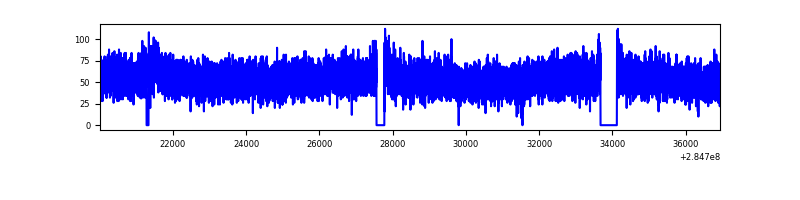 |
| D | 16919 | 16197 | 0 | 0 | 0.00% | 0.00% | 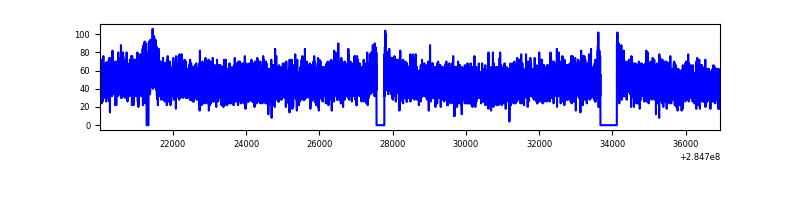 |
Top three noisy pixels from each quadrant. If the there are fewer than three noisy pixels in the level2.evt file, extra rows are filled as -1
| Pixel properties | Quadrant properties | ||||||
|---|---|---|---|---|---|---|---|
| Quadrant | DetID | PixID | Counts | Sigma | Mean | Median | Sigma |
| A | 14 | 188 | 947 | 12.11 | 232 | 217 | 60.3 |
| A | 0 | 29 | 863 | 10.72 | 232 | 217 | 60.3 |
| A | 14 | 204 | 819 | 9.99 | 232 | 217 | 60.3 |
| B | 2 | 9 | 735 | 10.98 | 227 | 216 | 47.3 |
| B | 14 | 254 | 585 | 7.81 | 227 | 216 | 47.3 |
| B | 2 | 8 | 580 | 7.7 | 227 | 216 | 47.3 |
| C | 1 | 81 | 678 | 7.79 | 228 | 212 | 59.8 |
| C | 1 | 80 | 660 | 7.49 | 228 | 212 | 59.8 |
| C | 12 | 241 | 613 | 6.71 | 228 | 212 | 59.8 |
| D | 3 | 159 | 586 | 6.38 | 218 | 198 | 60.8 |
| D | 3 | 14 | 584 | 6.35 | 218 | 198 | 60.8 |
| D | 1 | 31 | 557 | 5.9 | 218 | 198 | 60.8 |
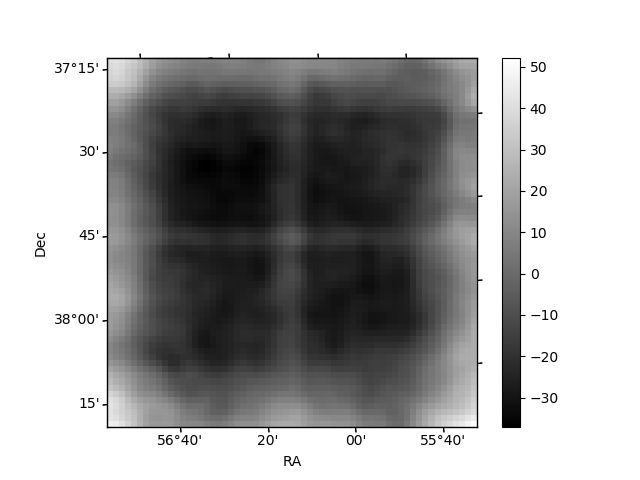
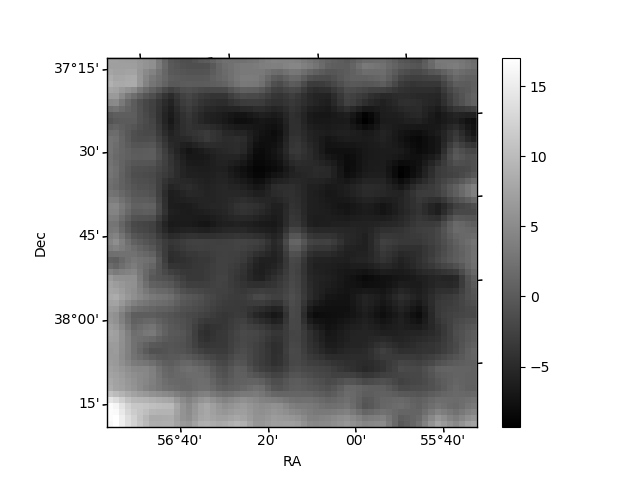
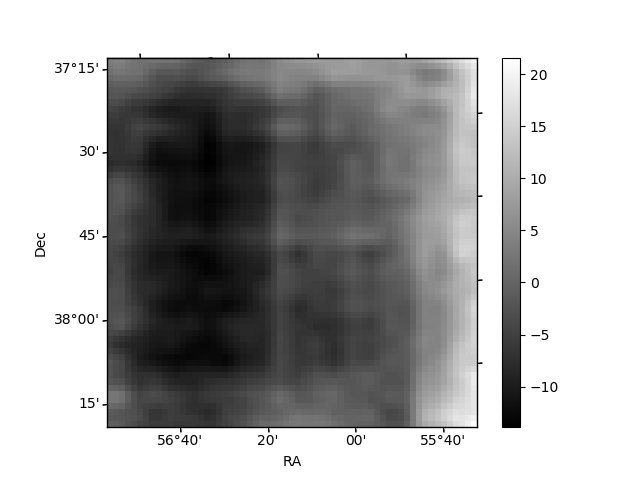
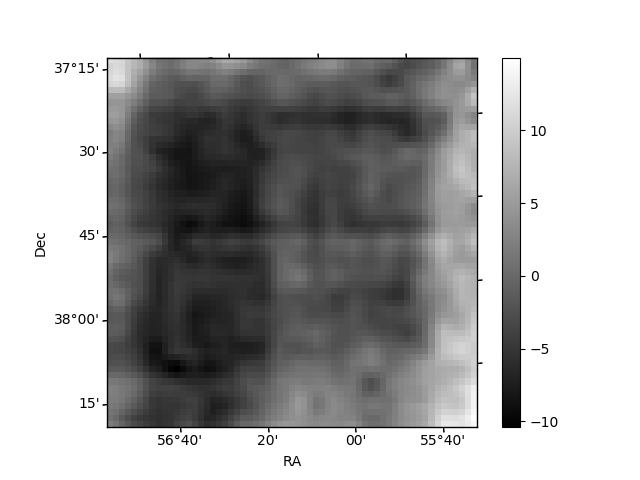
Histogram calculated using DETX and DETY for each event in the final _common_clean file
| Quadrant A | 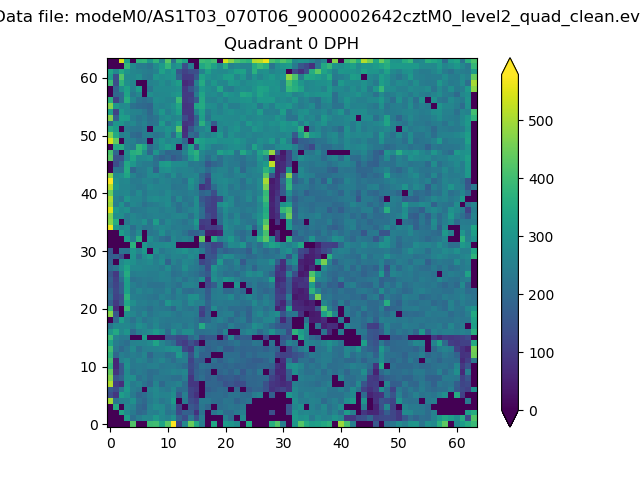 |
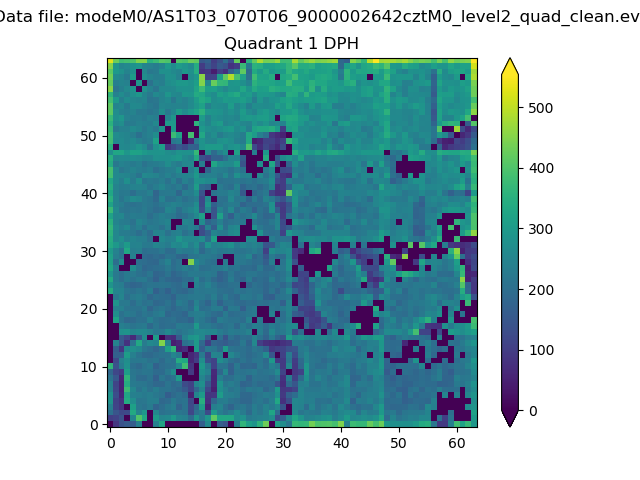 |
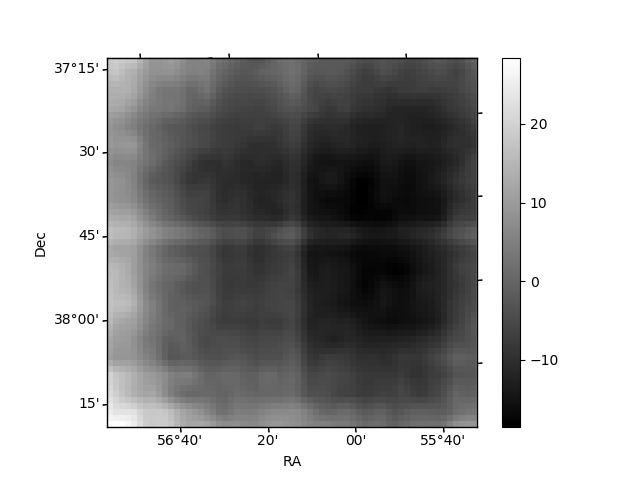
Quadrant B |
|---|---|---|---|
| Quadrant D | 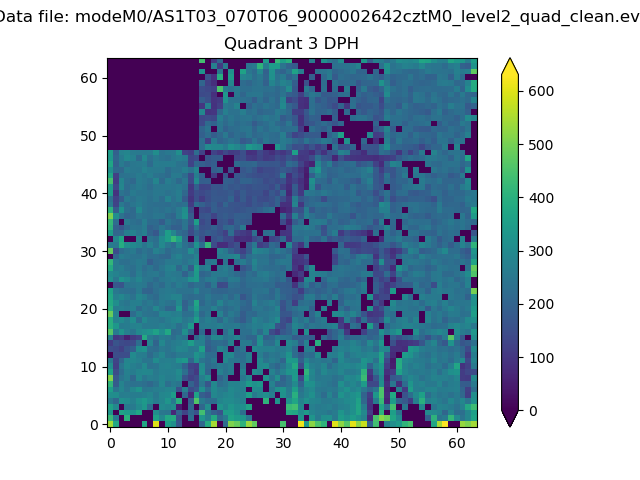 |
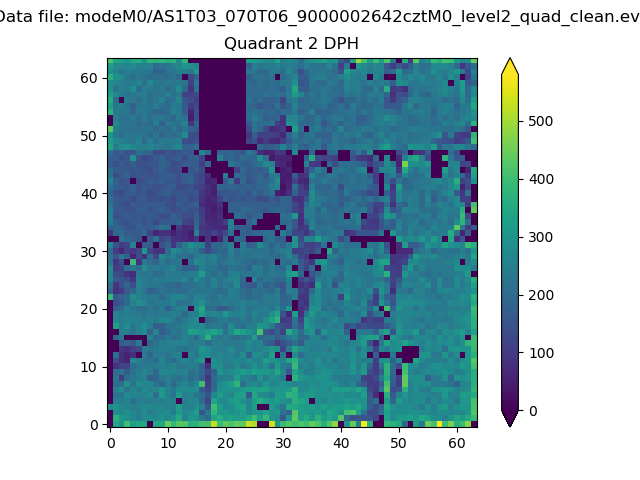 |
Quadrant C |
| Plot type | Count rate plots | Images |
|---|---|---|
| Comparison with Poisson distribution Blue bars denote a histogram of data divided into 1 sec bins. Red curve is a Poisson curve with rate = median count rate of data. |
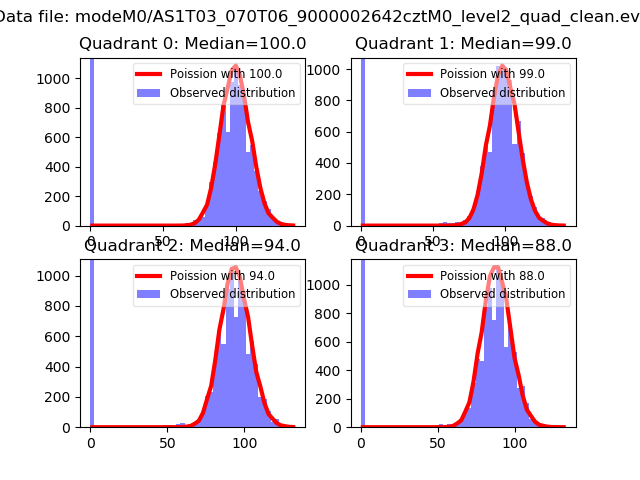 |
 |
| Quadrant-wise count rates Data is divided into 100 sec bins |
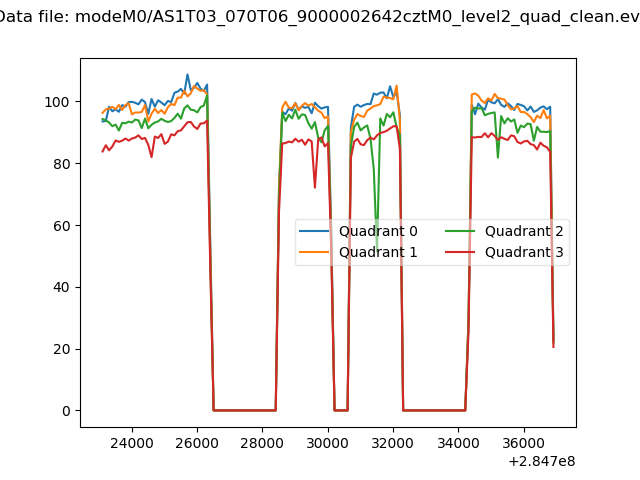 |
|
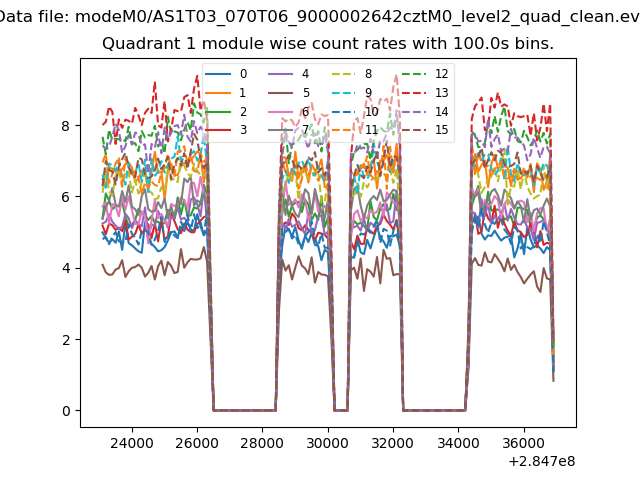
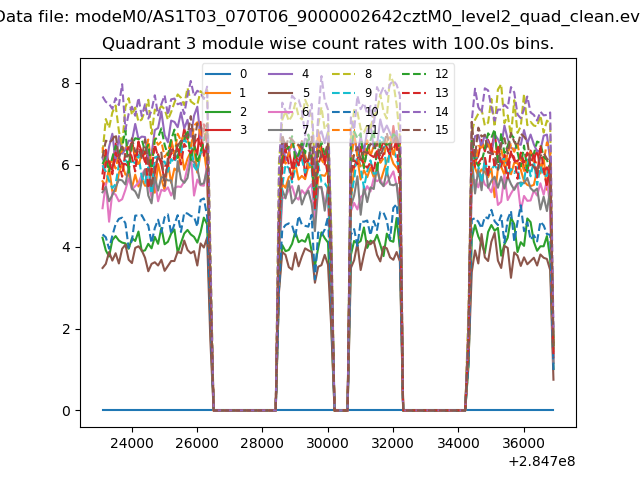
| Module-wise count rates for Quadrant A Data is divided into 100 sec bins |
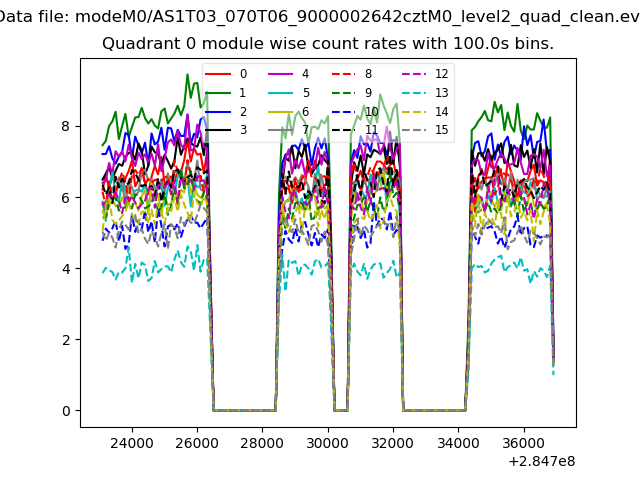 |
 |
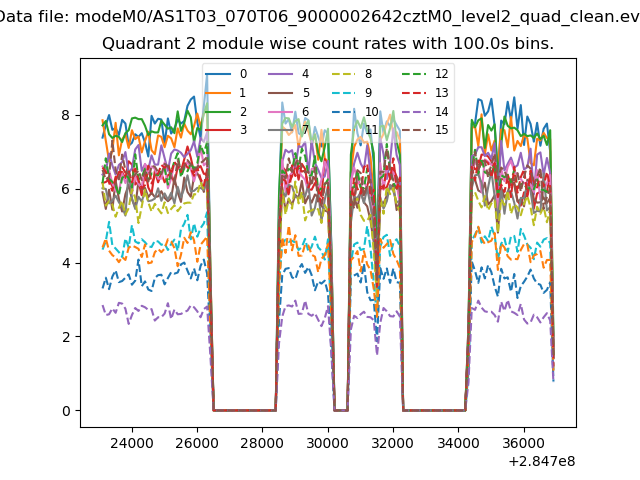
| Module-wise count rates for Quadrant B Data is divided into 100 sec bins |
 |
 |
| Module-wise count rates for Quadrant C Data is divided into 100 sec bins |
 |
 |
| Module-wise count rates for Quadrant D Data is divided into 100 sec bins |
 |
 |
| Parameter | Plot |
|---|---|
| CZT HV Monitor | 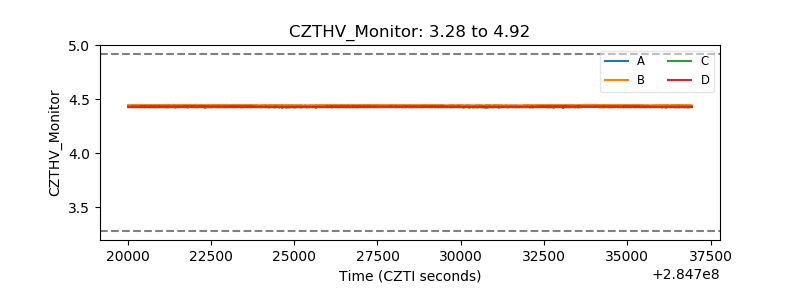 |
| D_VDD | 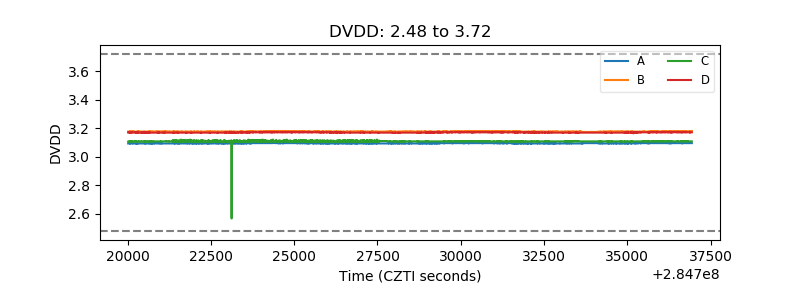 |
| Temperature 1 | 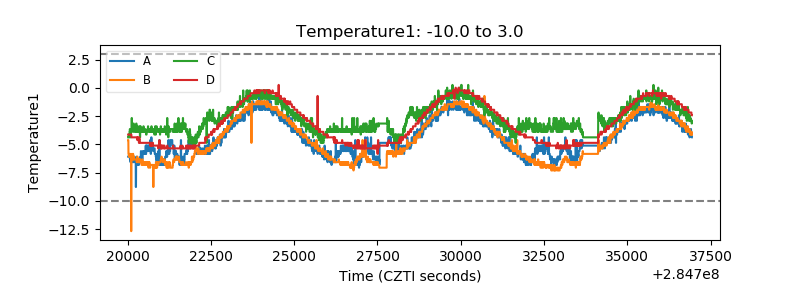 |
| Veto HV Monitor | 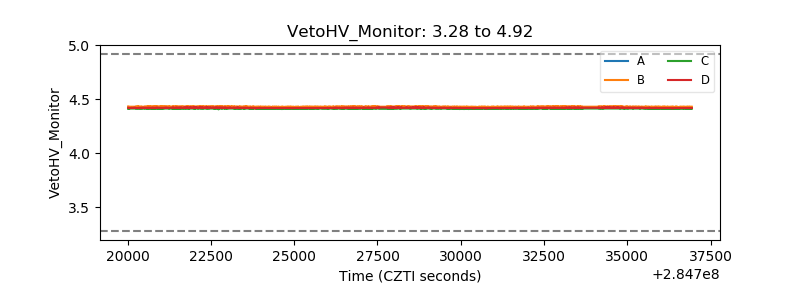 |
| Veto LLD | 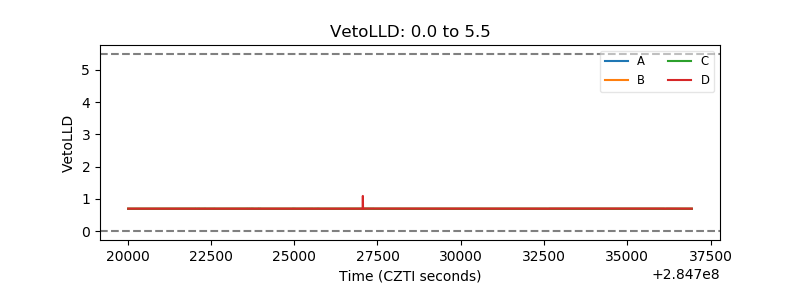 |
| Alpha Counter | 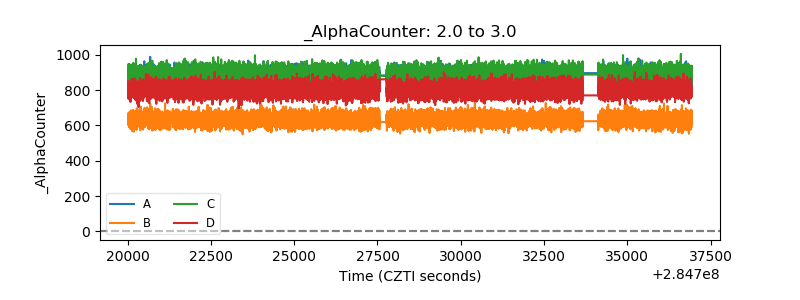 |
| _CPM_Rate | 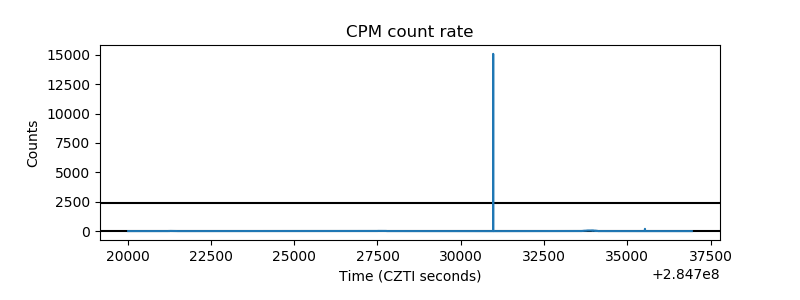 |
| CZT Counter | 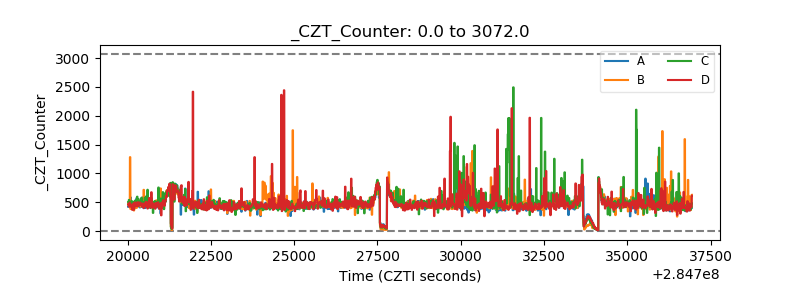 |
| +2.5 Volts monitor | 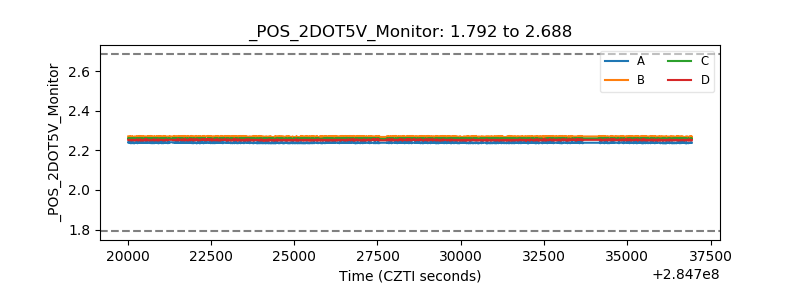 |
| +5 Volts monitor | 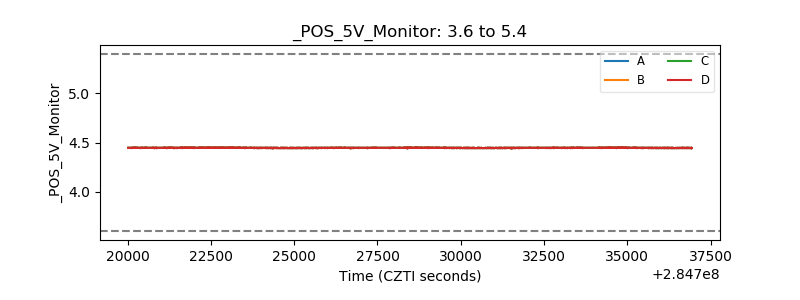 |
| _ROLL_ROT | 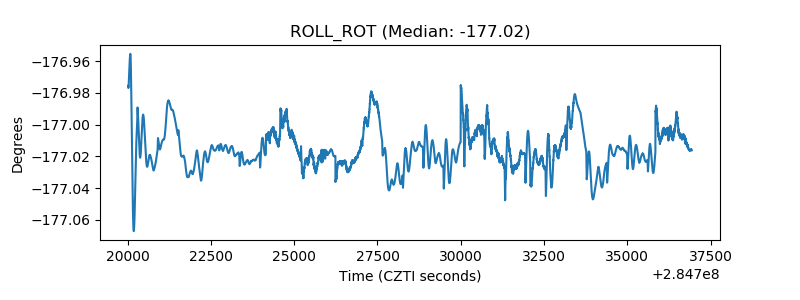 |
| _Roll_DEC | 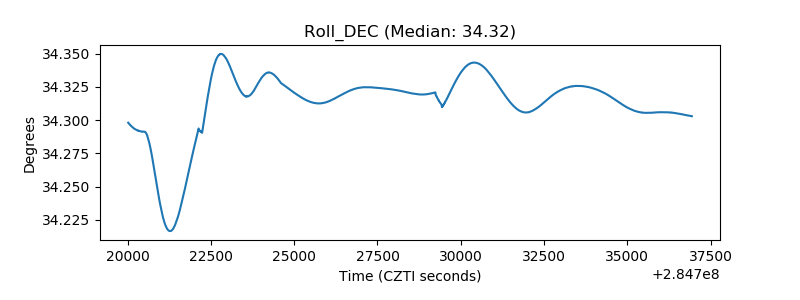 |
| _Roll_RA | 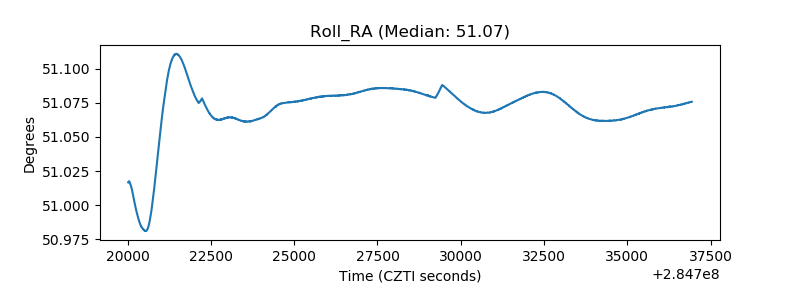 |
| Veto Counter | 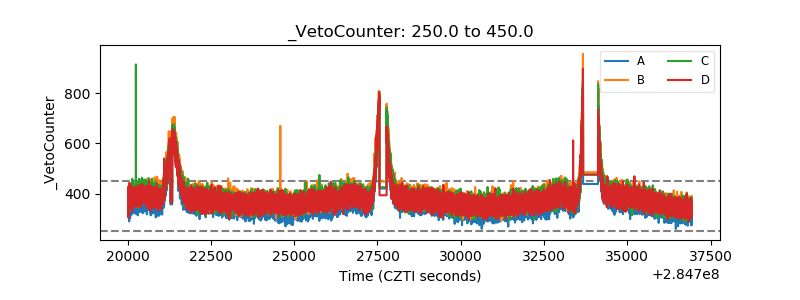 |