| Param | Original file | Final file |
|---|---|---|
| Filename | modeM0/AS1T03_070T06_9000002642_17750cztM0_level2.evt | modeM0/AS1T03_070T06_9000002642_17750cztM0_level2_quad_clean.evt |
| Size (bytes) | 206,182,080 | 23,244,480 |
| Size | 196.6 MB | 22.2 MB |
| Events in quadrant A | 1,474,433 | 122,585 |
| Events in quadrant B | 1,513,188 | 125,701 |
| Events in quadrant C | 1,546,310 | 120,513 |
| Events in quadrant D | 1,503,545 | 120,105 |
| Mode M9 | |||
|---|---|---|---|
| Quadrant | BADHDUFLAG | Total packets | Discarded packets |
| A | 0 | 1 | 0 |
| B | 0 | 1 | 0 |
| C | 0 | 1 | 0 |
| D | 0 | 1 | 0 |
| Mode SS | |||
|---|---|---|---|
| Quadrant | BADHDUFLAG | Total packets | Discarded packets |
| A | 0 | 60 | 0 |
| B | 0 | 60 | 0 |
| C | 0 | 60 | 0 |
| D | 0 | 60 | 0 |
| Mode M0 | |||
|---|---|---|---|
| Quadrant | BADHDUFLAG | Total packets | Discarded packets |
| A | 0 | 6403 | 1 |
| B | 0 | 6434 | 2 |
| C | 0 | 6455 | 1 |
| D | 0 | 6529 | 1 |
| Quadrant | Total seconds | Saturated seconds | Saturation percentage |
|---|---|---|---|
| A | 3013 | 212 | 7.036177% |
| B | 3012 | 232 | 7.702523% |
| C | 3012 | 203 | 6.739708% |
| D | 3012 | 142 | 4.714475% |
Noise dominated data is calculated using 1-second bins in cleaned event files. If a bin has >2000 counts, and if more than 50% of those come from <1% of pixels, then it is considered to be noise-dominated and hence unusable.
| Quadrant | # 1 sec bins | Bins with >0 counts | Bins with >2000 counts | High rate bins dominated by noise | Noise dominated (total time) | Noise dominated (detector-on time) | Marked lightcurve |
|---|---|---|---|---|---|---|---|
| A | 3068 | 3014 | 0 | 0 | 0.00% | 0.00% | 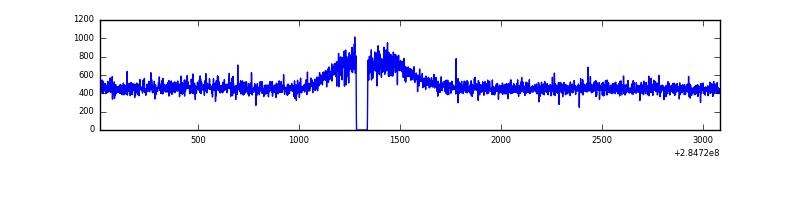 |
| B | 3067 | 3013 | 0 | 0 | 0.00% | 0.00% | 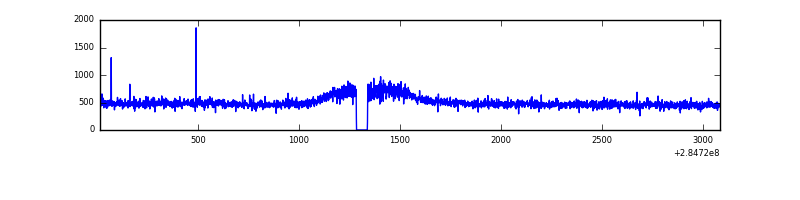 |
| C | 3067 | 3013 | 0 | 0 | 0.00% | 0.00% | 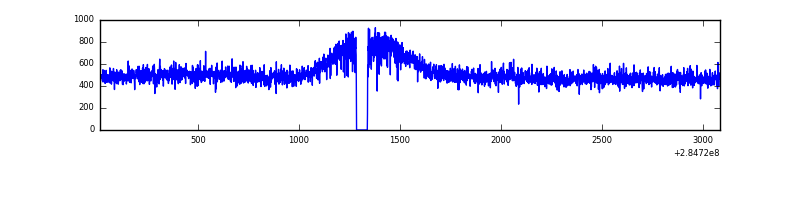 |
| D | 3067 | 3013 | 2 | 2 | 0.07% | 0.07% | 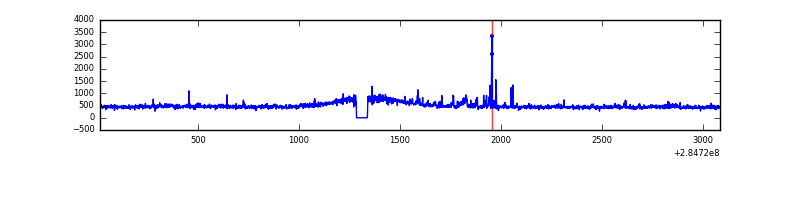 |
Top three noisy pixels from each quadrant. If the there are fewer than three noisy pixels in the level2.evt file, extra rows are filled as -1
| Pixel properties | Quadrant properties | ||||||
|---|---|---|---|---|---|---|---|
| Quadrant | DetID | PixID | Counts | Sigma | Mean | Median | Sigma |
| A | 0 | 226 | 3188 | 35.28 | 382 | 373 | 79.8 |
| A | 3 | 137 | 3181 | 35.2 | 382 | 373 | 79.8 |
| A | 12 | 194 | 2831 | 30.81 | 382 | 373 | 79.8 |
| B | 12 | 111 | 9339 | 115.2 | 386 | 373 | 77.8 |
| B | 11 | 111 | 8316 | 102.06 | 386 | 373 | 77.8 |
| B | 14 | 111 | 7021 | 85.42 | 386 | 373 | 77.8 |
| C | 14 | 238 | 55430 | 619.21 | 372 | 373 | 88.9 |
| C | 5 | 218 | 21810 | 241.1 | 372 | 373 | 88.9 |
| C | 5 | 219 | 7962 | 85.35 | 372 | 373 | 88.9 |
| D | 5 | 222 | 48560 | 521.6 | 376 | 364 | 92.4 |
| D | 7 | 238 | 22326 | 237.68 | 376 | 364 | 92.4 |
| D | 2 | 234 | 11721 | 122.91 | 376 | 364 | 92.4 |
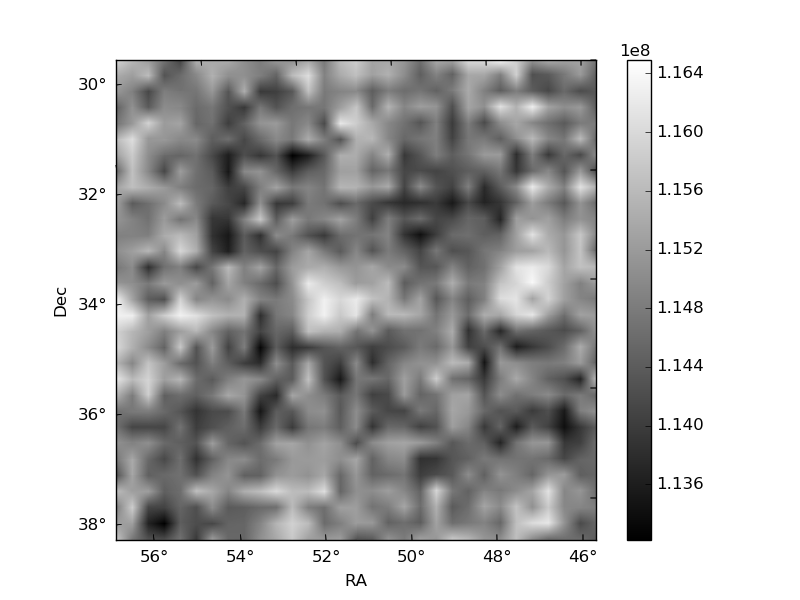
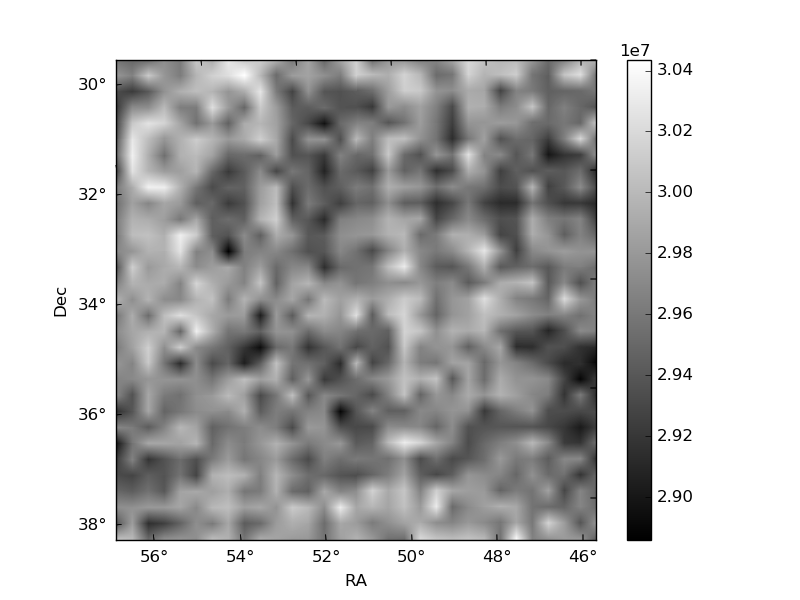
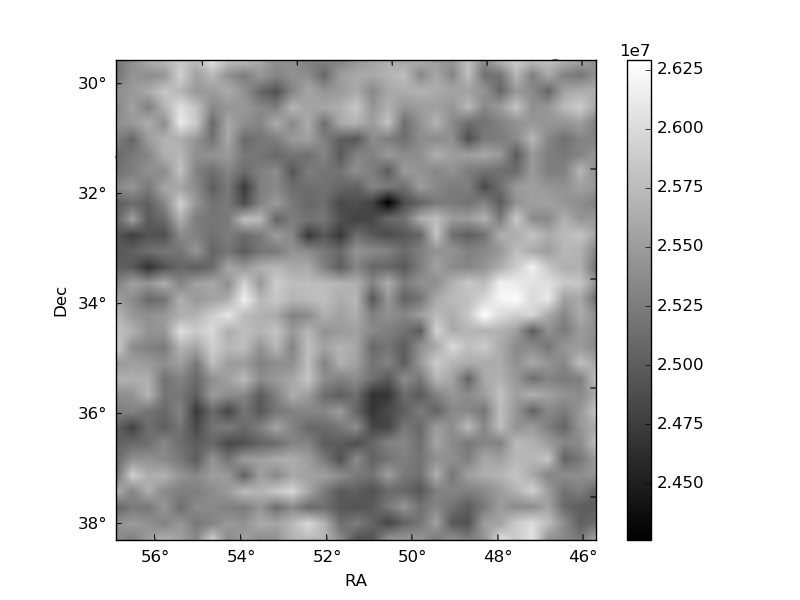
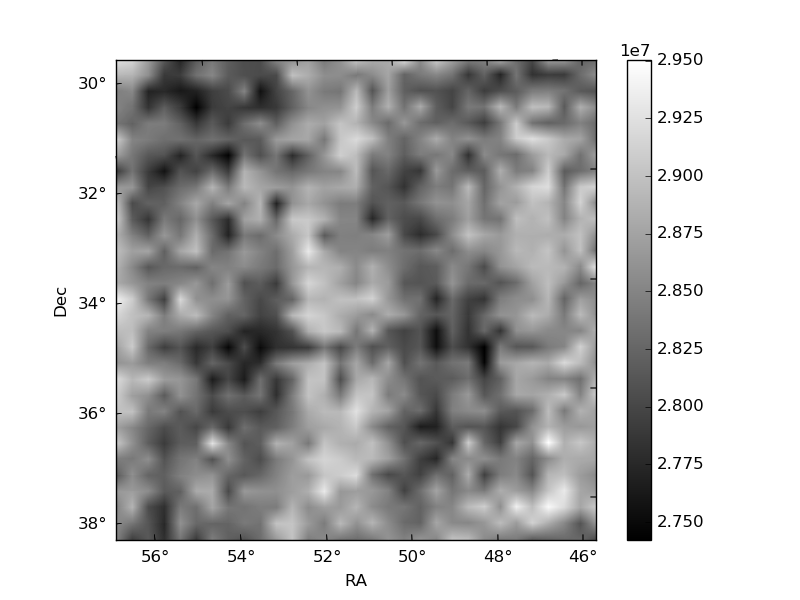
Histogram calculated using DETX and DETY for each event in the final _common_clean file
| Quadrant A | 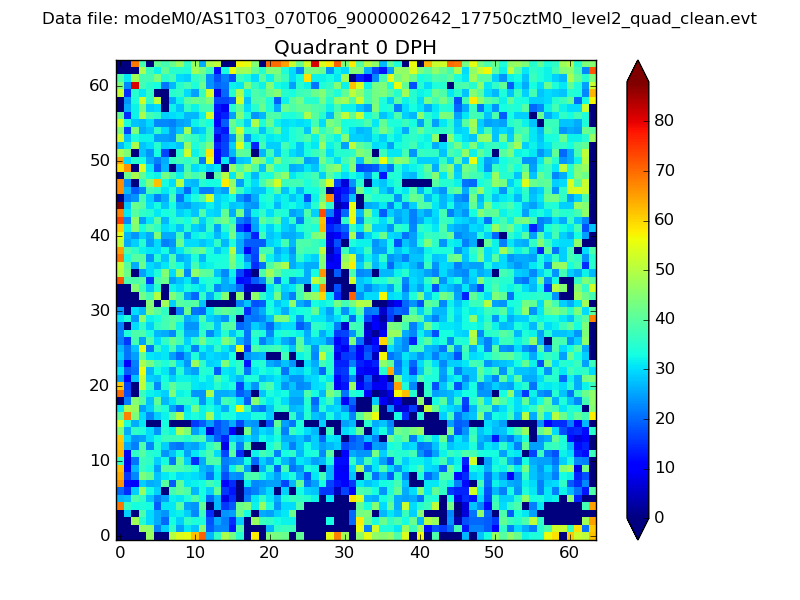 |
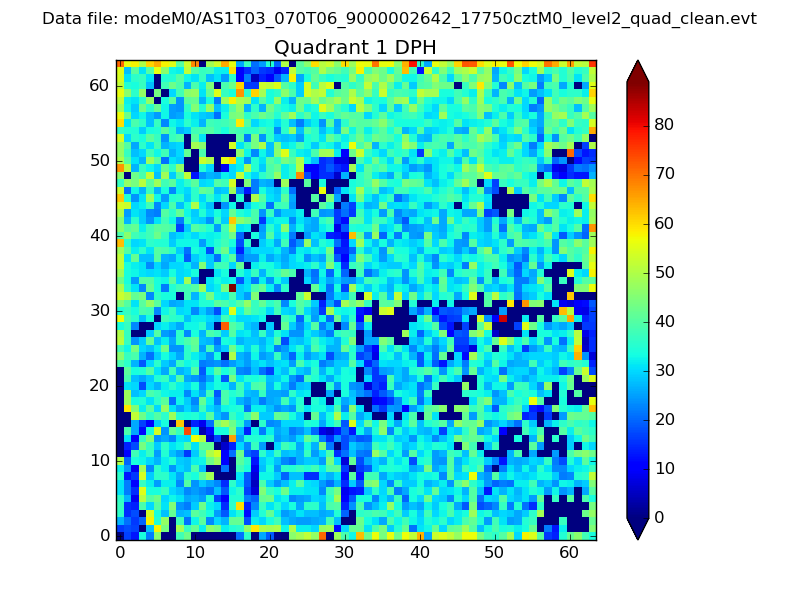 |
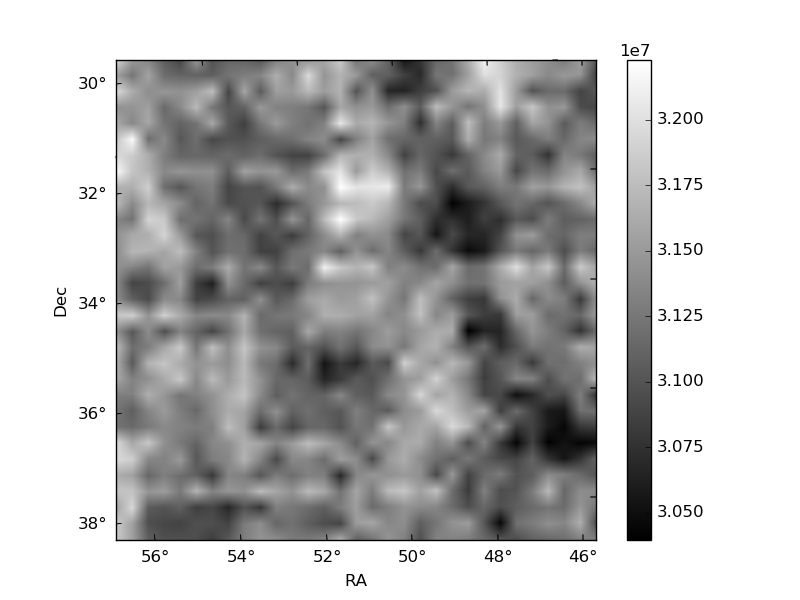
Quadrant B |
|---|---|---|---|
| Quadrant D | 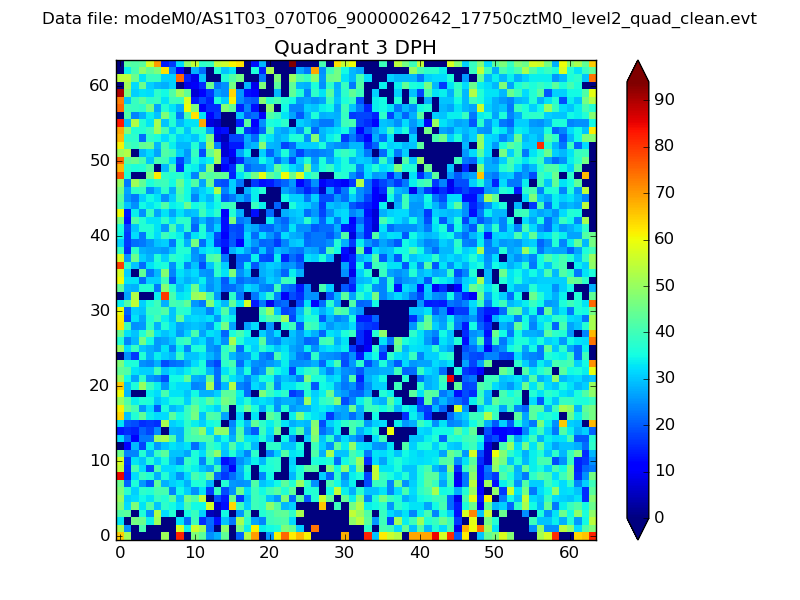 |
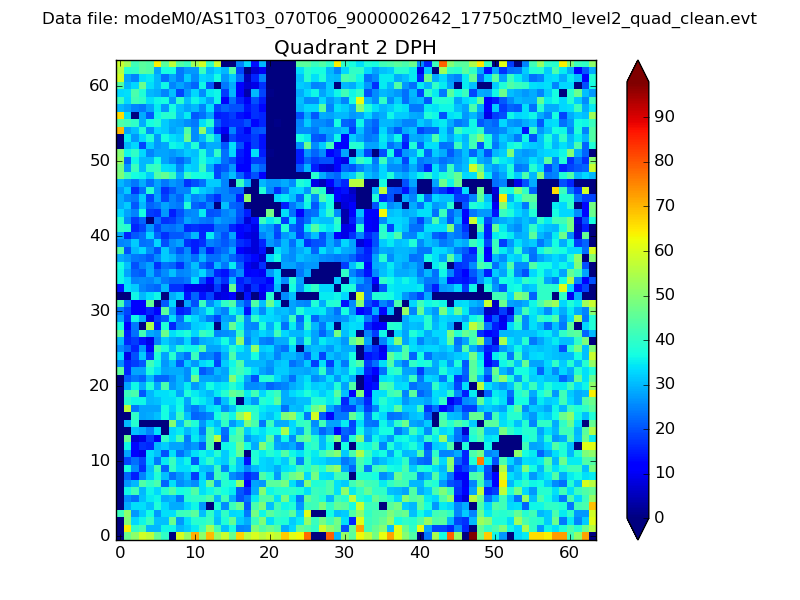 |
Quadrant C |
| Plot type | Count rate plots | Images |
|---|---|---|
| Comparison with Poisson distribution Blue bars denote a histogram of data divided into 1 sec bins. Red curve is a Poisson curve with rate = median count rate of data. |
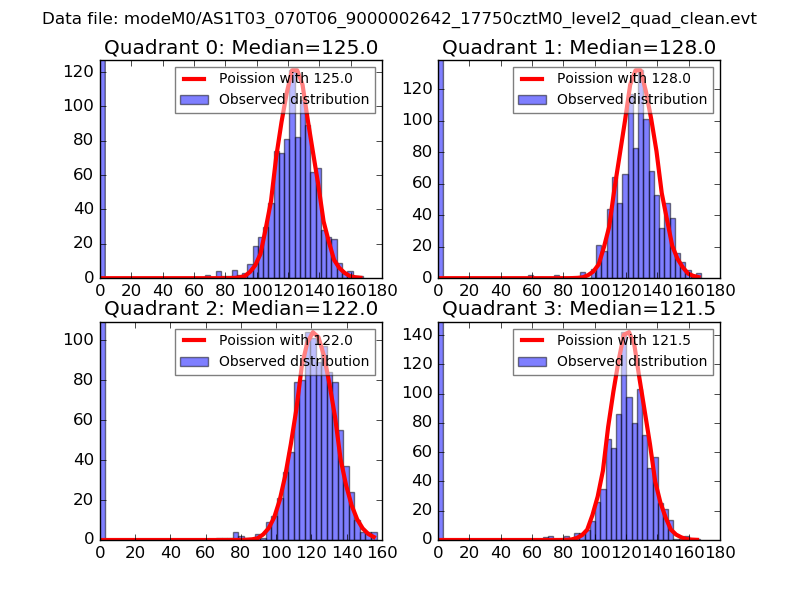 |
 |
| Quadrant-wise count rates Data is divided into 100 sec bins |
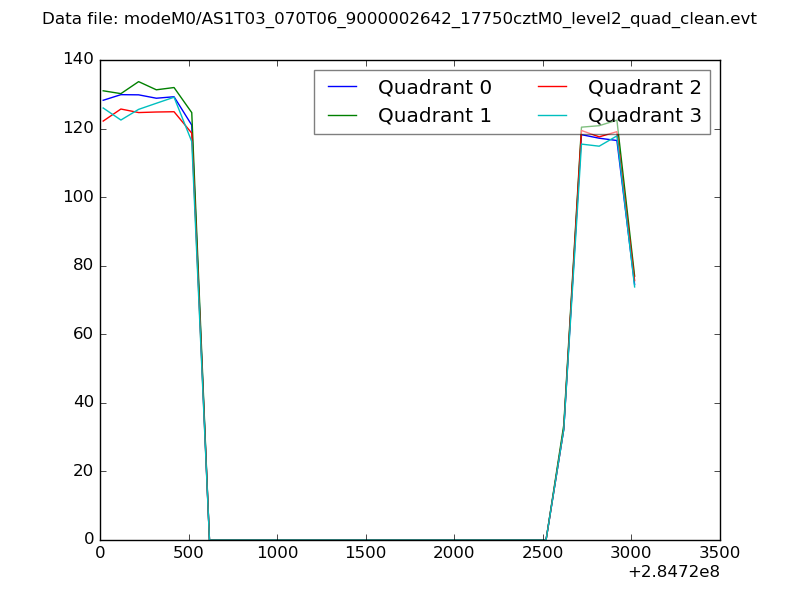 |
|
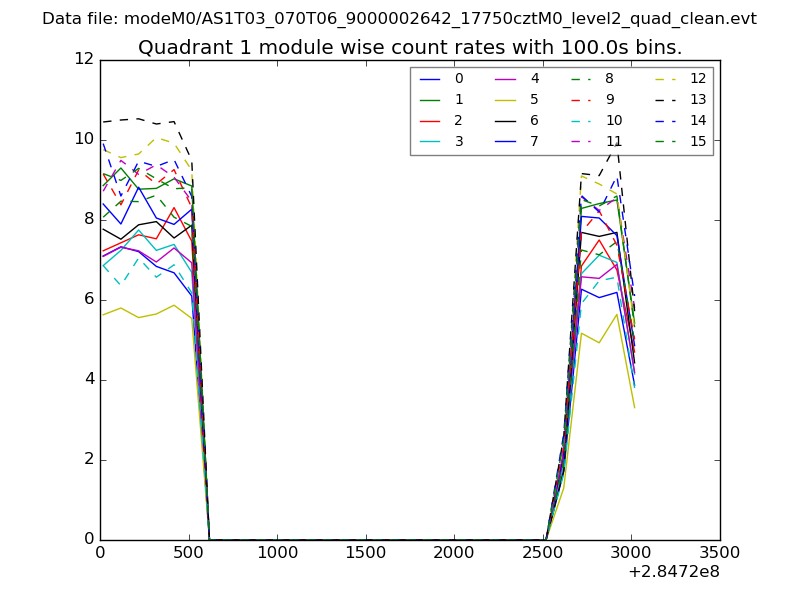
| Module-wise count rates for Quadrant A Data is divided into 100 sec bins |
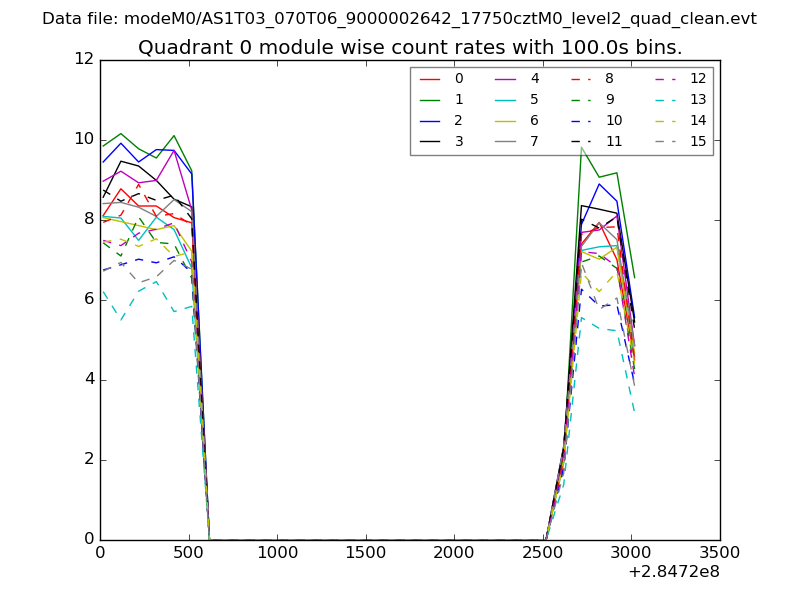 |
 |
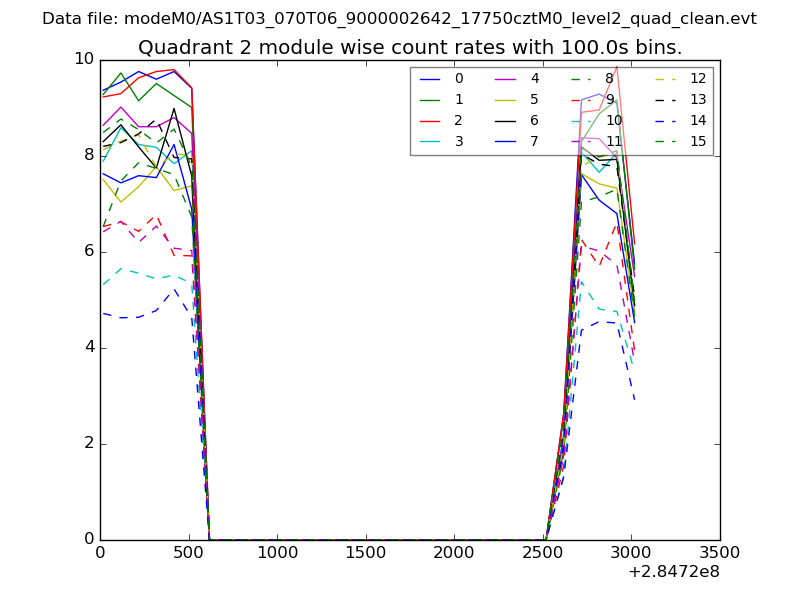
| Module-wise count rates for Quadrant B Data is divided into 100 sec bins |
 |
 |
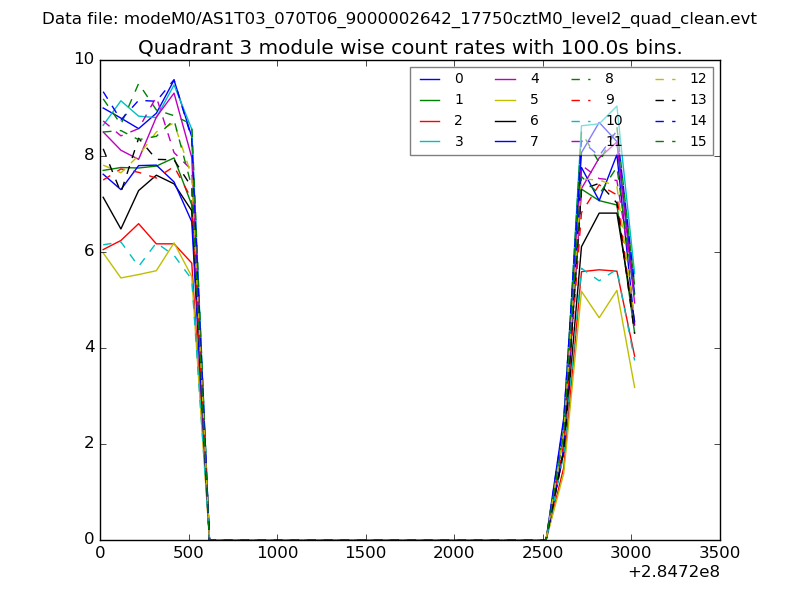
| Module-wise count rates for Quadrant C Data is divided into 100 sec bins |
 |
 |
| Module-wise count rates for Quadrant D Data is divided into 100 sec bins |
 |
 |
| Parameter | Plot |
|---|---|
| CZT HV Monitor | 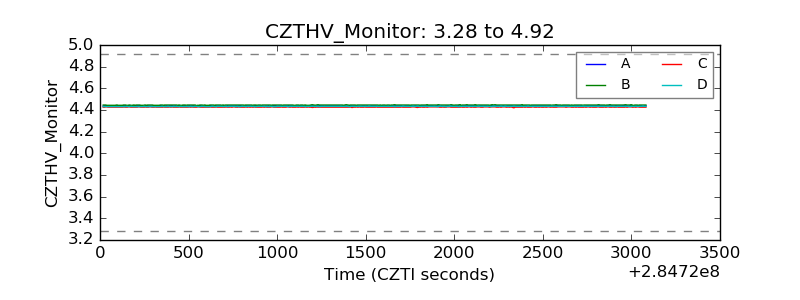 |
| D_VDD | 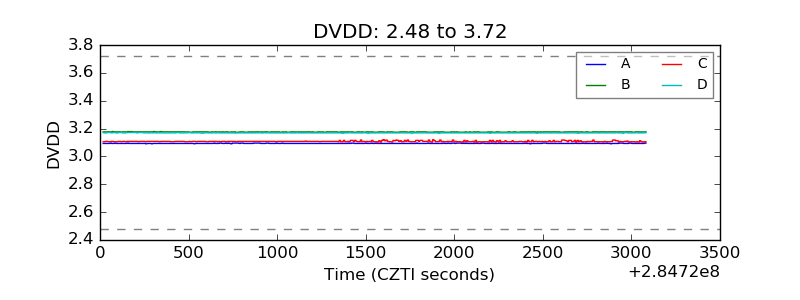 |
| Temperature 1 | 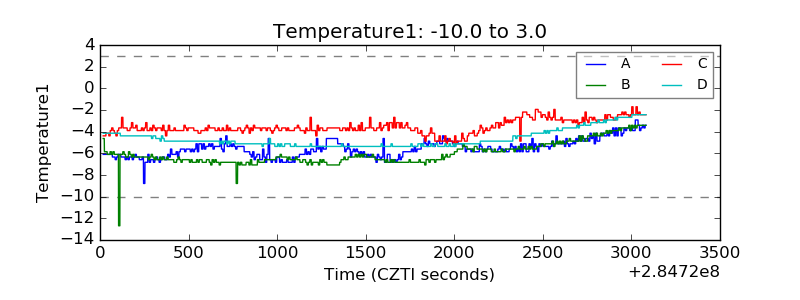 |
| Veto HV Monitor | 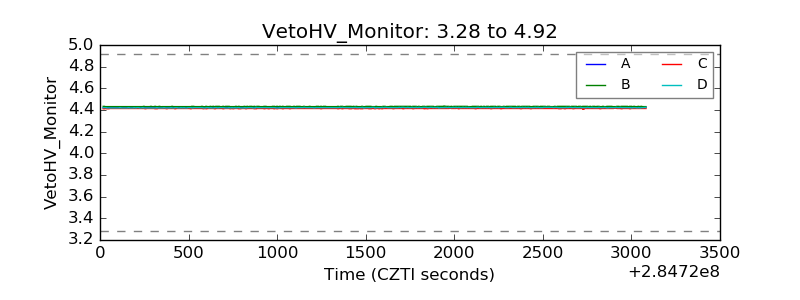 |
| Veto LLD | 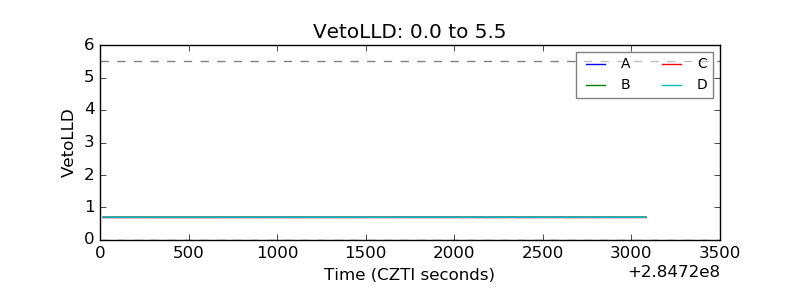 |
| Alpha Counter | 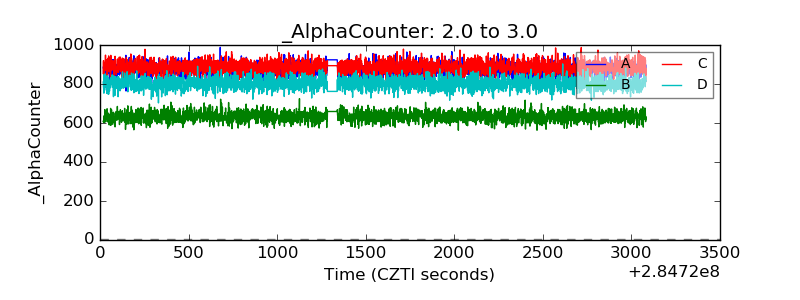 |
| _CPM_Rate | 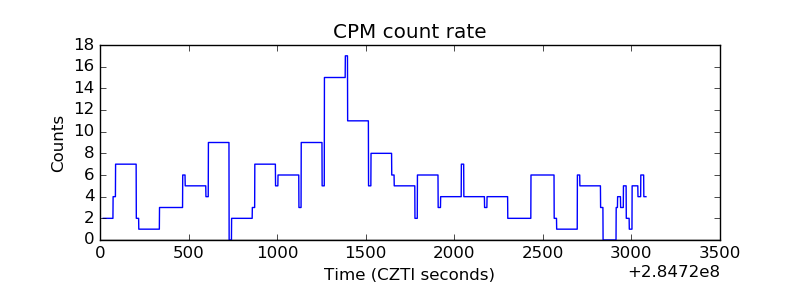 |
| CZT Counter | 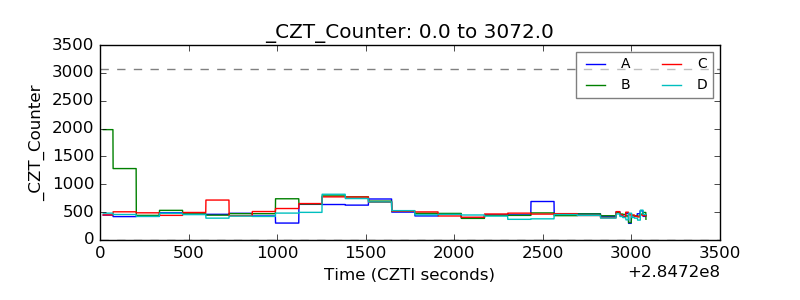 |
| +2.5 Volts monitor |  |
| +5 Volts monitor |  |
| _ROLL_ROT | 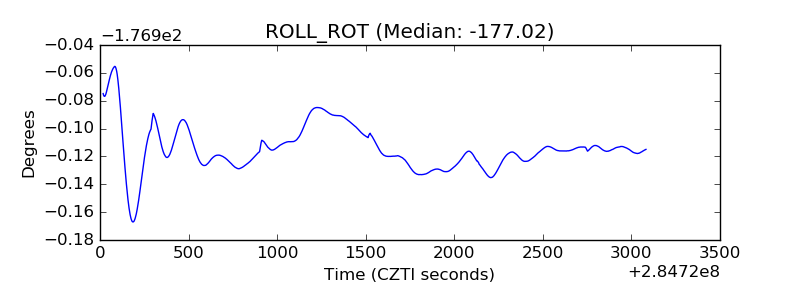 |
| _Roll_DEC | 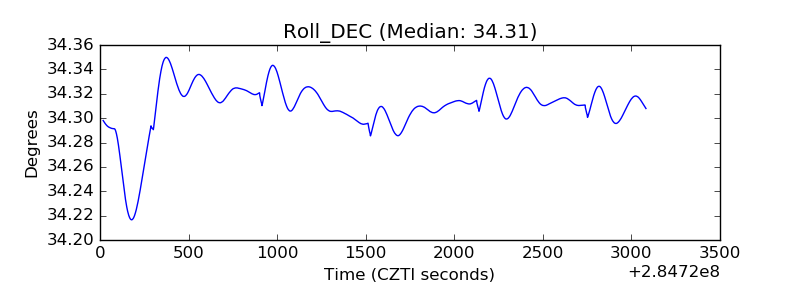 |
| _Roll_RA | 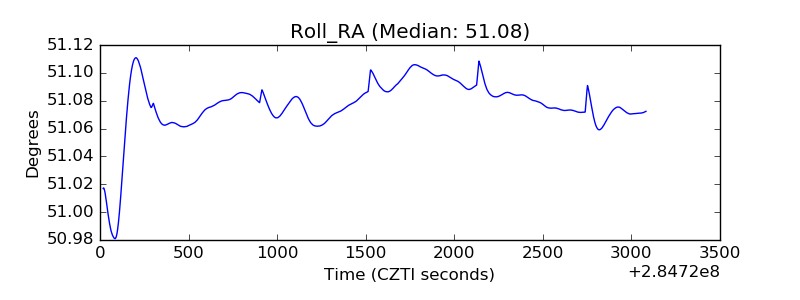 |
| Veto Counter | 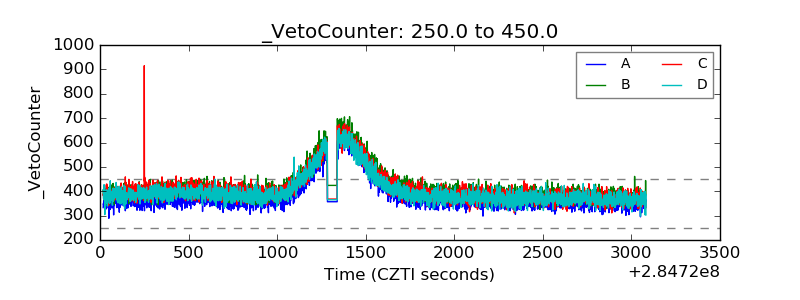 |