| Param | Original file | Final file |
|---|---|---|
| Filename | modeM0/AS1T03_070T06_9000002642_17751cztM0_level2.evt | modeM0/AS1T03_070T06_9000002642_17751cztM0_level2_quad_clean.evt |
| Size (bytes) | 569,508,480 | 93,012,480 |
| Size | 543.1 MB | 88.7 MB |
| Events in quadrant A | 4,015,676 | 564,351 |
| Events in quadrant B | 4,264,541 | 565,210 |
| Events in quadrant C | 4,198,546 | 546,458 |
| Events in quadrant D | 4,187,416 | 546,408 |
| Mode M9 | |||
|---|---|---|---|
| Quadrant | BADHDUFLAG | Total packets | Discarded packets |
| A | 0 | 3 | 0 |
| B | 0 | 3 | 0 |
| C | 0 | 3 | 0 |
| D | 0 | 3 | 0 |
| Mode SS | |||
|---|---|---|---|
| Quadrant | BADHDUFLAG | Total packets | Discarded packets |
| A | 0 | 174 | 0 |
| B | 0 | 174 | 0 |
| C | 0 | 174 | 0 |
| D | 0 | 174 | 0 |
| Mode M0 | |||
|---|---|---|---|
| Quadrant | BADHDUFLAG | Total packets | Discarded packets |
| A | 0 | 17793 | 2 |
| B | 0 | 18281 | 2 |
| C | 0 | 17946 | 2 |
| D | 0 | 18398 | 2 |
| Quadrant | Total seconds | Saturated seconds | Saturation percentage |
|---|---|---|---|
| A | 8559 | 371 | 4.334619% |
| B | 8560 | 411 | 4.801402% |
| C | 8560 | 370 | 4.322430% |
| D | 8560 | 292 | 3.411215% |
Noise dominated data is calculated using 1-second bins in cleaned event files. If a bin has >2000 counts, and if more than 50% of those come from <1% of pixels, then it is considered to be noise-dominated and hence unusable.
| Quadrant | # 1 sec bins | Bins with >0 counts | Bins with >2000 counts | High rate bins dominated by noise | Noise dominated (total time) | Noise dominated (detector-on time) | Marked lightcurve |
|---|---|---|---|---|---|---|---|
| A | 8829 | 8560 | 0 | 0 | 0.00% | 0.00% | 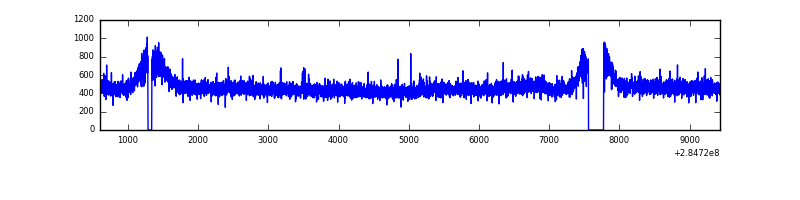 |
| B | 8830 | 8562 | 5 | 5 | 0.06% | 0.06% | 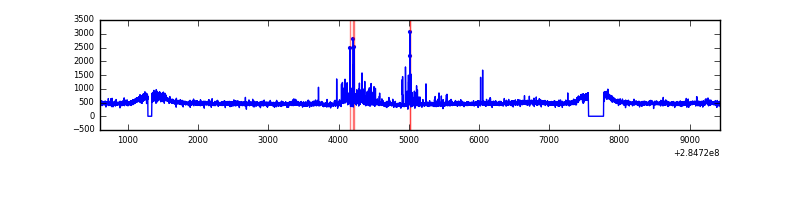 |
| C | 8830 | 8562 | 0 | 0 | 0.00% | 0.00% | 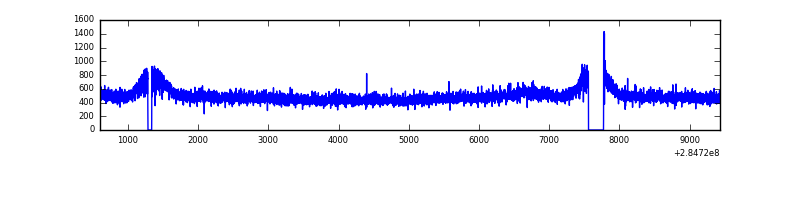 |
| D | 8830 | 8562 | 18 | 18 | 0.20% | 0.21% | 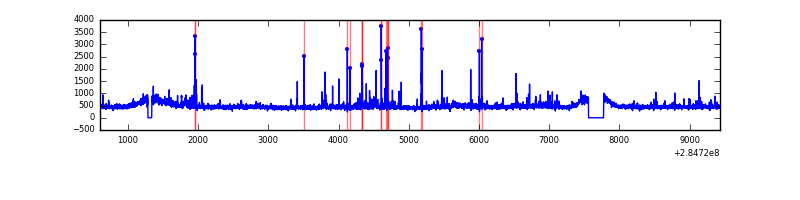 |
Top three noisy pixels from each quadrant. If the there are fewer than three noisy pixels in the level2.evt file, extra rows are filled as -1
| Pixel properties | Quadrant properties | ||||||
|---|---|---|---|---|---|---|---|
| Quadrant | DetID | PixID | Counts | Sigma | Mean | Median | Sigma |
| A | 15 | 174 | 17279 | 76.33 | 1039 | 1011 | 213.1 |
| A | 0 | 226 | 9048 | 37.71 | 1039 | 1011 | 213.1 |
| A | 3 | 137 | 8150 | 33.5 | 1039 | 1011 | 213.1 |
| B | 7 | 220 | 104849 | 518.06 | 1037 | 1005 | 200.4 |
| B | 0 | 219 | 36172 | 175.44 | 1037 | 1005 | 200.4 |
| B | 10 | 245 | 31271 | 150.99 | 1037 | 1005 | 200.4 |
| C | 14 | 238 | 152217 | 643.08 | 1000 | 1004 | 235.1 |
| C | 5 | 218 | 73505 | 308.33 | 1000 | 1004 | 235.1 |
| C | 3 | 233 | 29347 | 120.54 | 1000 | 1004 | 235.1 |
| D | 2 | 165 | 92792 | 379.5 | 1015 | 986 | 241.9 |
| D | 5 | 222 | 85640 | 349.94 | 1015 | 986 | 241.9 |
| D | 10 | 70 | 40736 | 164.32 | 1015 | 986 | 241.9 |
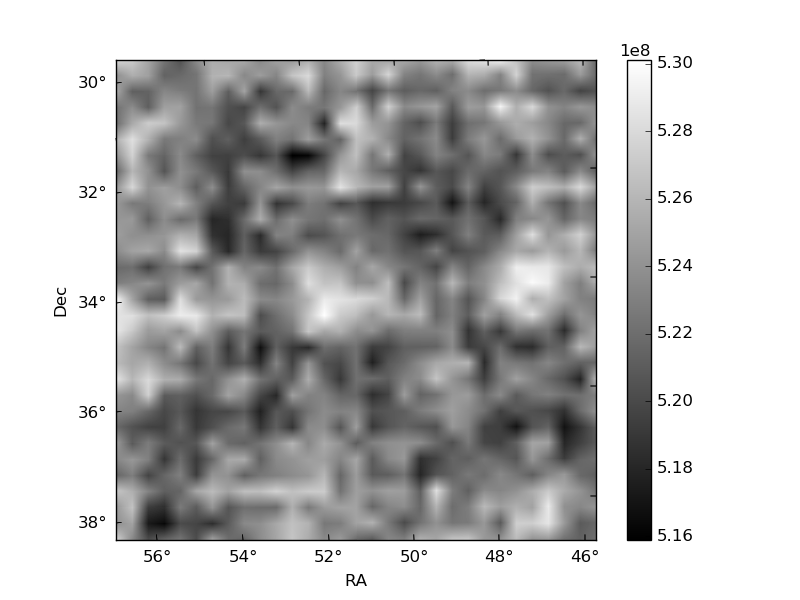
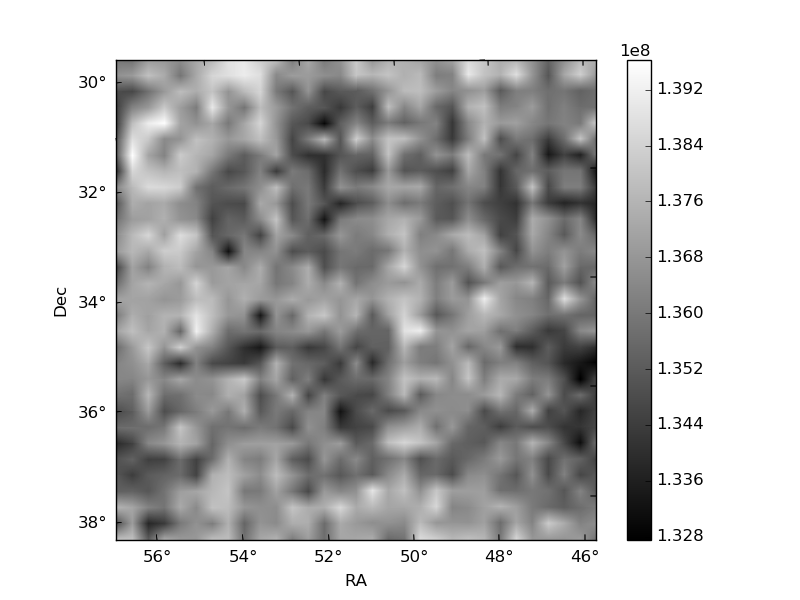
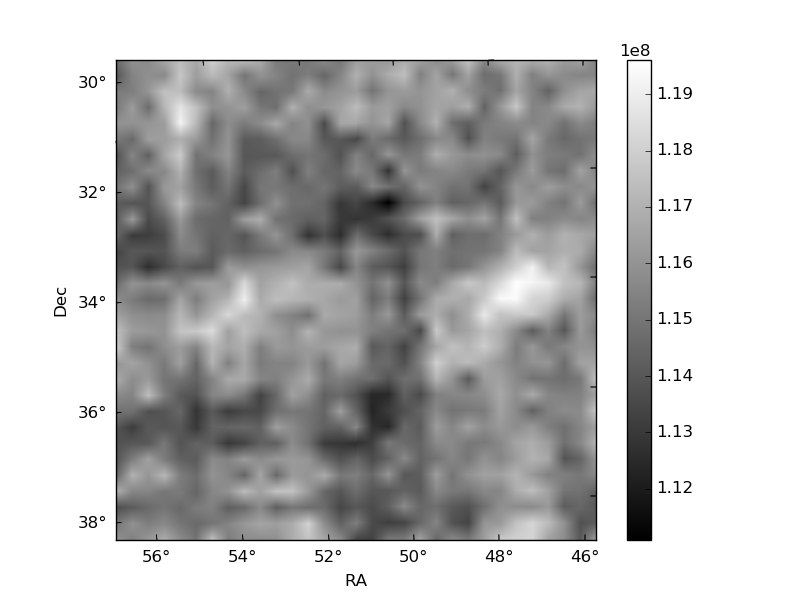
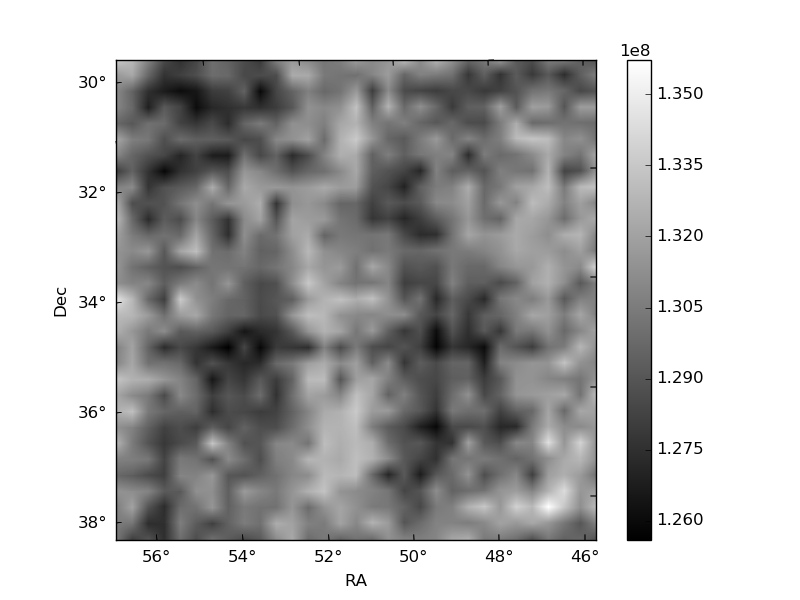
Histogram calculated using DETX and DETY for each event in the final _common_clean file
| Quadrant A | 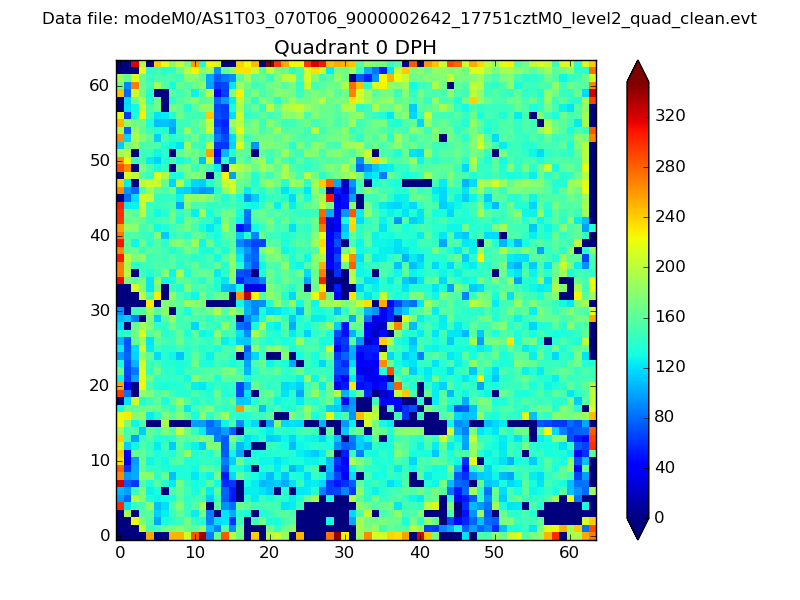 |
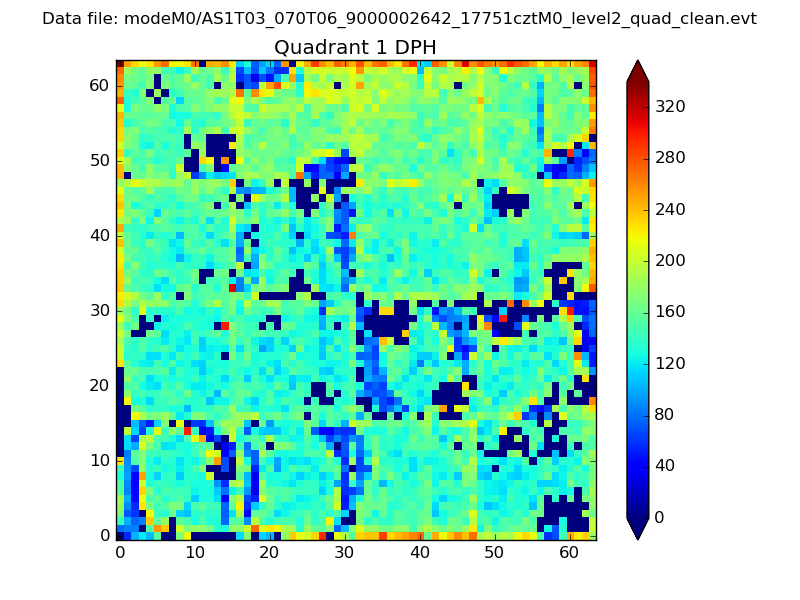 |
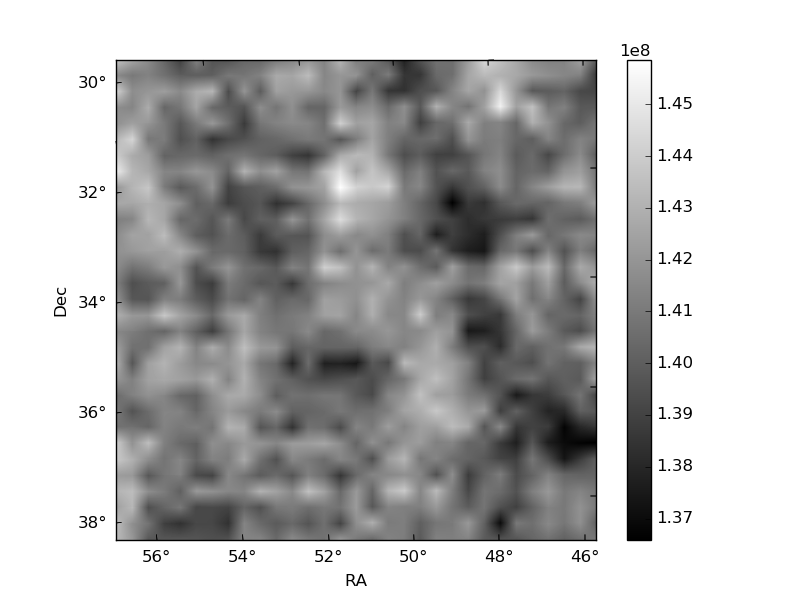
Quadrant B |
|---|---|---|---|
| Quadrant D | 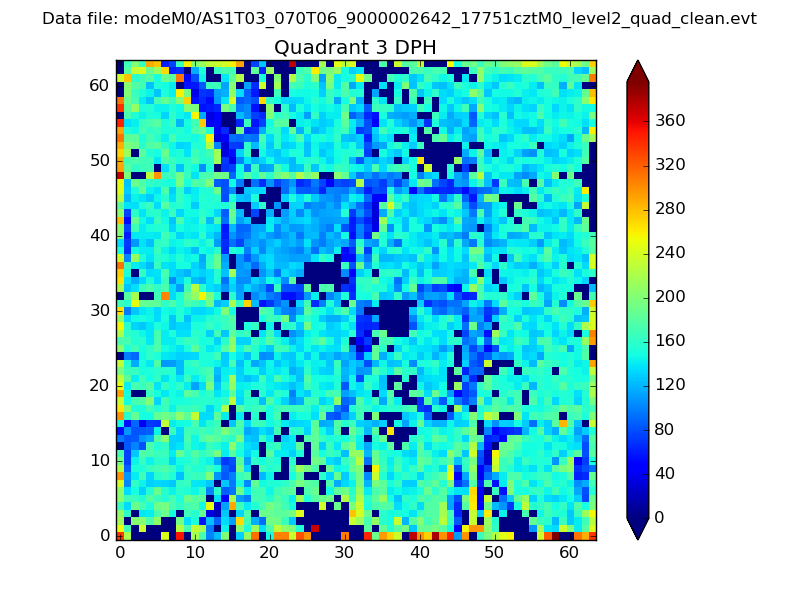 |
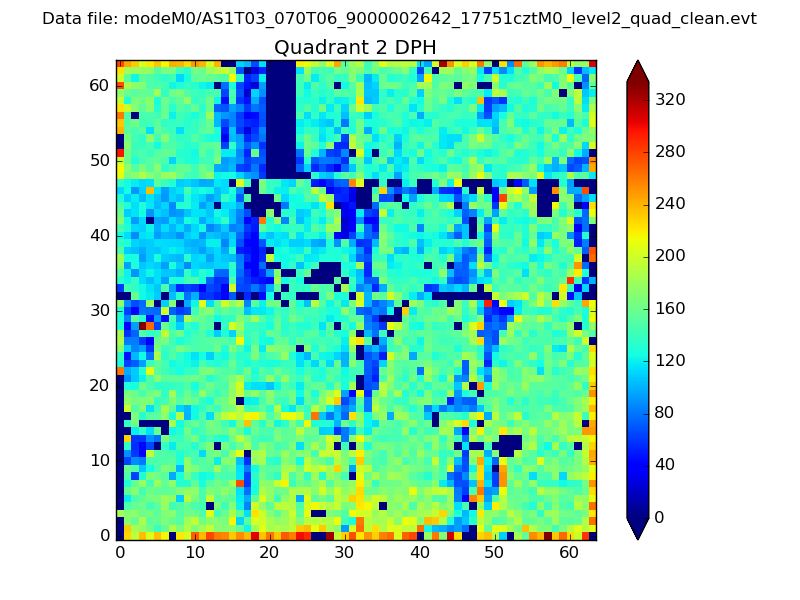 |
Quadrant C |
| Plot type | Count rate plots | Images |
|---|---|---|
| Comparison with Poisson distribution Blue bars denote a histogram of data divided into 1 sec bins. Red curve is a Poisson curve with rate = median count rate of data. |
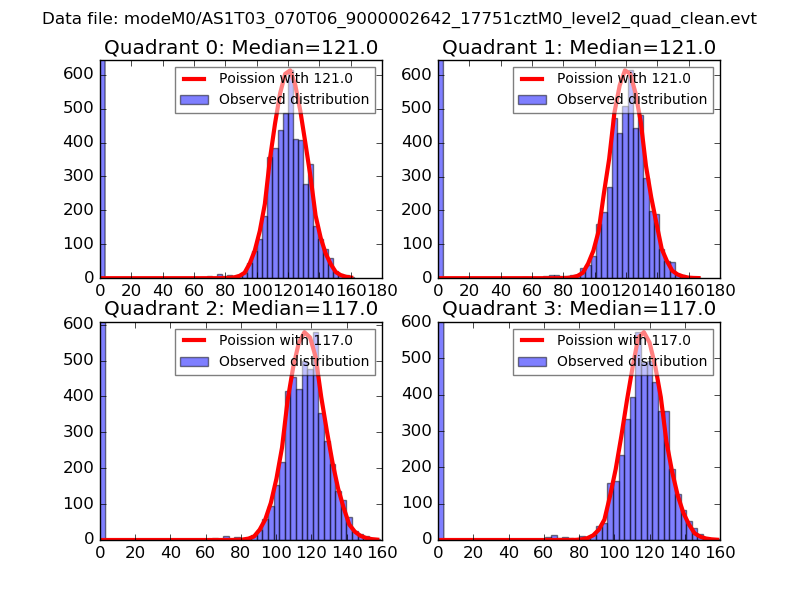 |
 |
| Quadrant-wise count rates Data is divided into 100 sec bins |
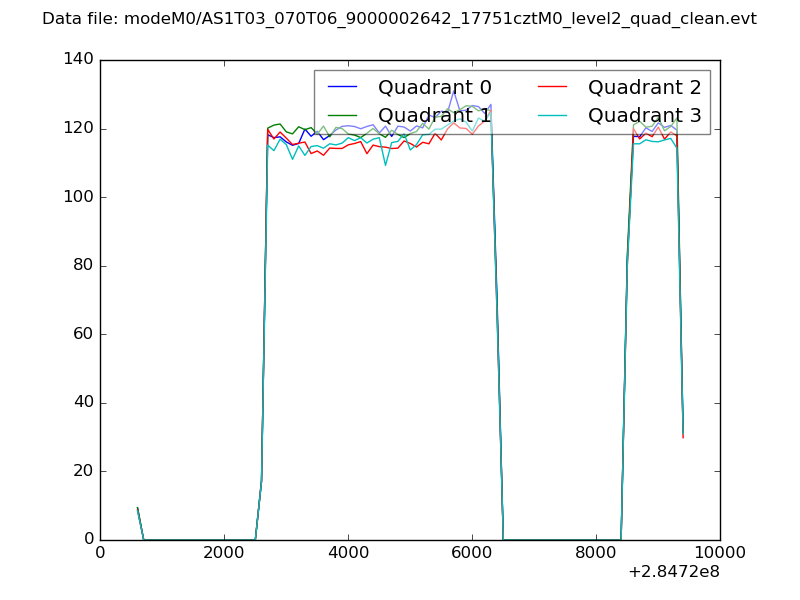 |
|
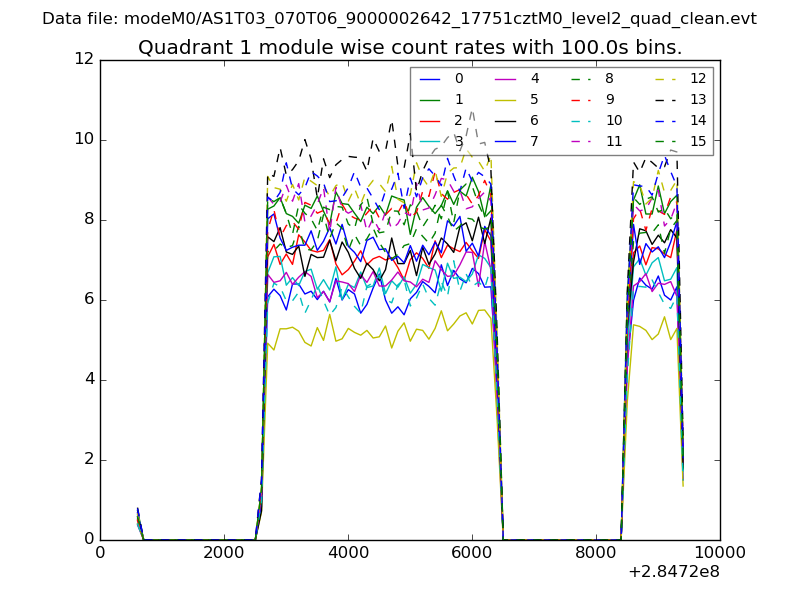
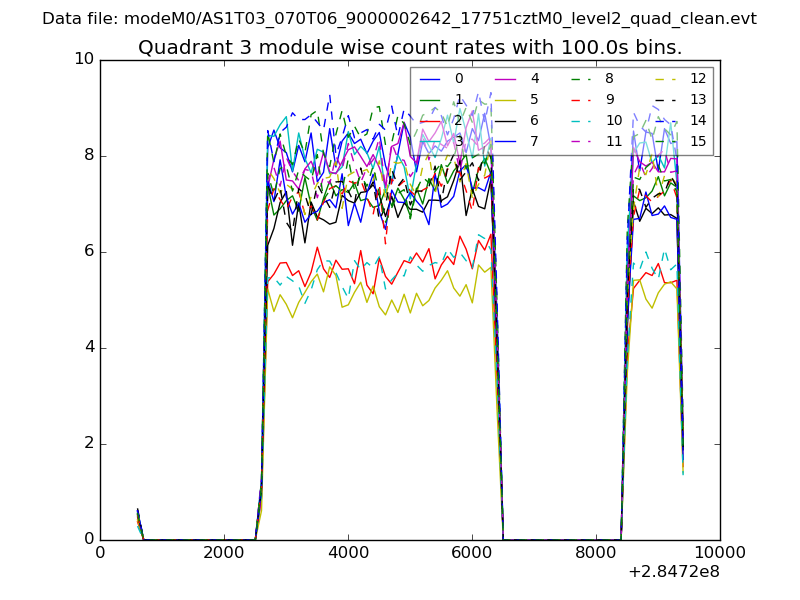
| Module-wise count rates for Quadrant A Data is divided into 100 sec bins |
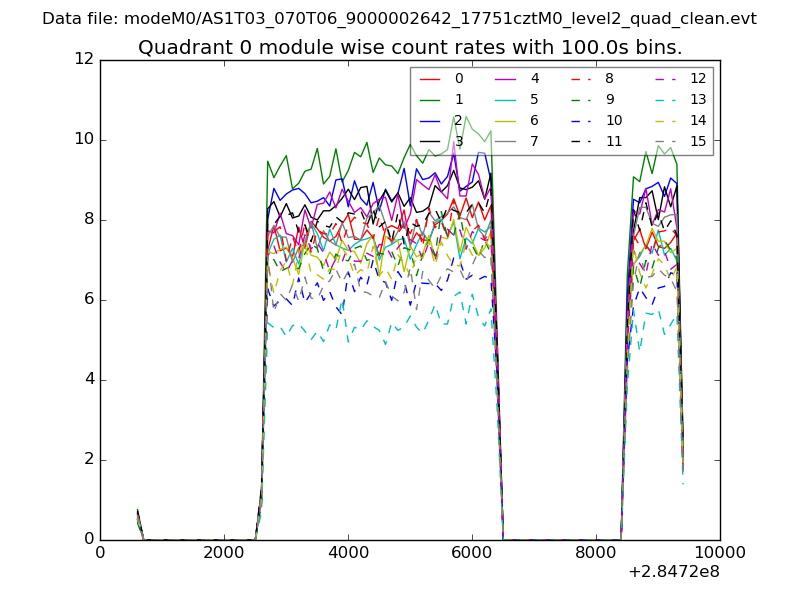 |
 |
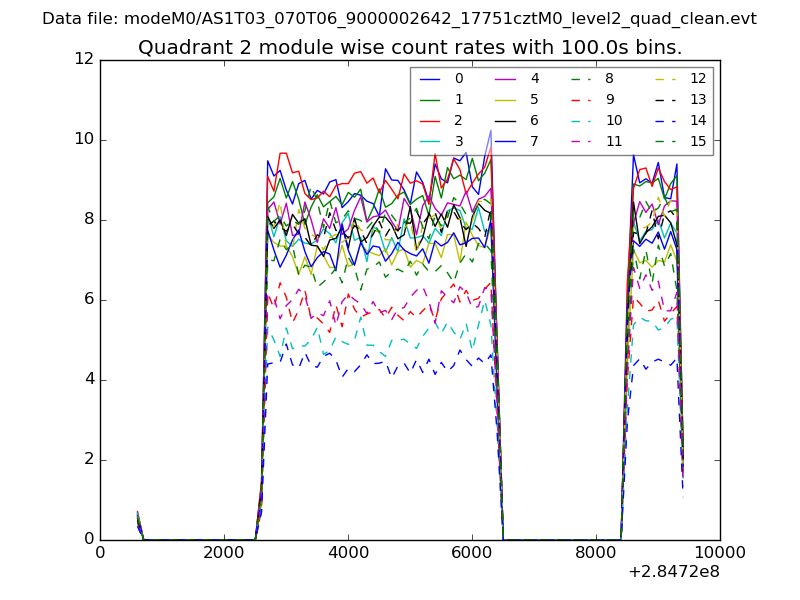
| Module-wise count rates for Quadrant B Data is divided into 100 sec bins |
 |
 |
| Module-wise count rates for Quadrant C Data is divided into 100 sec bins |
 |
 |
| Module-wise count rates for Quadrant D Data is divided into 100 sec bins |
 |
 |
| Parameter | Plot |
|---|---|
| CZT HV Monitor | 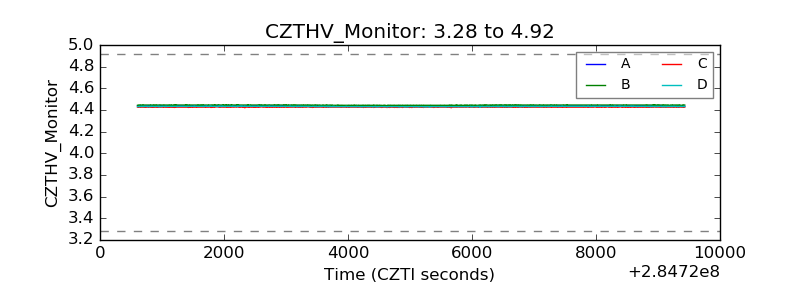 |
| D_VDD | 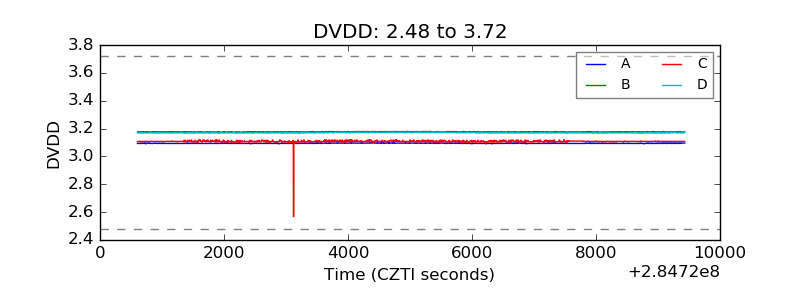 |
| Temperature 1 | 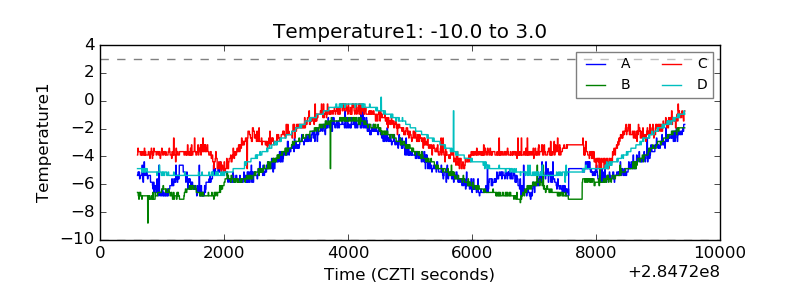 |
| Veto HV Monitor | 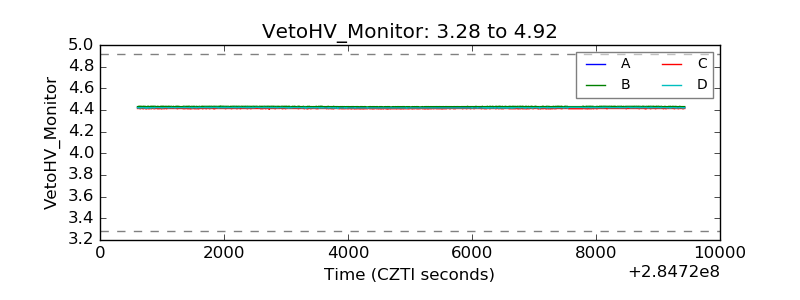 |
| Veto LLD | 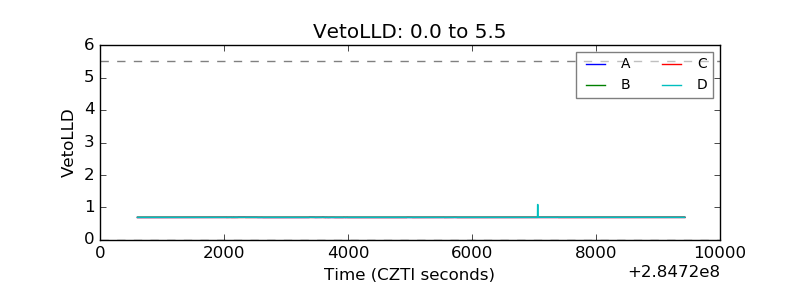 |
| Alpha Counter | 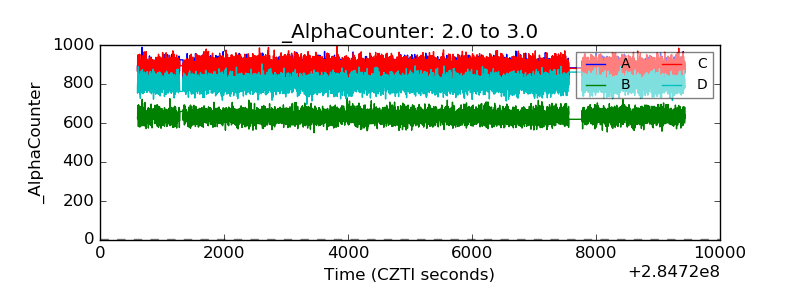 |
| _CPM_Rate | 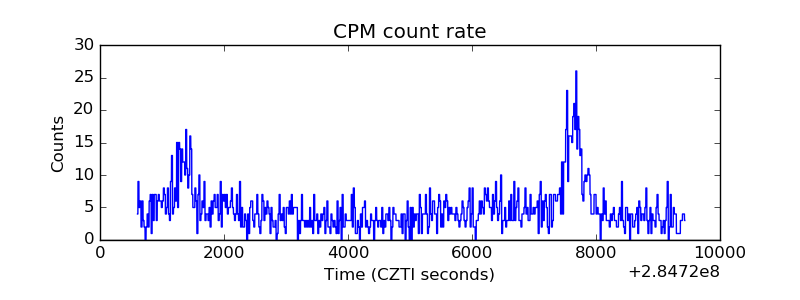 |
| CZT Counter | 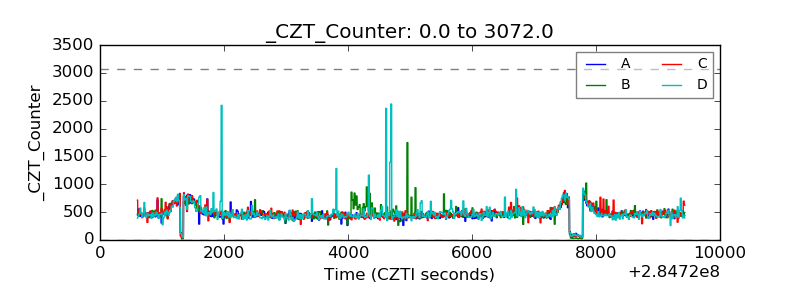 |
| +2.5 Volts monitor |  |
| +5 Volts monitor |  |
| _ROLL_ROT | 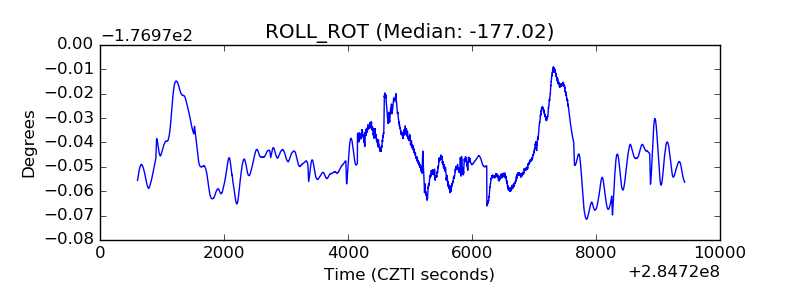 |
| _Roll_DEC | 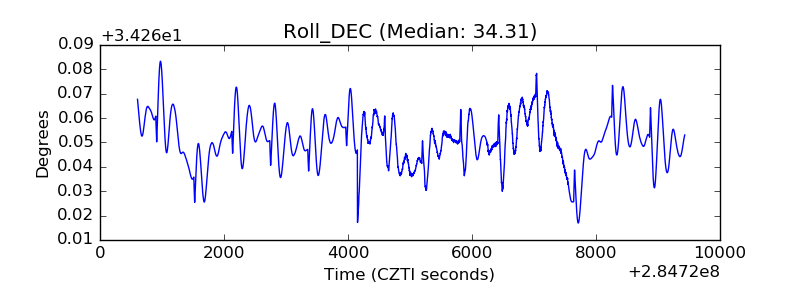 |
| _Roll_RA | 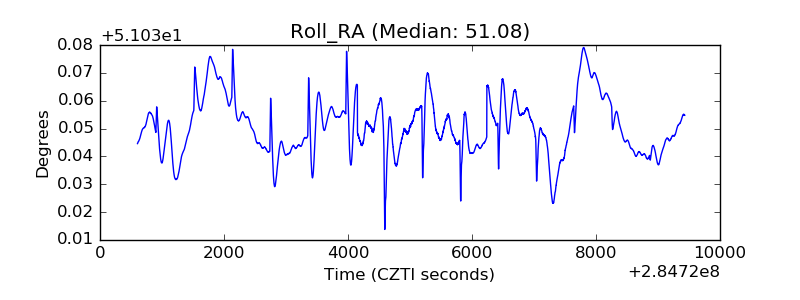 |
| Veto Counter | 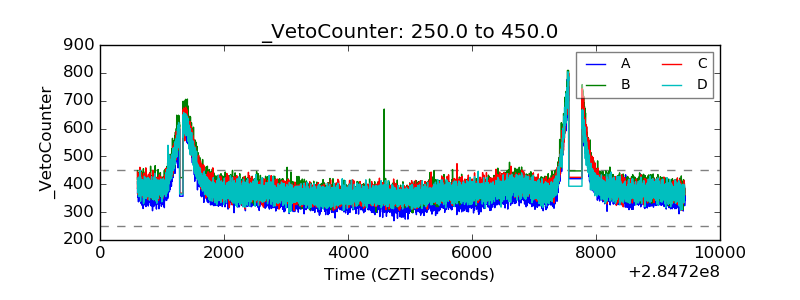 |