| Param | Original file | Final file |
|---|---|---|
| Filename | modeM0/AS1T03_070T06_9000002642_17754cztM0_level2.evt | modeM0/AS1T03_070T06_9000002642_17754cztM0_level2_quad_clean.evt |
| Size (bytes) | 538,407,360 | 114,370,560 |
| Size | 513.5 MB | 109.1 MB |
| Events in quadrant A | 3,548,484 | 743,973 |
| Events in quadrant B | 3,948,473 | 745,389 |
| Events in quadrant C | 4,359,184 | 710,462 |
| Events in quadrant D | 3,917,621 | 719,226 |
| Mode M9 | |||
|---|---|---|---|
| Quadrant | BADHDUFLAG | Total packets | Discarded packets |
| A | 0 | 5 | 0 |
| B | 0 | 5 | 0 |
| C | 0 | 5 | 0 |
| D | 0 | 5 | 0 |
| Mode SS | |||
|---|---|---|---|
| Quadrant | BADHDUFLAG | Total packets | Discarded packets |
| A | 0 | 158 | 0 |
| B | 0 | 158 | 0 |
| C | 0 | 158 | 0 |
| D | 0 | 158 | 0 |
| Mode M0 | |||
|---|---|---|---|
| Quadrant | BADHDUFLAG | Total packets | Discarded packets |
| A | 0 | 15983 | 1 |
| B | 0 | 16857 | 1 |
| C | 0 | 18024 | 1 |
| D | 0 | 17042 | 1 |
| Quadrant | Total seconds | Saturated seconds | Saturation percentage |
|---|---|---|---|
| A | 7837 | 91 | 1.161159% |
| B | 7838 | 136 | 1.735137% |
| C | 7838 | 265 | 3.380965% |
| D | 7838 | 113 | 1.441694% |
Noise dominated data is calculated using 1-second bins in cleaned event files. If a bin has >2000 counts, and if more than 50% of those come from <1% of pixels, then it is considered to be noise-dominated and hence unusable.
| Quadrant | # 1 sec bins | Bins with >0 counts | Bins with >2000 counts | High rate bins dominated by noise | Noise dominated (total time) | Noise dominated (detector-on time) | Marked lightcurve |
|---|---|---|---|---|---|---|---|
| A | 8287 | 7837 | 0 | 0 | 0.00% | 0.00% | 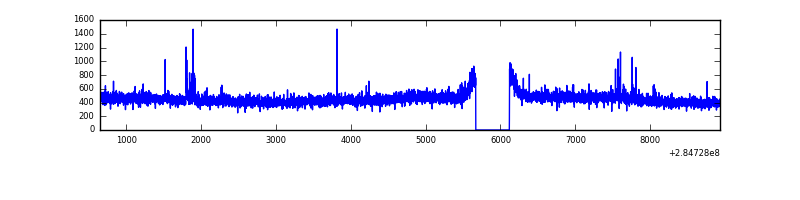 |
| B | 8288 | 7839 | 23 | 23 | 0.28% | 0.29% | 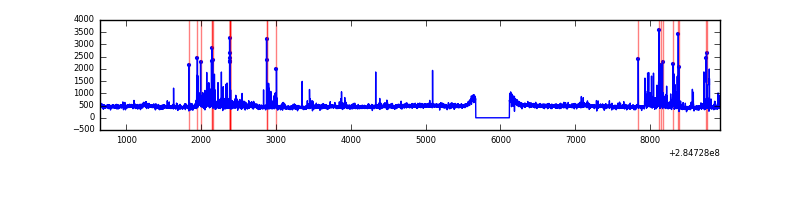 |
| C | 8288 | 7839 | 103 | 103 | 1.24% | 1.31% | 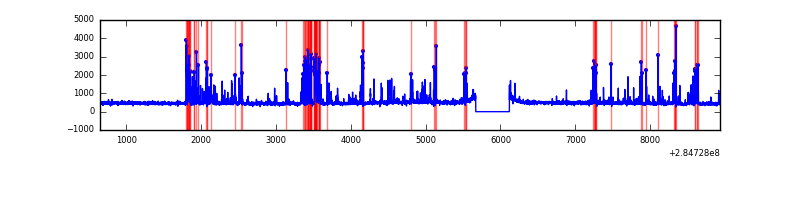 |
| D | 8288 | 7838 | 32 | 32 | 0.39% | 0.41% | 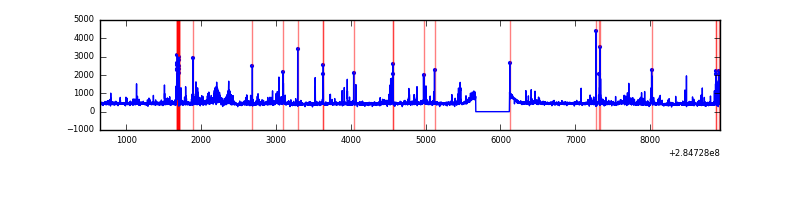 |
Top three noisy pixels from each quadrant. If the there are fewer than three noisy pixels in the level2.evt file, extra rows are filled as -1
| Pixel properties | Quadrant properties | ||||||
|---|---|---|---|---|---|---|---|
| Quadrant | DetID | PixID | Counts | Sigma | Mean | Median | Sigma |
| A | 15 | 174 | 41590 | 219.88 | 910 | 887 | 185.1 |
| A | 0 | 226 | 8106 | 38.99 | 910 | 887 | 185.1 |
| A | 3 | 137 | 6838 | 32.14 | 910 | 887 | 185.1 |
| B | 7 | 220 | 279138 | 1612.77 | 903 | 881 | 172.5 |
| B | 0 | 219 | 35705 | 201.84 | 903 | 881 | 172.5 |
| B | 0 | 229 | 32469 | 183.08 | 903 | 881 | 172.5 |
| C | 4 | 254 | 738764 | 3627.2 | 864 | 869 | 203.4 |
| C | 14 | 238 | 132408 | 646.59 | 864 | 869 | 203.4 |
| C | 5 | 218 | 57394 | 277.85 | 864 | 869 | 203.4 |
| D | 5 | 222 | 293471 | 1384.68 | 886 | 866 | 211.3 |
| D | 10 | 70 | 90719 | 425.21 | 886 | 866 | 211.3 |
| D | 2 | 234 | 37242 | 172.14 | 886 | 866 | 211.3 |
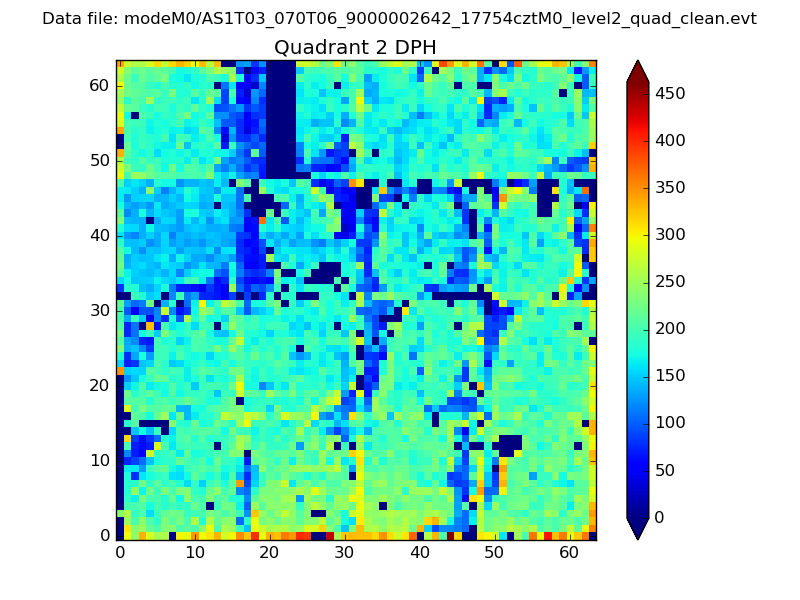
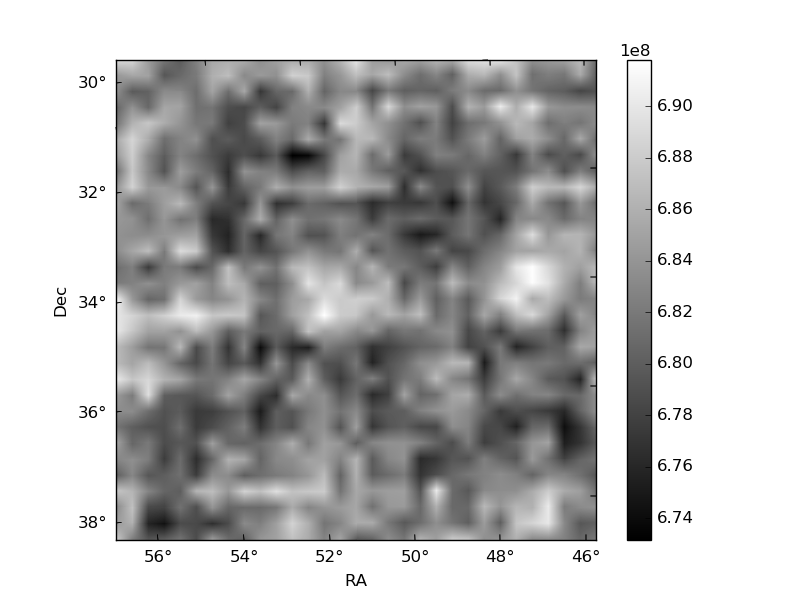
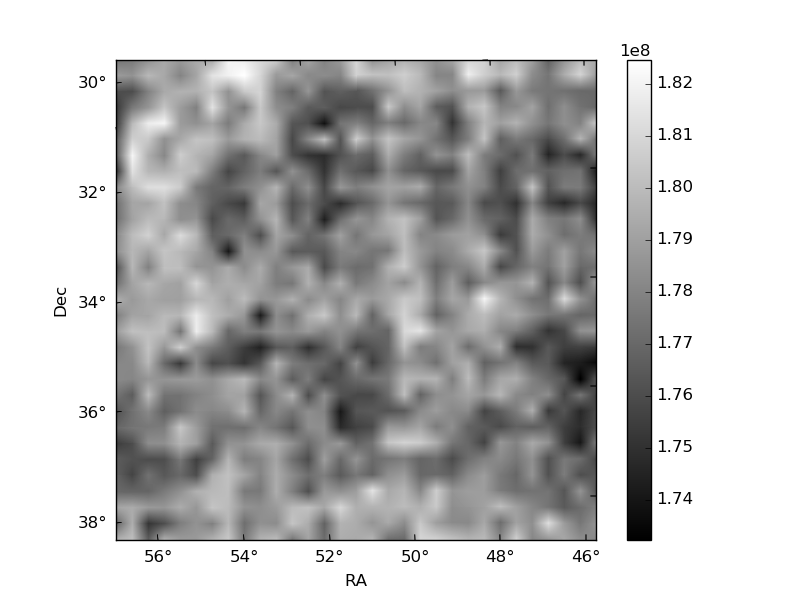
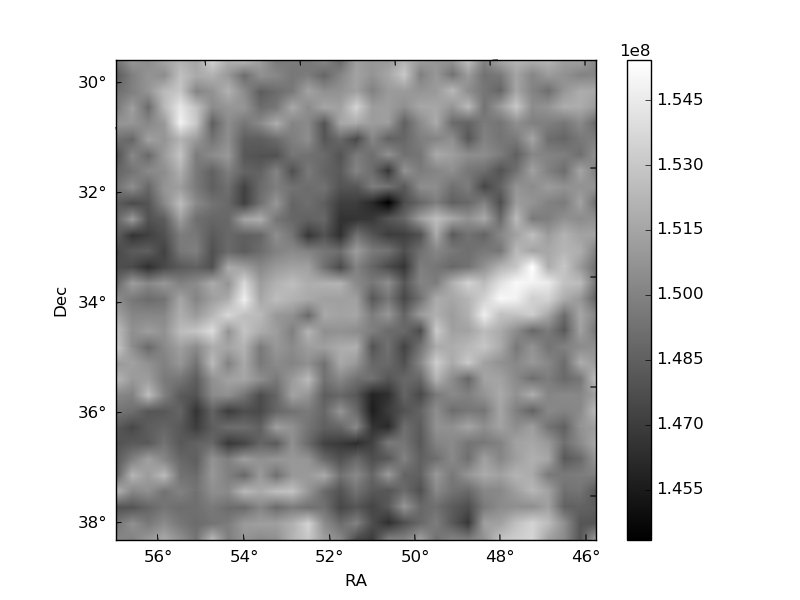
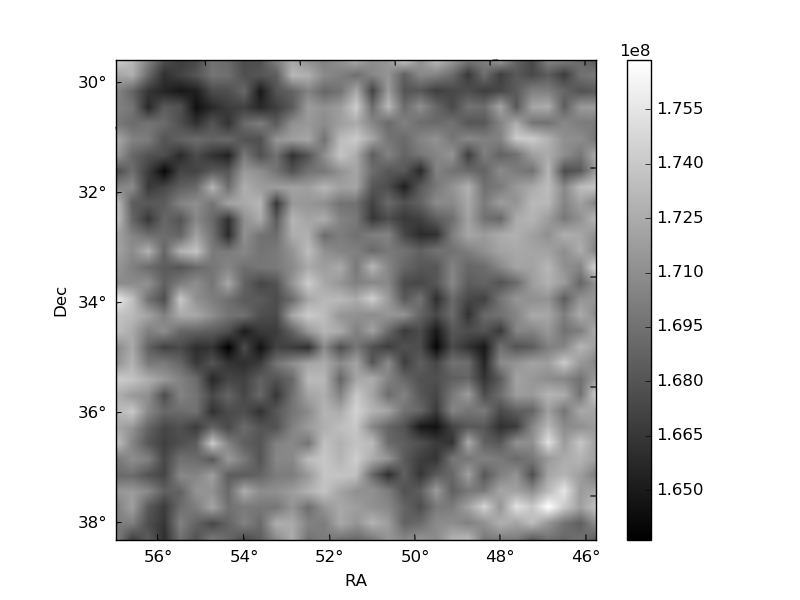
Histogram calculated using DETX and DETY for each event in the final _common_clean file
| Quadrant A | 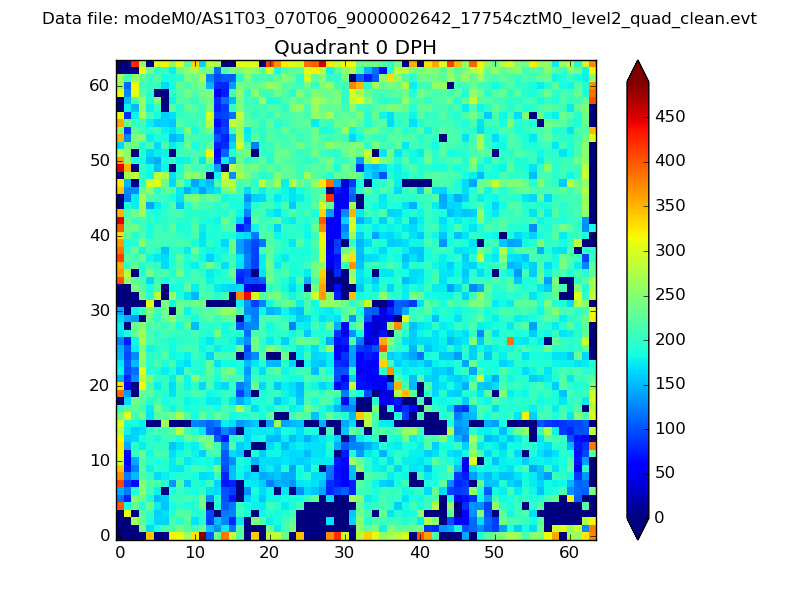 |
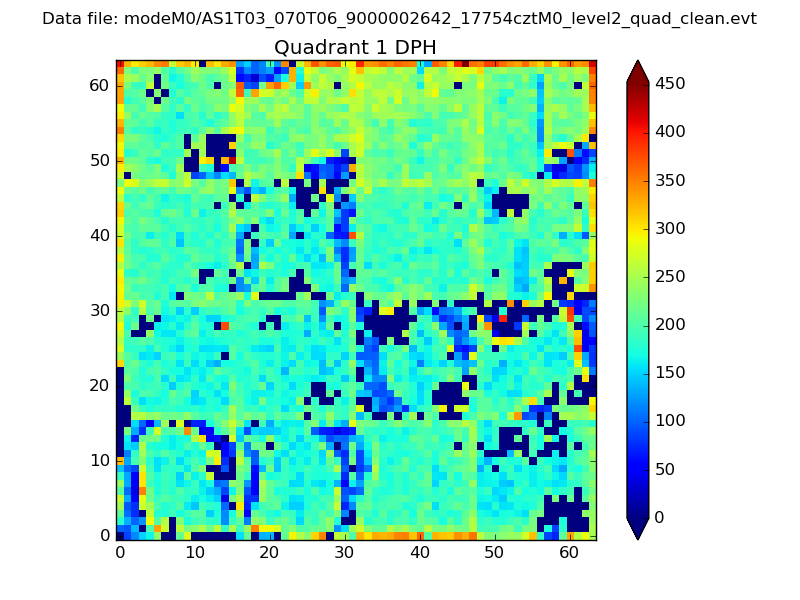 |
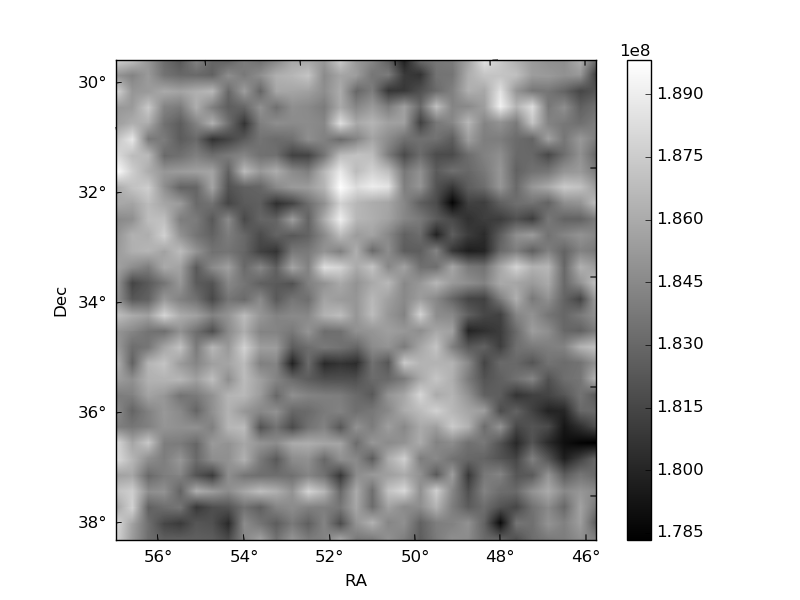
Quadrant B |
|---|---|---|---|
| Quadrant D | 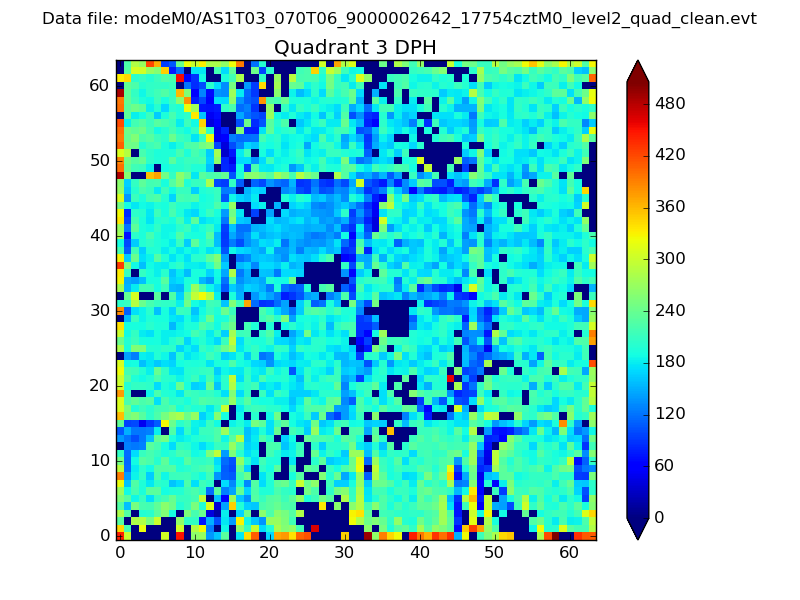 |
 |
Quadrant C |
| Plot type | Count rate plots | Images |
|---|---|---|
| Comparison with Poisson distribution Blue bars denote a histogram of data divided into 1 sec bins. Red curve is a Poisson curve with rate = median count rate of data. |
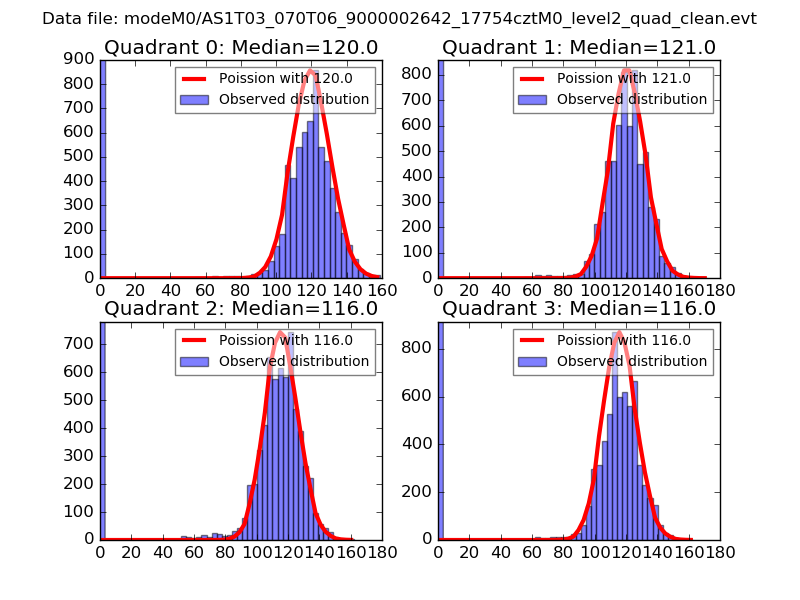 |
 |
| Quadrant-wise count rates Data is divided into 100 sec bins |
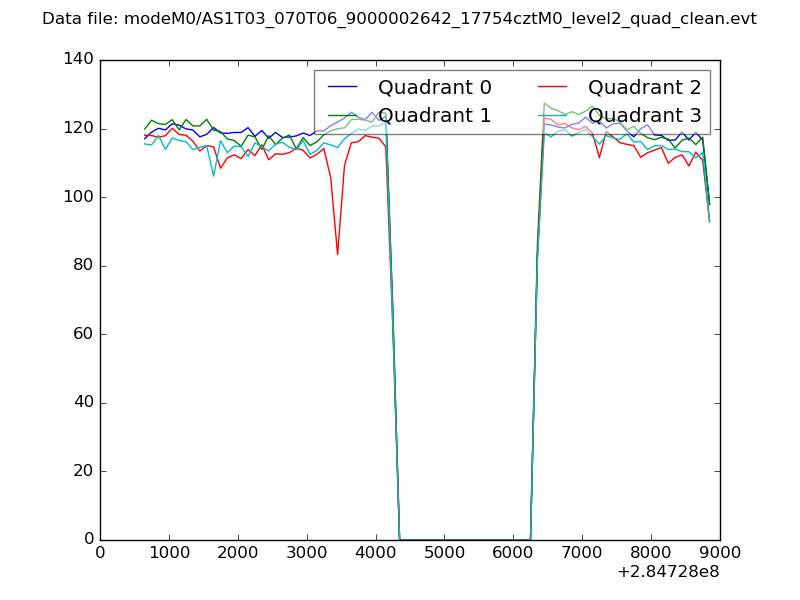 |
|
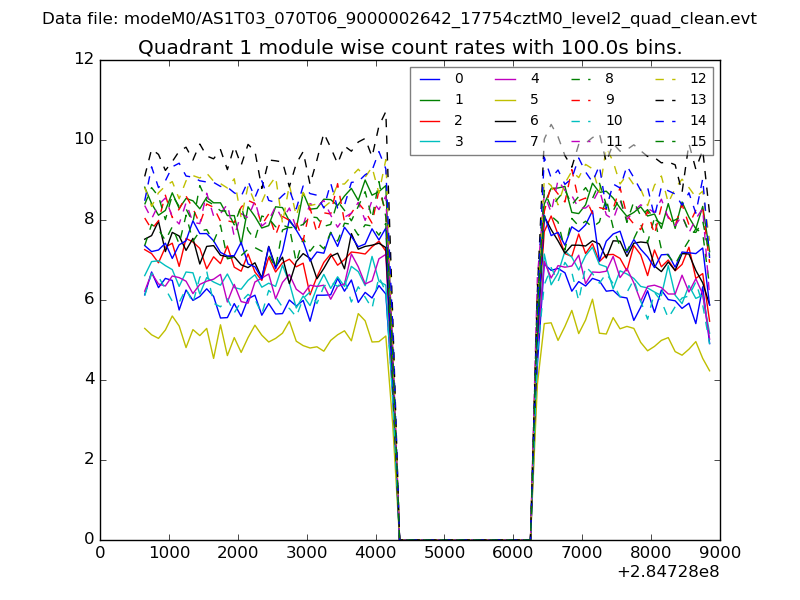
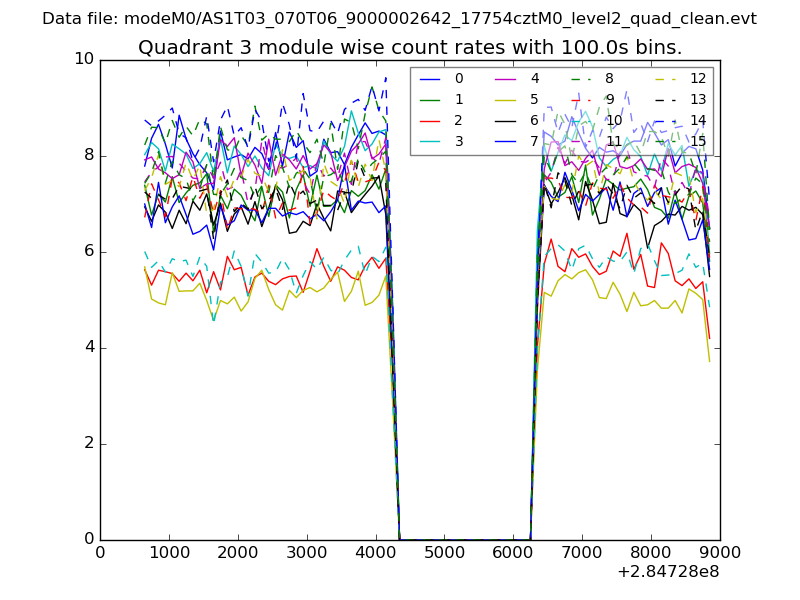
| Module-wise count rates for Quadrant A Data is divided into 100 sec bins |
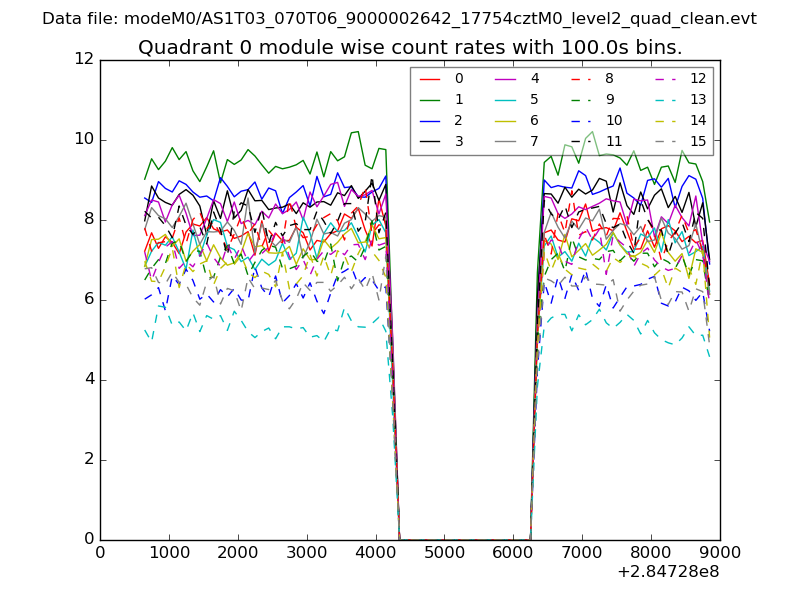 |
 |
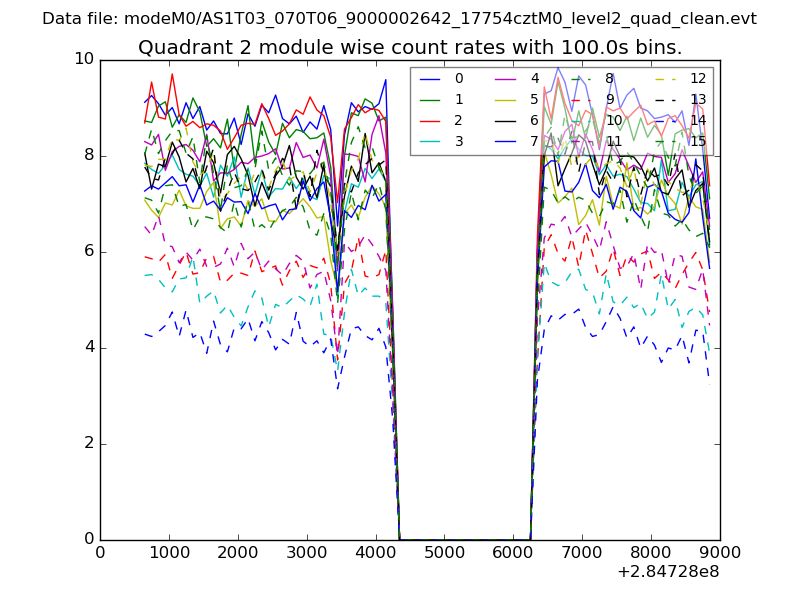
| Module-wise count rates for Quadrant B Data is divided into 100 sec bins |
 |
 |
| Module-wise count rates for Quadrant C Data is divided into 100 sec bins |
 |
 |
| Module-wise count rates for Quadrant D Data is divided into 100 sec bins |
 |
 |
| Parameter | Plot |
|---|---|
| CZT HV Monitor | 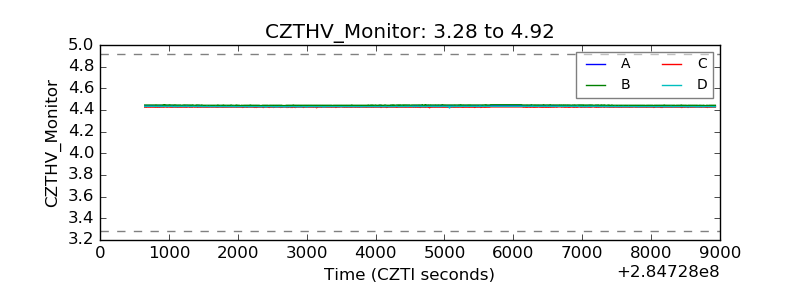 |
| D_VDD | 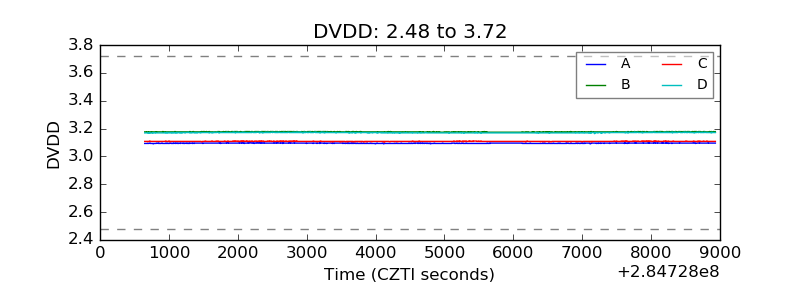 |
| Temperature 1 | 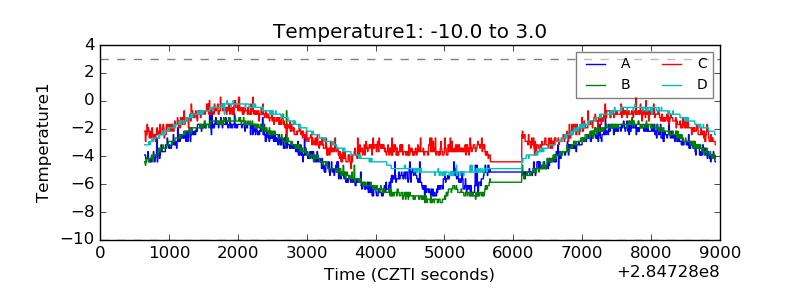 |
| Veto HV Monitor | 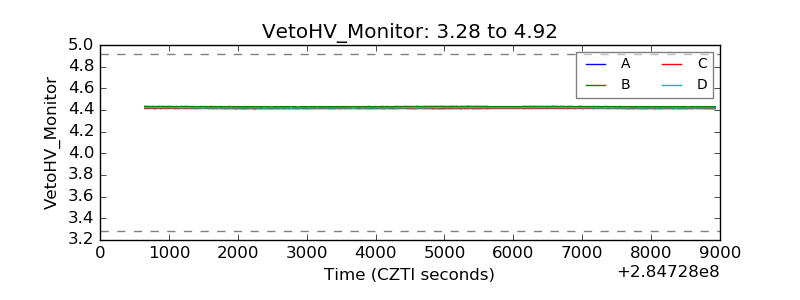 |
| Veto LLD | 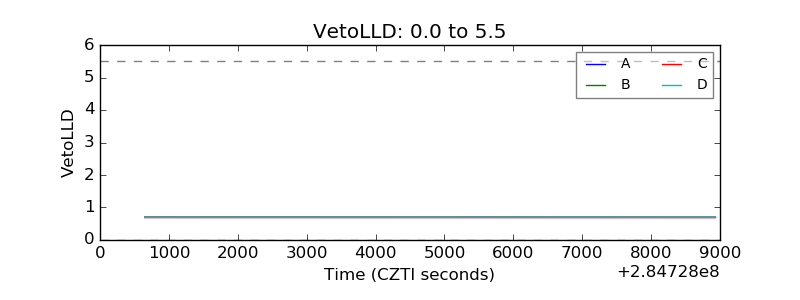 |
| Alpha Counter | 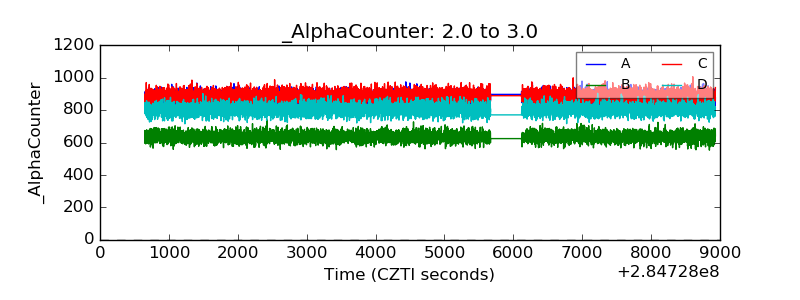 |
| _CPM_Rate | 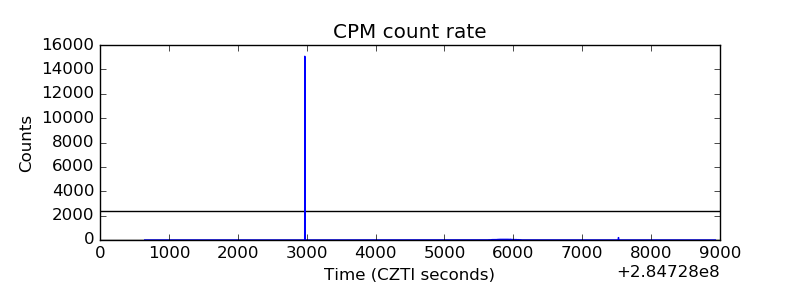 |
| CZT Counter | 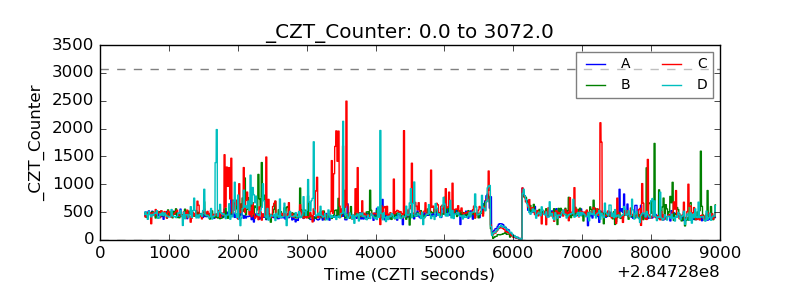 |
| +2.5 Volts monitor |  |
| +5 Volts monitor |  |
| _ROLL_ROT | 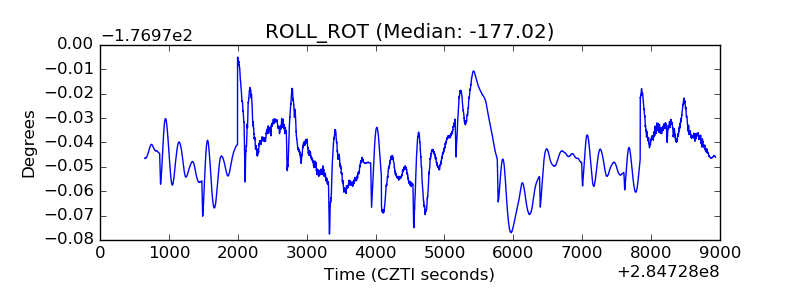 |
| _Roll_DEC | 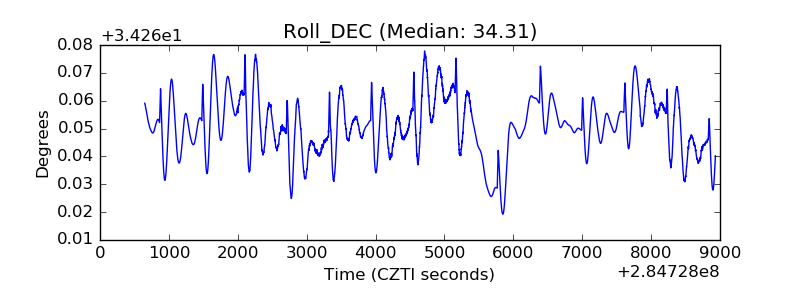 |
| _Roll_RA | 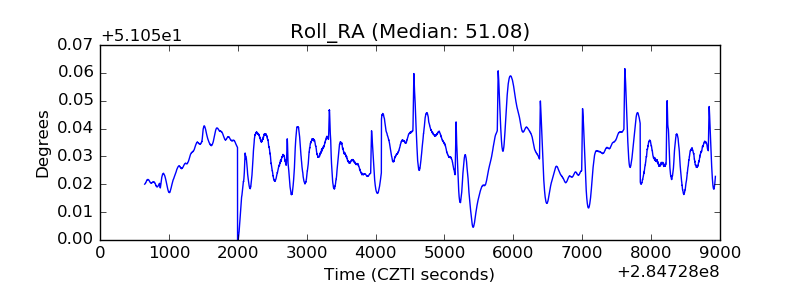 |
| Veto Counter | 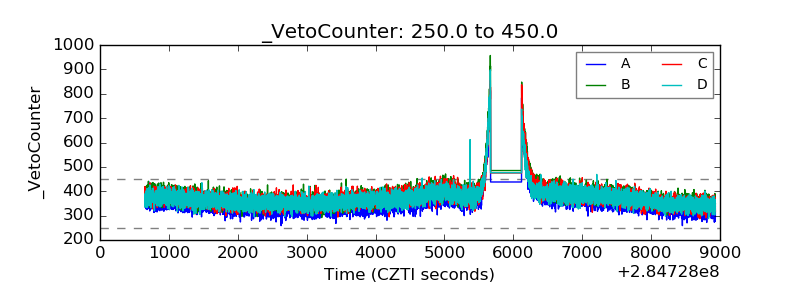 |