| Param | Original file | Final file |
|---|---|---|
| Filename | modeM0/AS1T03_070T07_9000002644cztM0_level2.fits | modeM0/AS1T03_070T07_9000002644cztM0_level2_quad_clean.evt |
| Size (bytes) | 132,730,560 | 101,223,360 |
| Size | 126.6 MB | 96.5 MB |
| Events in quadrant A | 828,226 | 603,704 |
| Events in quadrant B | 787,708 | 565,153 |
| Events in quadrant C | 682,102 | 348,287 |
| Events in quadrant D | 702,652 | 529,774 |
| Mode M9 | |||
|---|---|---|---|
| Quadrant | BADHDUFLAG | Total packets | Discarded packets |
| A | 0 | 24 | 0 |
| B | 0 | 24 | 0 |
| C | 0 | 24 | 0 |
| D | 0 | 24 | 0 |
| Mode SS | |||
|---|---|---|---|
| Quadrant | BADHDUFLAG | Total packets | Discarded packets |
| A | 0 | 302 | 0 |
| B | 0 | 302 | 0 |
| C | 0 | 302 | 0 |
| D | 0 | 302 | 0 |
| Mode M0 | |||
|---|---|---|---|
| Quadrant | BADHDUFLAG | Total packets | Discarded packets |
| A | 0 | 31280 | 0 |
| B | 0 | 34873 | 0 |
| C | 0 | 48036 | 0 |
| D | 0 | 35706 | 0 |
| Quadrant | Total seconds | Saturated seconds | Saturation percentage |
|---|---|---|---|
| A | 14735 | 207 | 1.404818% |
| B | 14735 | 516 | 3.501866% |
| C | 14735 | 3232 | 21.934170% |
| D | 14735 | 454 | 3.081099% |
Noise dominated data is calculated using 1-second bins in cleaned event files. If a bin has >2000 counts, and if more than 50% of those come from <1% of pixels, then it is considered to be noise-dominated and hence unusable.
| Quadrant | # 1 sec bins | Bins with >0 counts | Bins with >2000 counts | High rate bins dominated by noise | Noise dominated (total time) | Noise dominated (detector-on time) | Marked lightcurve |
|---|---|---|---|---|---|---|---|
| A | 17220 | 14732 | 0 | 0 | 0.00% | 0.00% |  |
| B | 17220 | 14733 | 0 | 0 | 0.00% | 0.00% | 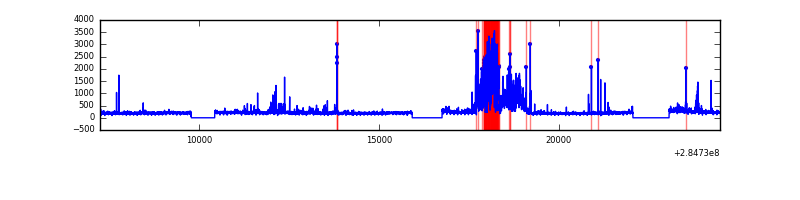 |
| C | 17220 | 14414 | 0 | 0 | 0.00% | 0.00% |  |
| D | 17220 | 14733 | 0 | 0 | 0.00% | 0.00% |  |
Top three noisy pixels from each quadrant. If the there are fewer than three noisy pixels in the level2.evt file, extra rows are filled as -1
| Pixel properties | Quadrant properties | ||||||
|---|---|---|---|---|---|---|---|
| Quadrant | DetID | PixID | Counts | Sigma | Mean | Median | Sigma |
| A | 0 | 29 | 744 | 9.89 | 215 | 201 | 54.9 |
| A | 7 | 110 | 703 | 9.15 | 215 | 201 | 54.9 |
| A | 9 | 19 | 657 | 8.31 | 215 | 201 | 54.9 |
| B | 2 | 9 | 620 | 9.63 | 207 | 198 | 43.8 |
| B | 5 | 225 | 571 | 8.52 | 207 | 198 | 43.8 |
| B | 2 | 8 | 546 | 7.94 | 207 | 198 | 43.8 |
| C | 1 | 80 | 526 | 7.53 | 180 | 168 | 47.5 |
| C | 1 | 81 | 506 | 7.11 | 180 | 168 | 47.5 |
| C | 12 | 241 | 491 | 6.79 | 180 | 168 | 47.5 |
| D | 3 | 14 | 542 | 6.48 | 200 | 181 | 55.7 |
| D | 3 | 31 | 528 | 6.23 | 200 | 181 | 55.7 |
| D | 1 | 26 | 497 | 5.67 | 200 | 181 | 55.7 |
Histogram calculated using DETX and DETY for each event in the final _common_clean file
| Quadrant A | 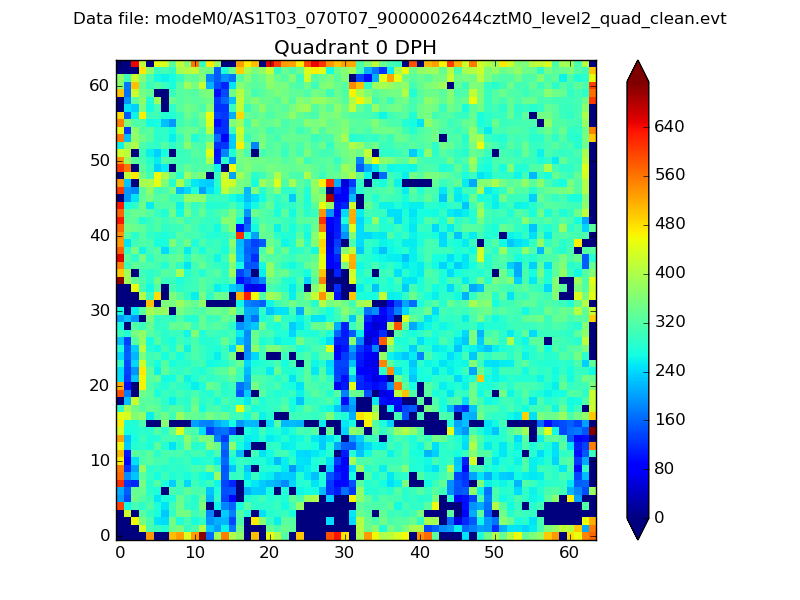 |
 |
Quadrant B |
|---|---|---|---|
| Quadrant D |  |
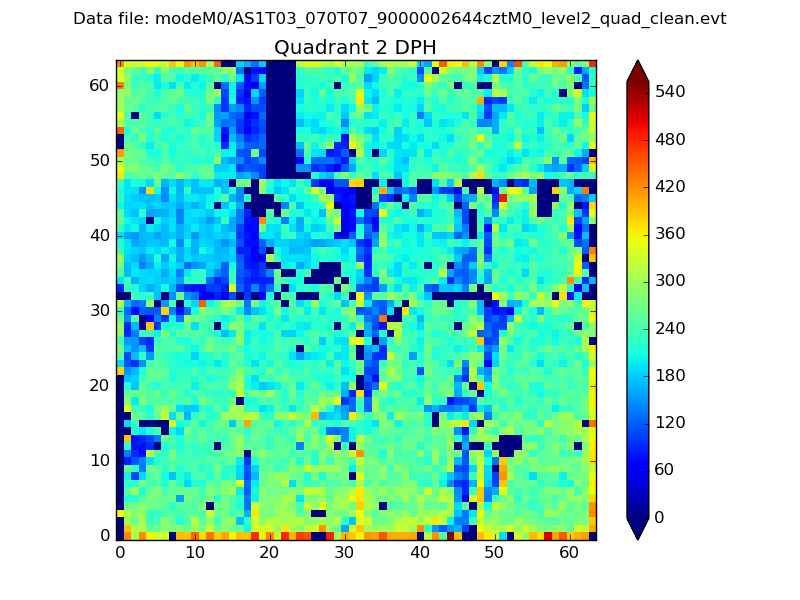 |
Quadrant C |
| Plot type | Count rate plots | Images |
|---|---|---|
| Comparison with Poisson distribution Blue bars denote a histogram of data divided into 1 sec bins. Red curve is a Poisson curve with rate = median count rate of data. |
 |
 |
| Quadrant-wise count rates Data is divided into 100 sec bins |
 |
|
| Module-wise count rates for Quadrant A Data is divided into 100 sec bins |
 |
 |
| Module-wise count rates for Quadrant B Data is divided into 100 sec bins |
 |
 |
| Module-wise count rates for Quadrant C Data is divided into 100 sec bins |
 |
 |
| Module-wise count rates for Quadrant D Data is divided into 100 sec bins |
 |
 |
| Parameter | Plot |
|---|---|
| CZT HV Monitor |  |
| D_VDD | 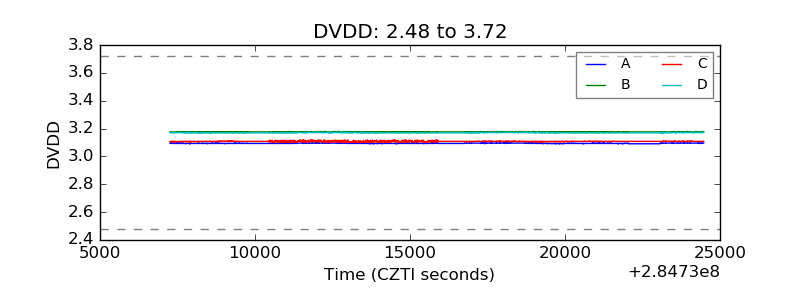 |
| Temperature 1 |  |
| Veto HV Monitor |  |
| Veto LLD |  |
| Alpha Counter |  |
| _CPM_Rate |  |
| CZT Counter |  |
| +2.5 Volts monitor |  |
| +5 Volts monitor |  |
| _ROLL_ROT |  |
| _Roll_DEC |  |
| _Roll_RA |  |
| Veto Counter |  |