| Param | Original file | Final file |
|---|---|---|
| Filename | modeM0/AS1T03_070T07_9000002644_17754cztM0_level2.evt | modeM0/AS1T03_070T07_9000002644_17754cztM0_level2_quad_clean.evt |
| Size (bytes) | 738,521,280 | 115,358,400 |
| Size | 704.3 MB | 110.0 MB |
| Events in quadrant A | 4,609,549 | 745,296 |
| Events in quadrant B | 5,441,448 | 732,479 |
| Events in quadrant C | 6,510,459 | 634,586 |
| Events in quadrant D | 5,155,144 | 716,017 |
| Mode M9 | |||
|---|---|---|---|
| Quadrant | BADHDUFLAG | Total packets | Discarded packets |
| A | 0 | 14 | 0 |
| B | 0 | 14 | 0 |
| C | 0 | 14 | 0 |
| D | 0 | 14 | 0 |
| Mode SS | |||
|---|---|---|---|
| Quadrant | BADHDUFLAG | Total packets | Discarded packets |
| A | 0 | 198 | 0 |
| B | 0 | 198 | 0 |
| C | 0 | 198 | 0 |
| D | 0 | 198 | 0 |
| Mode M0 | |||
|---|---|---|---|
| Quadrant | BADHDUFLAG | Total packets | Discarded packets |
| A | 0 | 20218 | 2 |
| B | 0 | 22388 | 2 |
| C | 0 | 25354 | 2 |
| D | 0 | 21899 | 2 |
| Quadrant | Total seconds | Saturated seconds | Saturation percentage |
|---|---|---|---|
| A | 9579 | 149 | 1.555486% |
| B | 9579 | 421 | 4.395031% |
| C | 9579 | 1066 | 11.128510% |
| D | 9578 | 226 | 2.359574% |
Noise dominated data is calculated using 1-second bins in cleaned event files. If a bin has >2000 counts, and if more than 50% of those come from <1% of pixels, then it is considered to be noise-dominated and hence unusable.
| Quadrant | # 1 sec bins | Bins with >0 counts | Bins with >2000 counts | High rate bins dominated by noise | Noise dominated (total time) | Noise dominated (detector-on time) | Marked lightcurve |
|---|---|---|---|---|---|---|---|
| A | 11059 | 9580 | 20 | 20 | 0.18% | 0.21% | 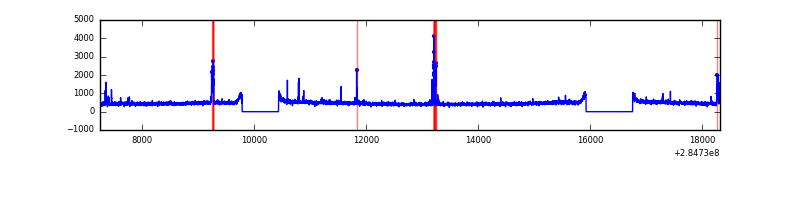 |
| B | 11059 | 9580 | 231 | 231 | 2.09% | 2.41% | 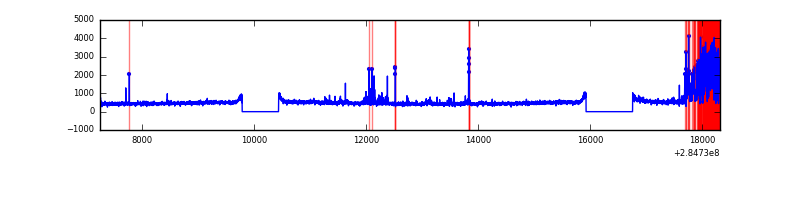 |
| C | 11058 | 9579 | 682 | 682 | 6.17% | 7.12% | 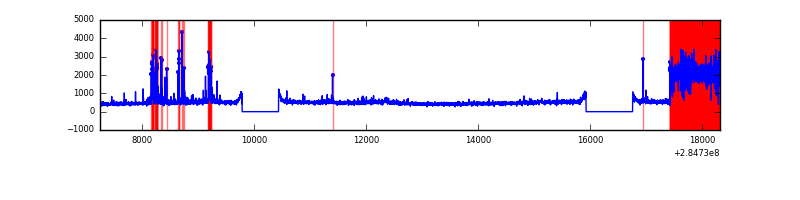 |
| D | 11058 | 9579 | 121 | 121 | 1.09% | 1.26% |  |
Top three noisy pixels from each quadrant. If the there are fewer than three noisy pixels in the level2.evt file, extra rows are filled as -1
| Pixel properties | Quadrant properties | ||||||
|---|---|---|---|---|---|---|---|
| Quadrant | DetID | PixID | Counts | Sigma | Mean | Median | Sigma |
| A | 15 | 174 | 224815 | 964.01 | 1139 | 1110 | 232.1 |
| A | 0 | 226 | 9928 | 38.0 | 1139 | 1110 | 232.1 |
| A | 3 | 137 | 8645 | 32.47 | 1139 | 1110 | 232.1 |
| B | 10 | 245 | 840605 | 3868.75 | 1128 | 1099 | 217.0 |
| B | 7 | 220 | 81799 | 371.89 | 1128 | 1099 | 217.0 |
| B | 0 | 219 | 43657 | 196.12 | 1128 | 1099 | 217.0 |
| C | 4 | 254 | 2118713 | 8807.7 | 1022 | 1030 | 240.4 |
| C | 3 | 233 | 164508 | 679.93 | 1022 | 1030 | 240.4 |
| C | 14 | 238 | 155884 | 644.06 | 1022 | 1030 | 240.4 |
| D | 5 | 222 | 380091 | 1440.03 | 1103 | 1077 | 263.2 |
| D | 7 | 238 | 345710 | 1309.41 | 1103 | 1077 | 263.2 |
| D | 2 | 165 | 108720 | 408.98 | 1103 | 1077 | 263.2 |
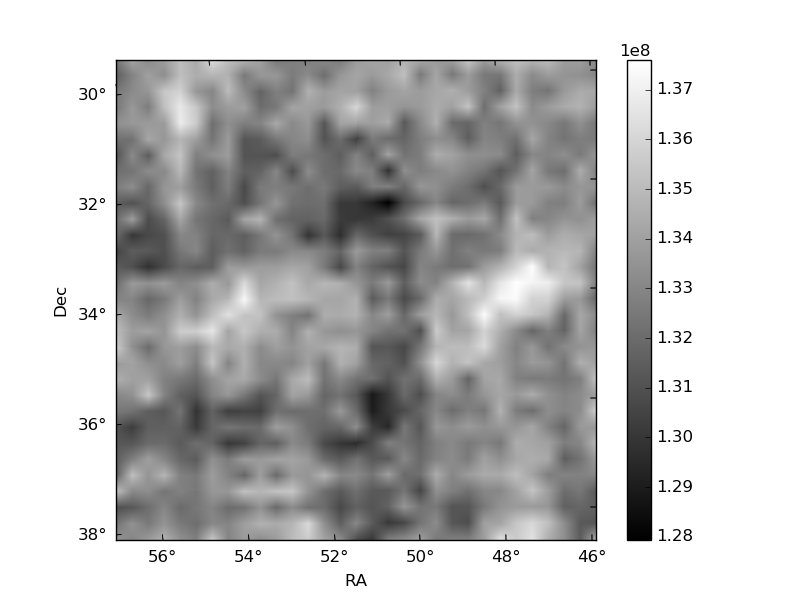
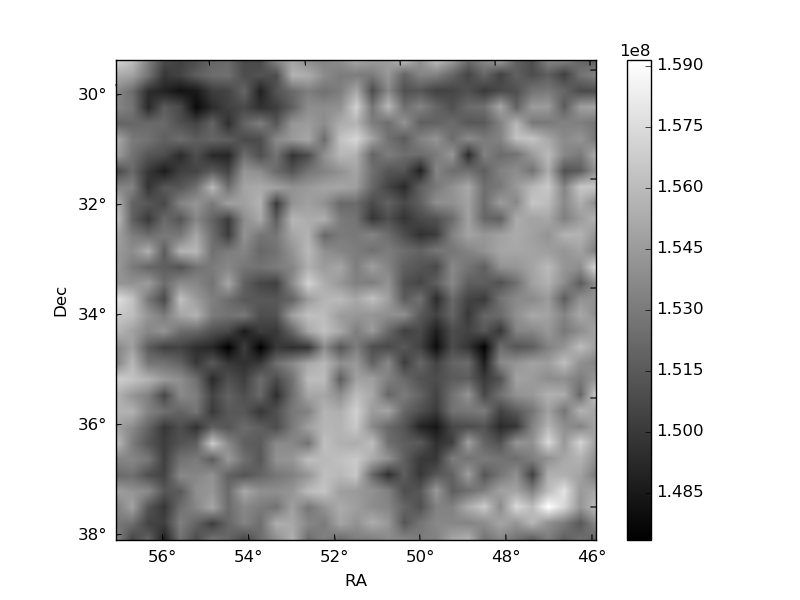
Histogram calculated using DETX and DETY for each event in the final _common_clean file
| Quadrant A |  |
 |
Quadrant B |
|---|---|---|---|
| Quadrant D | 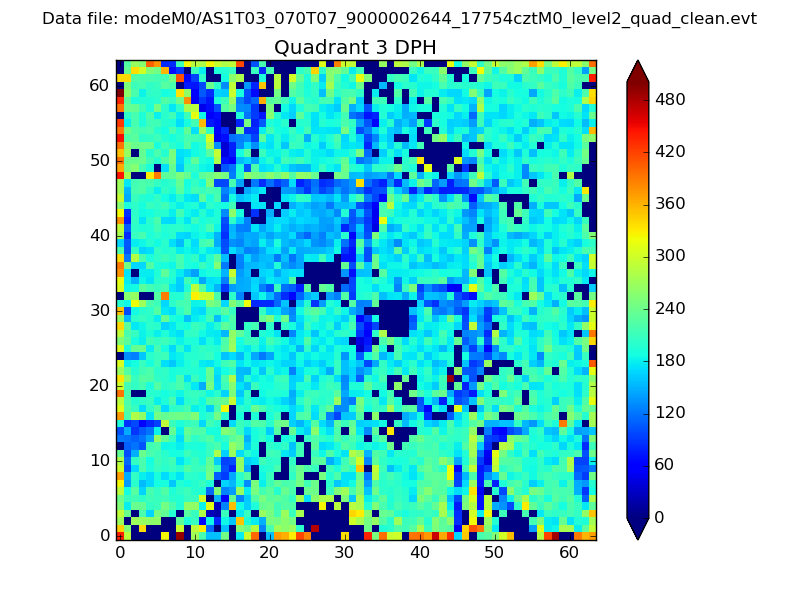 |
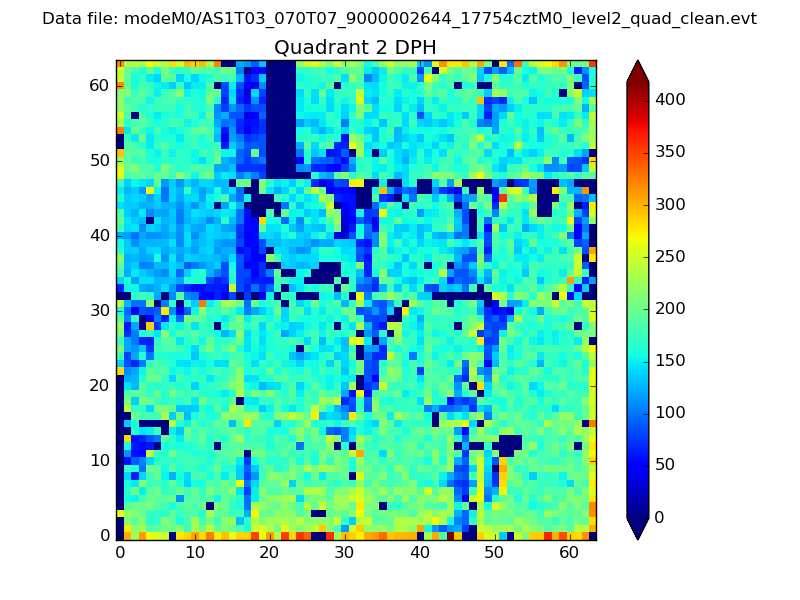 |
Quadrant C |
| Plot type | Count rate plots | Images |
|---|---|---|
| Comparison with Poisson distribution Blue bars denote a histogram of data divided into 1 sec bins. Red curve is a Poisson curve with rate = median count rate of data. |
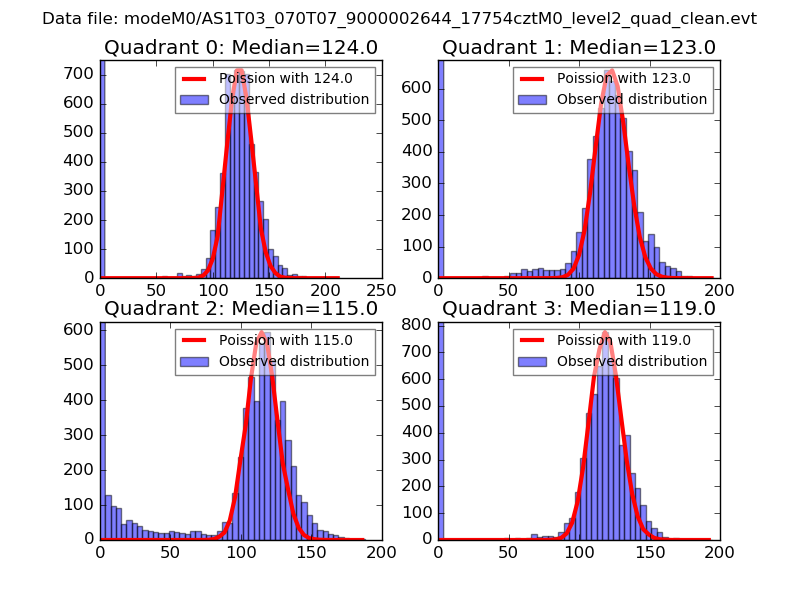 |
 |
| Quadrant-wise count rates Data is divided into 100 sec bins |
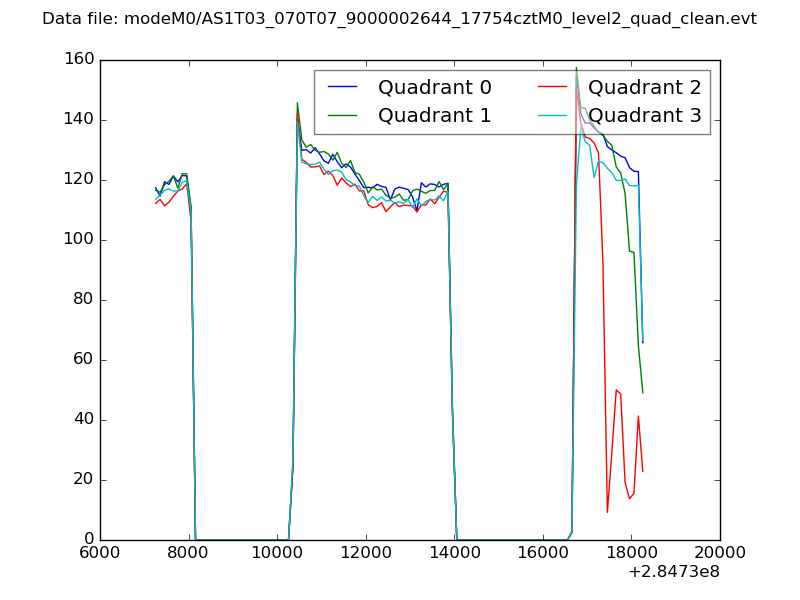 |
|
| Module-wise count rates for Quadrant A Data is divided into 100 sec bins |
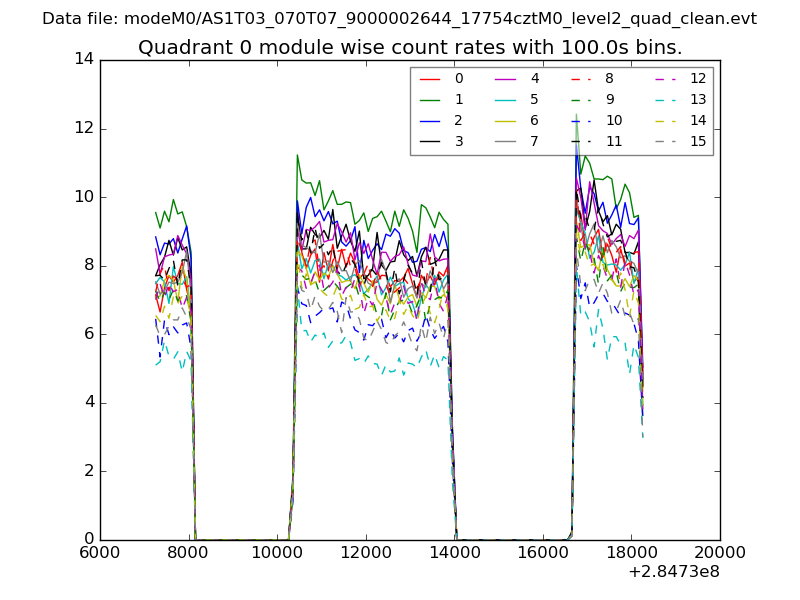 |
 |
| Module-wise count rates for Quadrant B Data is divided into 100 sec bins |
 |
 |
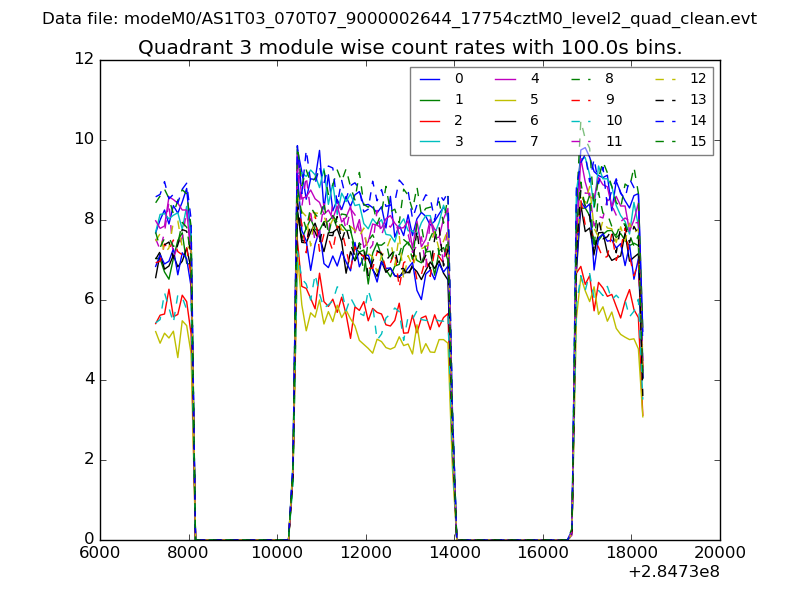
| Module-wise count rates for Quadrant C Data is divided into 100 sec bins |
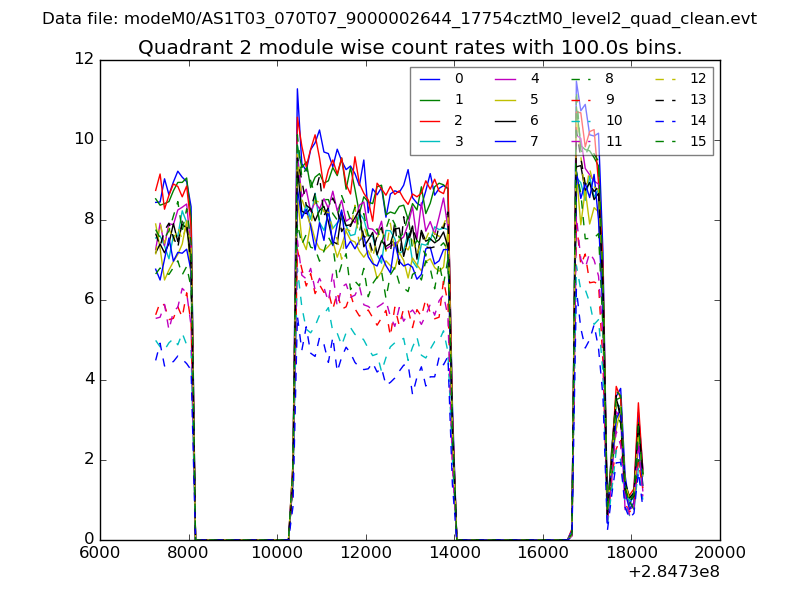 |
 |
| Module-wise count rates for Quadrant D Data is divided into 100 sec bins |
 |
 |
| Parameter | Plot |
|---|---|
| CZT HV Monitor |  |
| D_VDD | 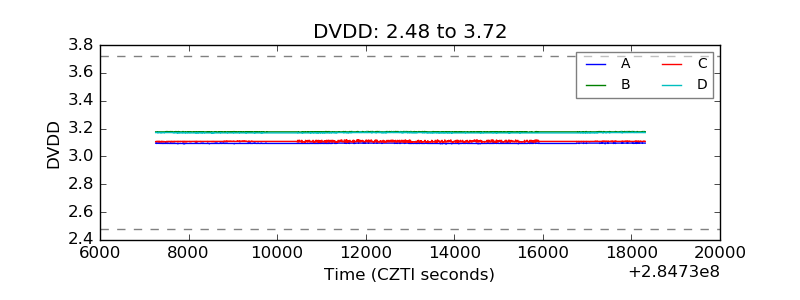 |
| Temperature 1 | 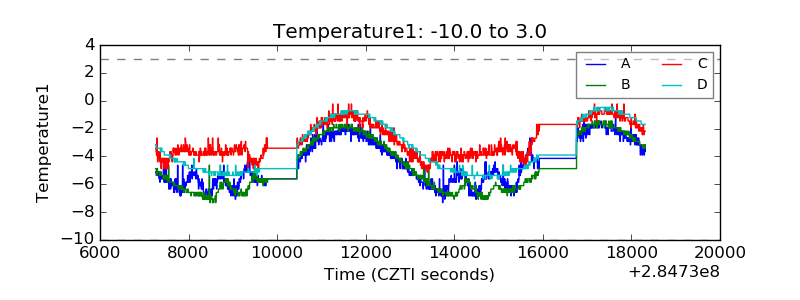 |
| Veto HV Monitor | 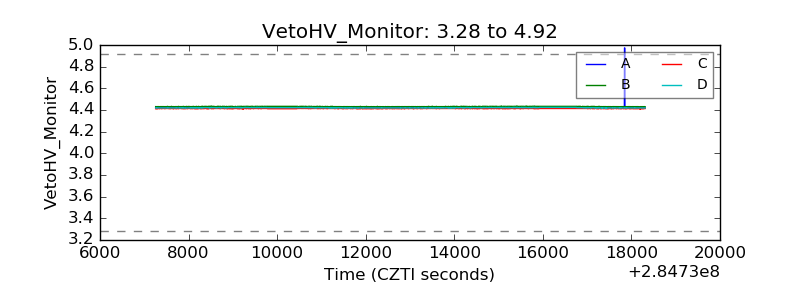 |
| Veto LLD | 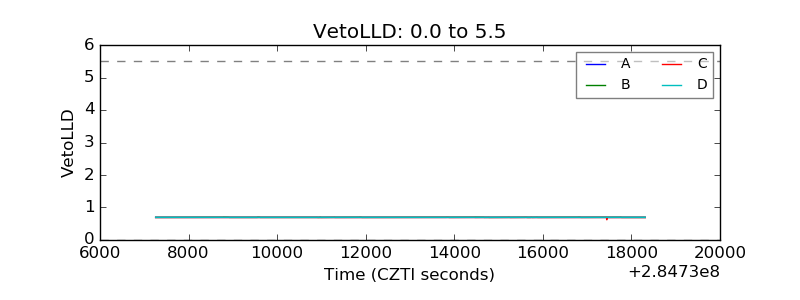 |
| Alpha Counter | 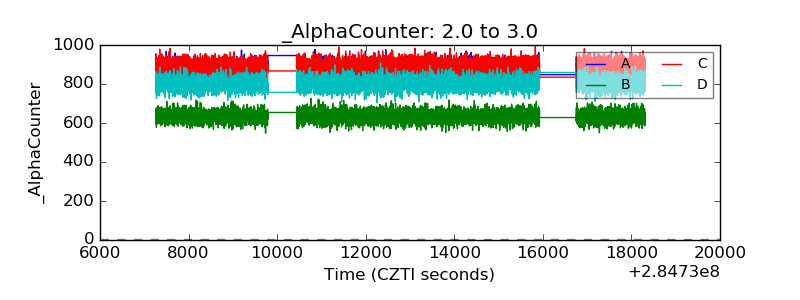 |
| _CPM_Rate | 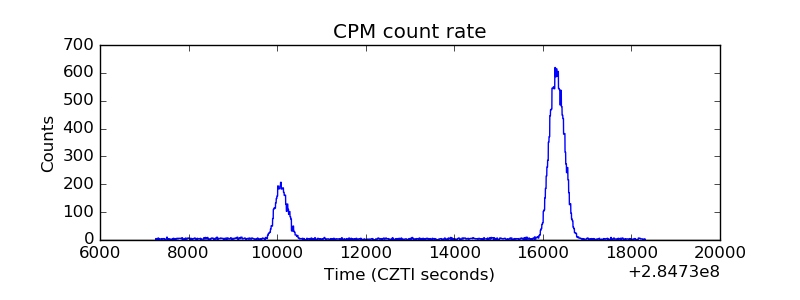 |
| CZT Counter | 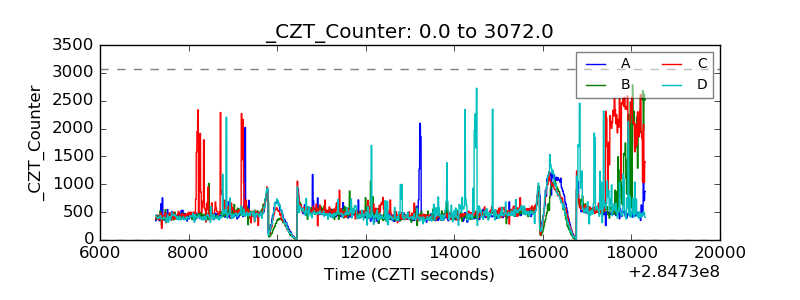 |
| +2.5 Volts monitor |  |
| +5 Volts monitor |  |
| _ROLL_ROT | 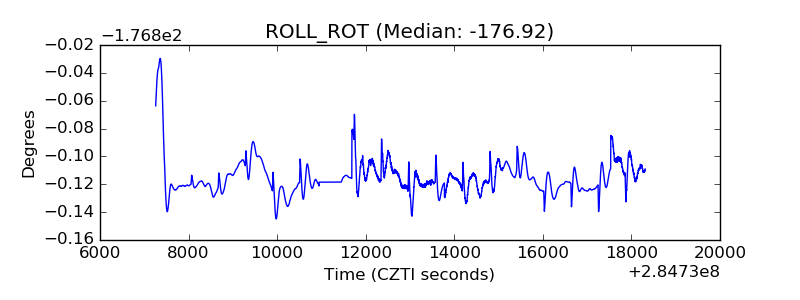 |
| _Roll_DEC | 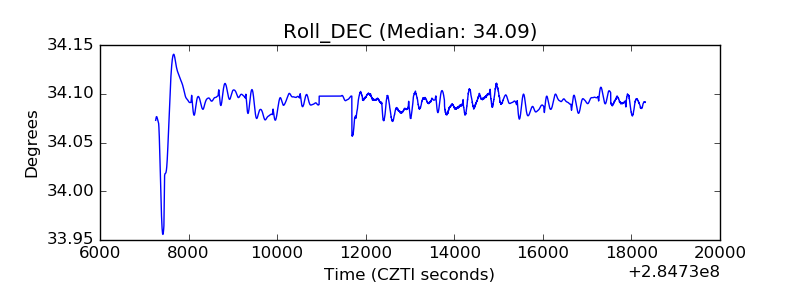 |
| _Roll_RA | 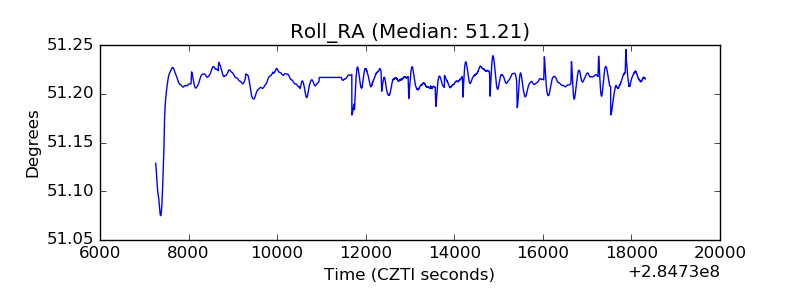 |
| Veto Counter |  |