| Param | Original file | Final file |
|---|---|---|
| Filename | modeM0/AS1T03_070T07_9000002644_17755cztM0_level2.evt | modeM0/AS1T03_070T07_9000002644_17755cztM0_level2_quad_clean.evt |
| Size (bytes) | 720,077,760 | 85,458,240 |
| Size | 686.7 MB | 81.5 MB |
| Events in quadrant A | 3,336,883 | 604,646 |
| Events in quadrant B | 4,626,544 | 585,379 |
| Events in quadrant C | 8,814,341 | 354,910 |
| Events in quadrant D | 4,575,300 | 573,885 |
| Mode M9 | |||
|---|---|---|---|
| Quadrant | BADHDUFLAG | Total packets | Discarded packets |
| A | 0 | 10 | 0 |
| B | 0 | 10 | 0 |
| C | 0 | 10 | 0 |
| D | 0 | 10 | 0 |
| Mode SS | |||
|---|---|---|---|
| Quadrant | BADHDUFLAG | Total packets | Discarded packets |
| A | 0 | 136 | 0 |
| B | 0 | 136 | 0 |
| C | 0 | 136 | 0 |
| D | 0 | 136 | 0 |
| Mode M0 | |||
|---|---|---|---|
| Quadrant | BADHDUFLAG | Total packets | Discarded packets |
| A | 0 | 14416 | 2 |
| B | 0 | 18208 | 2 |
| C | 0 | 30493 | 2 |
| D | 0 | 18191 | 2 |
| Quadrant | Total seconds | Saturated seconds | Saturation percentage |
|---|---|---|---|
| A | 6708 | 67 | 0.998807% |
| B | 6709 | 393 | 5.857803% |
| C | 6709 | 3032 | 45.193024% |
| D | 6709 | 328 | 4.888955% |
Noise dominated data is calculated using 1-second bins in cleaned event files. If a bin has >2000 counts, and if more than 50% of those come from <1% of pixels, then it is considered to be noise-dominated and hence unusable.
| Quadrant | # 1 sec bins | Bins with >0 counts | Bins with >2000 counts | High rate bins dominated by noise | Noise dominated (total time) | Noise dominated (detector-on time) | Marked lightcurve |
|---|---|---|---|---|---|---|---|
| A | 7713 | 6708 | 11 | 11 | 0.14% | 0.16% | 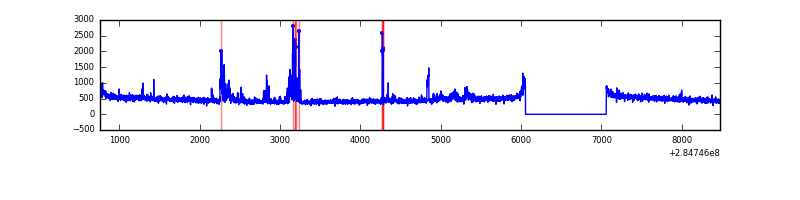 |
| B | 7714 | 6709 | 264 | 264 | 3.42% | 3.94% | 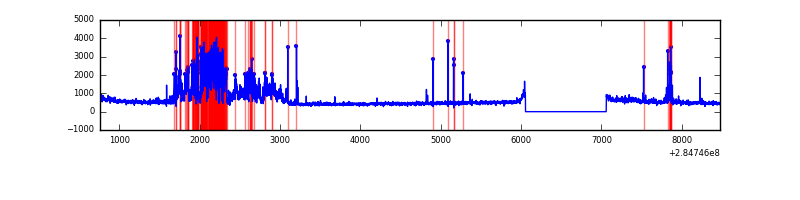 |
| C | 7714 | 6709 | 2278 | 2278 | 29.53% | 33.95% | 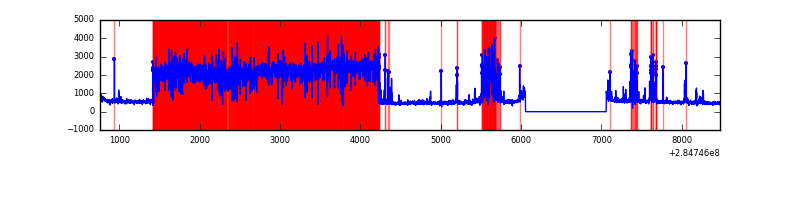 |
| D | 7714 | 6710 | 246 | 246 | 3.19% | 3.67% | 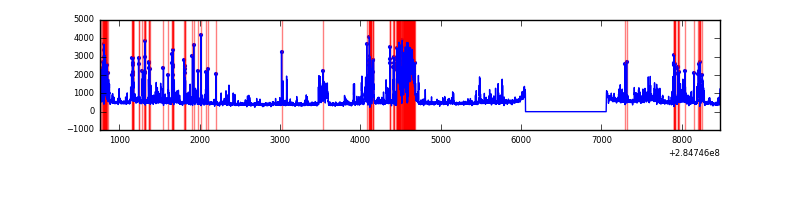 |
Top three noisy pixels from each quadrant. If the there are fewer than three noisy pixels in the level2.evt file, extra rows are filled as -1
| Pixel properties | Quadrant properties | ||||||
|---|---|---|---|---|---|---|---|
| Quadrant | DetID | PixID | Counts | Sigma | Mean | Median | Sigma |
| A | 15 | 174 | 240947 | 1479.55 | 804 | 785 | 162.3 |
| A | 0 | 226 | 7011 | 38.36 | 804 | 785 | 162.3 |
| A | 12 | 194 | 6094 | 32.71 | 804 | 785 | 162.3 |
| B | 10 | 245 | 1346206 | 8849.7 | 789 | 768 | 152.0 |
| B | 7 | 220 | 93617 | 610.72 | 789 | 768 | 152.0 |
| B | 0 | 219 | 56764 | 368.31 | 789 | 768 | 152.0 |
| C | 4 | 254 | 6474041 | 50288.81 | 549 | 552 | 128.7 |
| C | 14 | 238 | 83194 | 642.0 | 549 | 552 | 128.7 |
| C | 5 | 218 | 43361 | 332.56 | 549 | 552 | 128.7 |
| D | 7 | 238 | 971749 | 5286.63 | 772 | 754 | 183.7 |
| D | 5 | 222 | 371031 | 2015.99 | 772 | 754 | 183.7 |
| D | 2 | 165 | 127032 | 687.53 | 772 | 754 | 183.7 |
Histogram calculated using DETX and DETY for each event in the final _common_clean file
| Quadrant A | 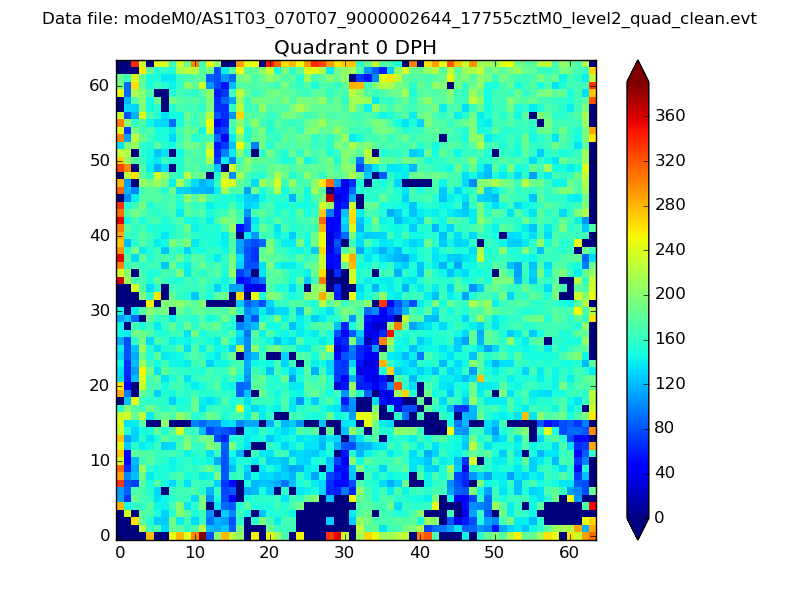 |
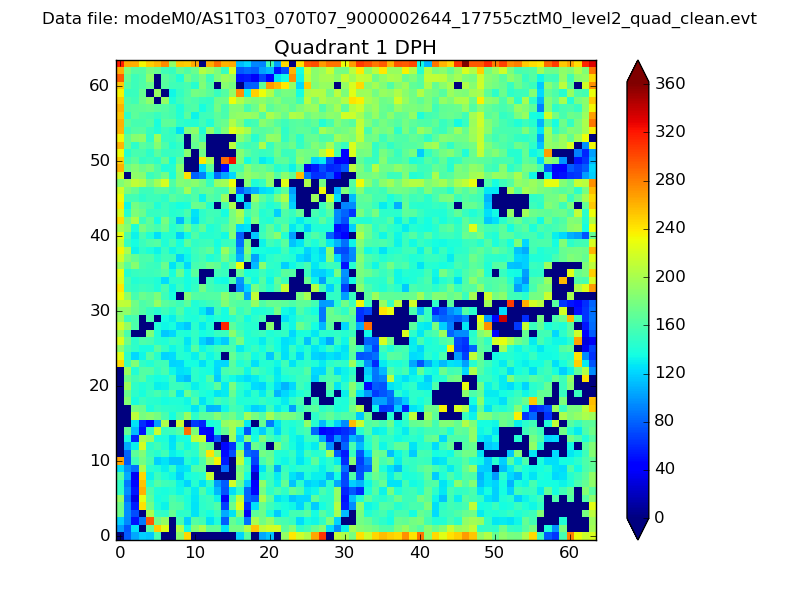 |
Quadrant B |
|---|---|---|---|
| Quadrant D |  |
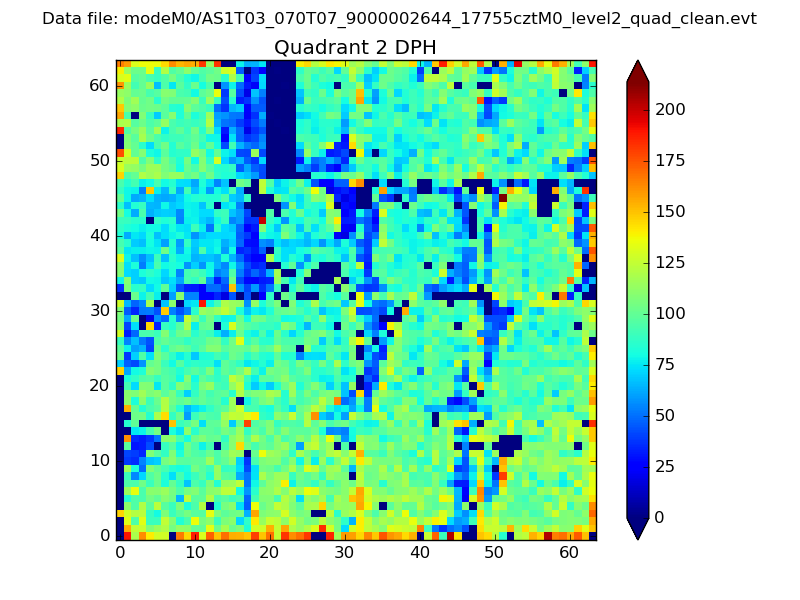 |
Quadrant C |
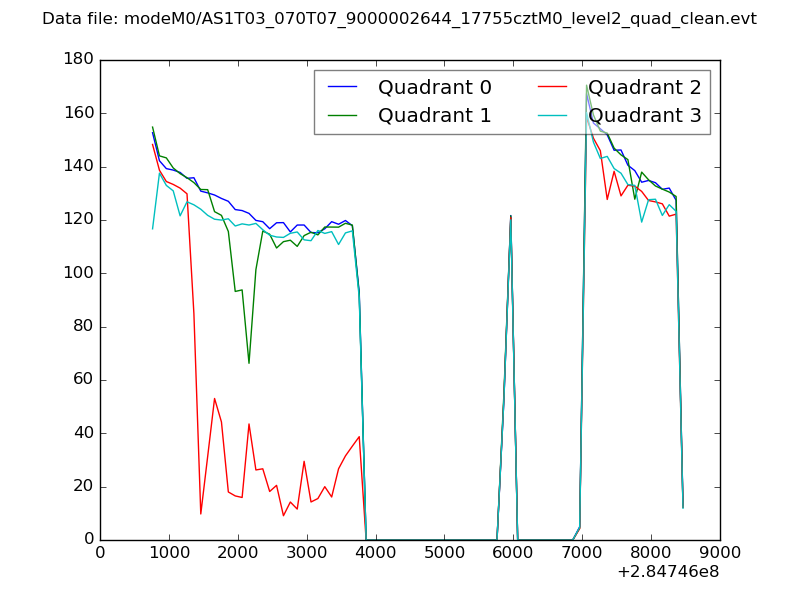
| Plot type | Count rate plots | Images |
|---|---|---|
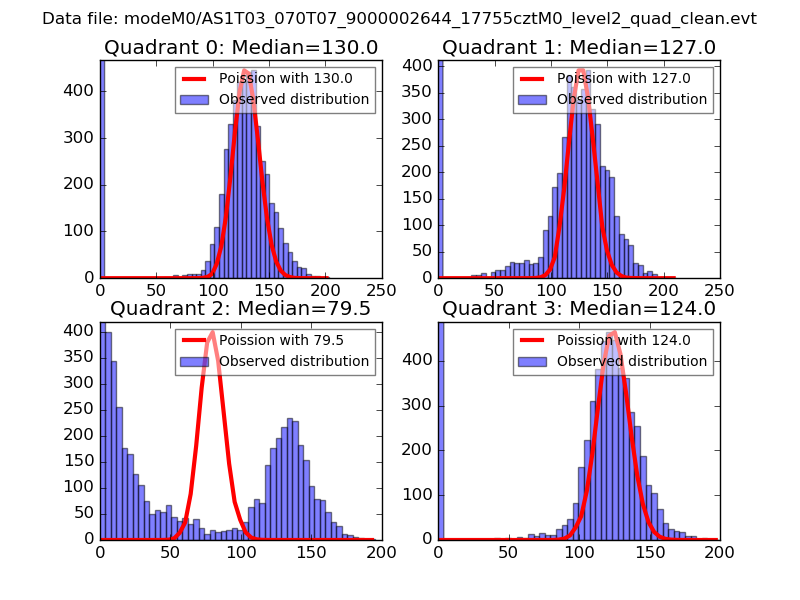
| Comparison with Poisson distribution Blue bars denote a histogram of data divided into 1 sec bins. Red curve is a Poisson curve with rate = median count rate of data. |
 |
 |
| Quadrant-wise count rates Data is divided into 100 sec bins |
 |
|
| Module-wise count rates for Quadrant A Data is divided into 100 sec bins |
 |
 |
| Module-wise count rates for Quadrant B Data is divided into 100 sec bins |
 |
 |
| Module-wise count rates for Quadrant C Data is divided into 100 sec bins |
 |
 |
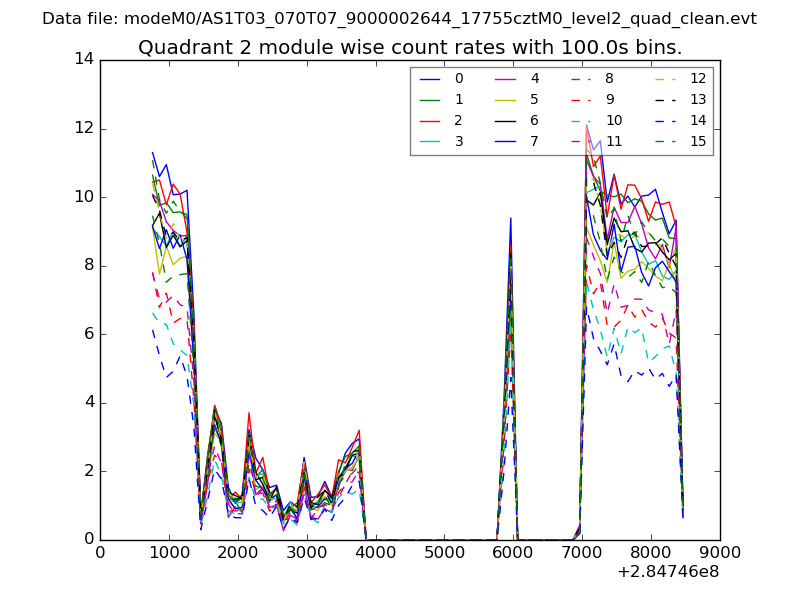
| Module-wise count rates for Quadrant D Data is divided into 100 sec bins |
 |
 |
| Parameter | Plot |
|---|---|
| CZT HV Monitor | 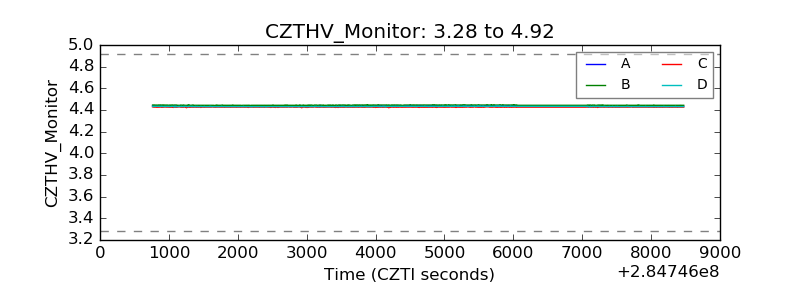 |
| D_VDD | 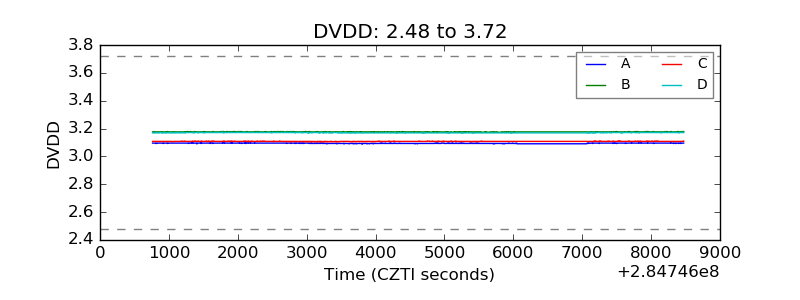 |
| Temperature 1 | 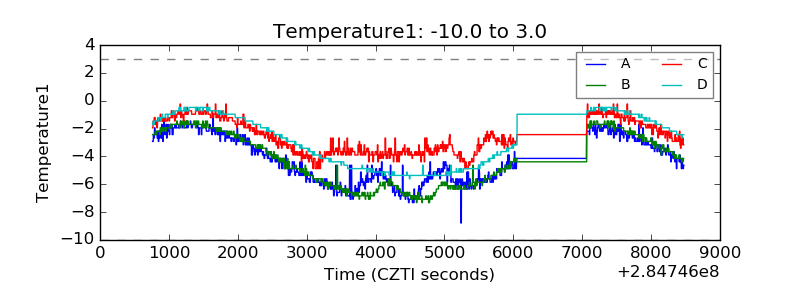 |
| Veto HV Monitor | 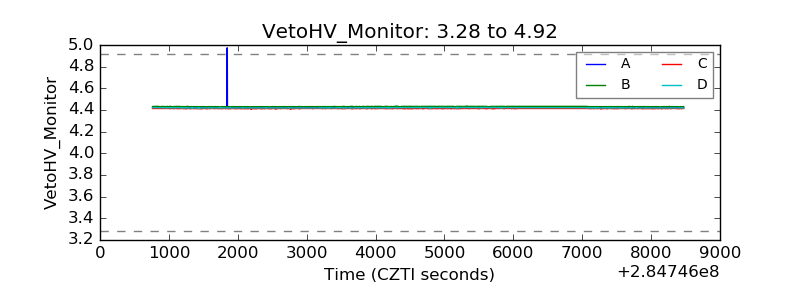 |
| Veto LLD | 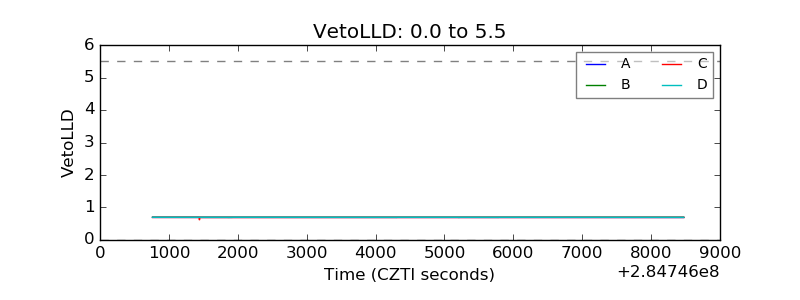 |
| Alpha Counter | 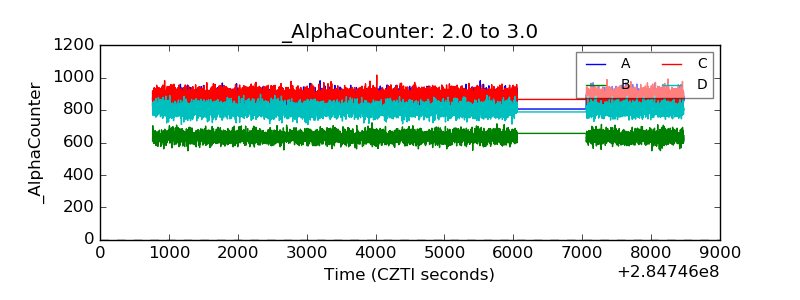 |
| _CPM_Rate |  |
| CZT Counter | 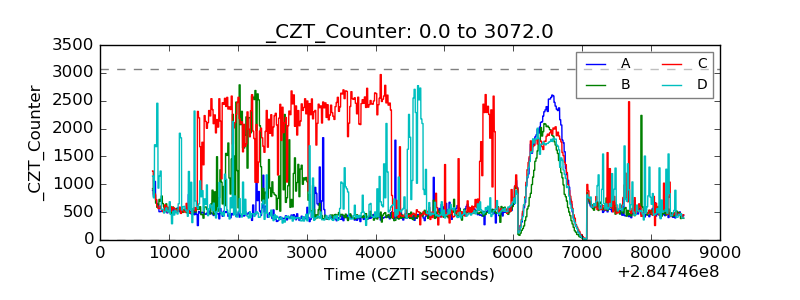 |
| +2.5 Volts monitor | 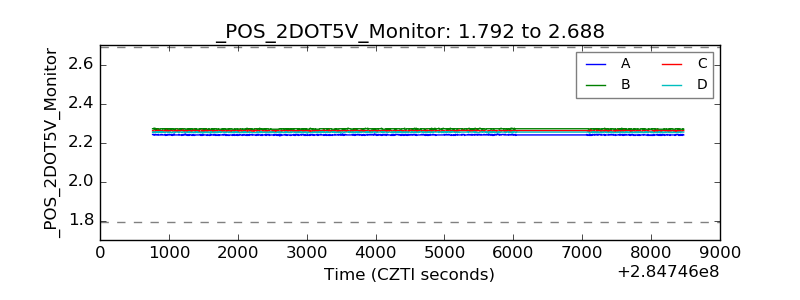 |
| +5 Volts monitor |  |
| _ROLL_ROT |  |
| _Roll_DEC | 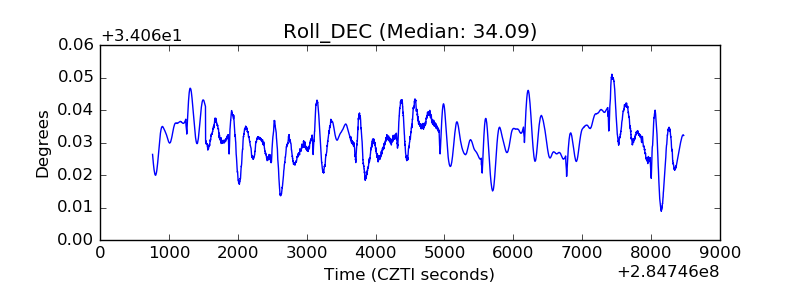 |
| _Roll_RA | 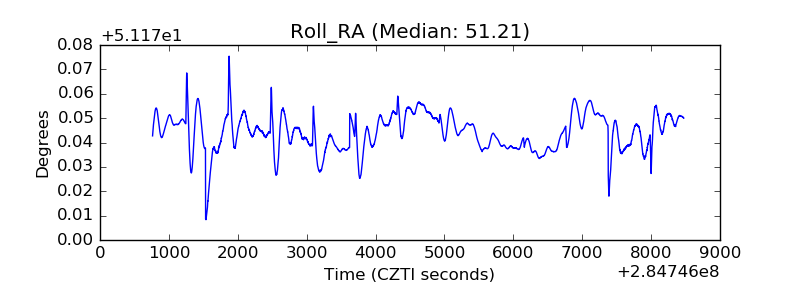 |
| Veto Counter |  |