| Param | Original file | Final file |
|---|---|---|
| Filename | modeM0/AS1T03_070T07_9000002644_17757cztM0_level2.evt | modeM0/AS1T03_070T07_9000002644_17757cztM0_level2_quad_clean.evt |
| Size (bytes) | 116,758,080 | 29,332,800 |
| Size | 111.3 MB | 28.0 MB |
| Events in quadrant A | 717,776 | 201,572 |
| Events in quadrant B | 824,476 | 201,617 |
| Events in quadrant C | 912,685 | 188,962 |
| Events in quadrant D | 982,276 | 190,361 |
| Mode M9 | |||
|---|---|---|---|
| Quadrant | BADHDUFLAG | Total packets | Discarded packets |
| A | 0 | 5 | 0 |
| B | 0 | 6 | 0 |
| C | 0 | 6 | 0 |
| D | 0 | 6 | 0 |
| Mode SS | |||
|---|---|---|---|
| Quadrant | BADHDUFLAG | Total packets | Discarded packets |
| A | 0 | 28 | 0 |
| B | 0 | 28 | 0 |
| C | 0 | 28 | 0 |
| D | 0 | 28 | 0 |
| Mode M0 | |||
|---|---|---|---|
| Quadrant | BADHDUFLAG | Total packets | Discarded packets |
| A | 0 | 3009 | 1 |
| B | 0 | 3375 | 1 |
| C | 0 | 3610 | 1 |
| D | 0 | 3886 | 1 |
| Quadrant | Total seconds | Saturated seconds | Saturation percentage |
|---|---|---|---|
| A | 1415 | 6 | 0.424028% |
| B | 1415 | 24 | 1.696113% |
| C | 1415 | 65 | 4.593640% |
| D | 1415 | 36 | 2.544170% |
Noise dominated data is calculated using 1-second bins in cleaned event files. If a bin has >2000 counts, and if more than 50% of those come from <1% of pixels, then it is considered to be noise-dominated and hence unusable.
| Quadrant | # 1 sec bins | Bins with >0 counts | Bins with >2000 counts | High rate bins dominated by noise | Noise dominated (total time) | Noise dominated (detector-on time) | Marked lightcurve |
|---|---|---|---|---|---|---|---|
| A | 1415 | 1415 | 0 | 0 | 0.00% | 0.00% | 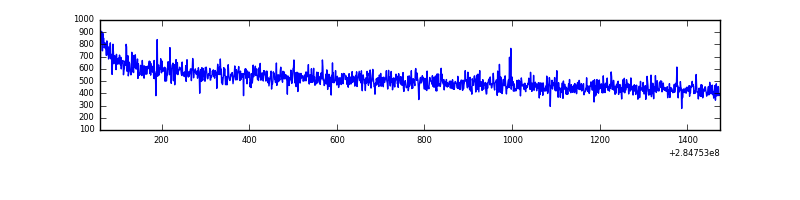 |
| B | 1415 | 1415 | 15 | 15 | 1.06% | 1.06% | 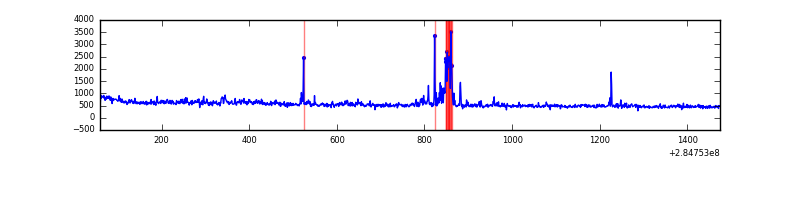 |
| C | 1415 | 1415 | 27 | 27 | 1.91% | 1.91% | 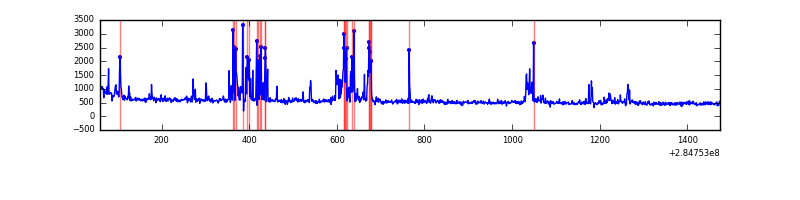 |
| D | 1415 | 1415 | 22 | 22 | 1.55% | 1.55% | 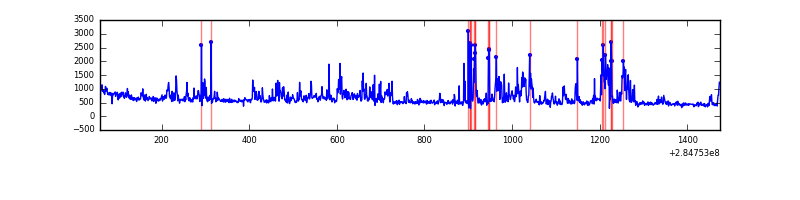 |
Top three noisy pixels from each quadrant. If the there are fewer than three noisy pixels in the level2.evt file, extra rows are filled as -1
| Pixel properties | Quadrant properties | ||||||
|---|---|---|---|---|---|---|---|
| Quadrant | DetID | PixID | Counts | Sigma | Mean | Median | Sigma |
| A | 0 | 226 | 1670 | 38.52 | 186 | 182 | 38.6 |
| A | 12 | 194 | 1481 | 33.63 | 186 | 182 | 38.6 |
| A | 3 | 137 | 1357 | 30.42 | 186 | 182 | 38.6 |
| B | 7 | 220 | 54646 | 1497.71 | 183 | 179 | 36.4 |
| B | 0 | 219 | 25754 | 703.25 | 183 | 179 | 36.4 |
| B | 0 | 229 | 6968 | 186.68 | 183 | 179 | 36.4 |
| C | 4 | 254 | 176913 | 4171.88 | 175 | 176 | 42.4 |
| C | 14 | 238 | 26910 | 631.06 | 175 | 176 | 42.4 |
| C | 5 | 218 | 10185 | 236.26 | 175 | 176 | 42.4 |
| D | 5 | 222 | 120824 | 2721.67 | 180 | 175 | 44.3 |
| D | 2 | 165 | 68661 | 1544.95 | 180 | 175 | 44.3 |
| D | 7 | 238 | 66202 | 1489.48 | 180 | 175 | 44.3 |
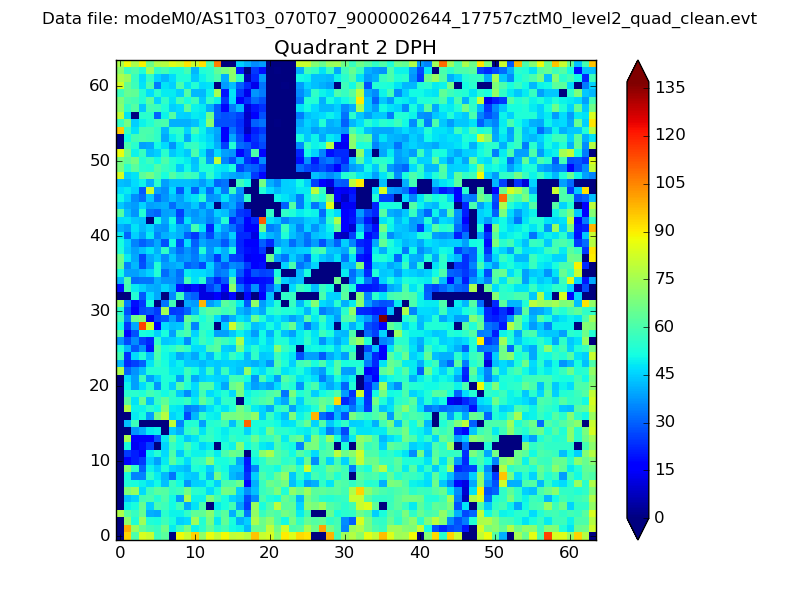
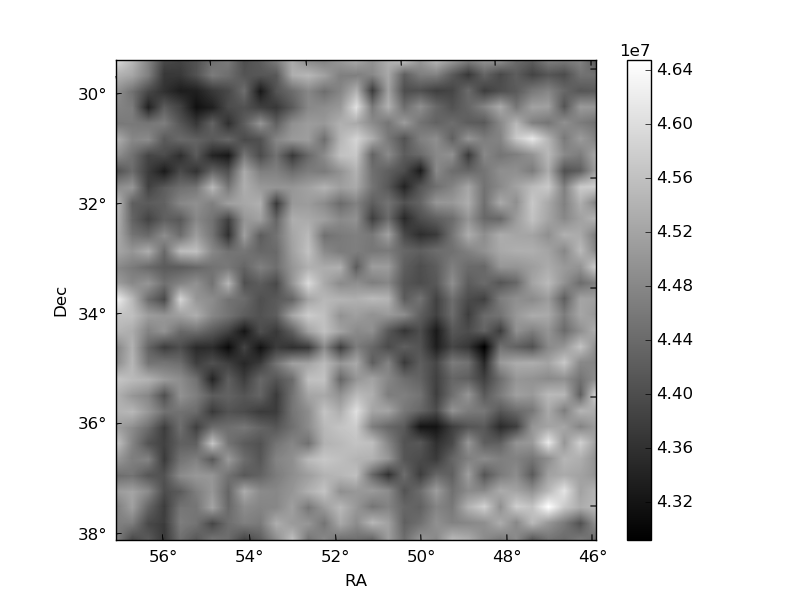
Histogram calculated using DETX and DETY for each event in the final _common_clean file
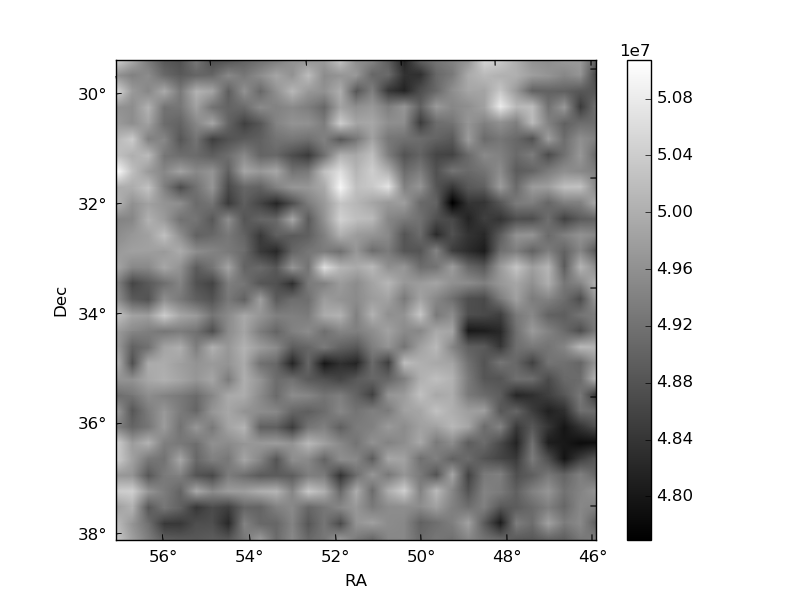
| Quadrant A | 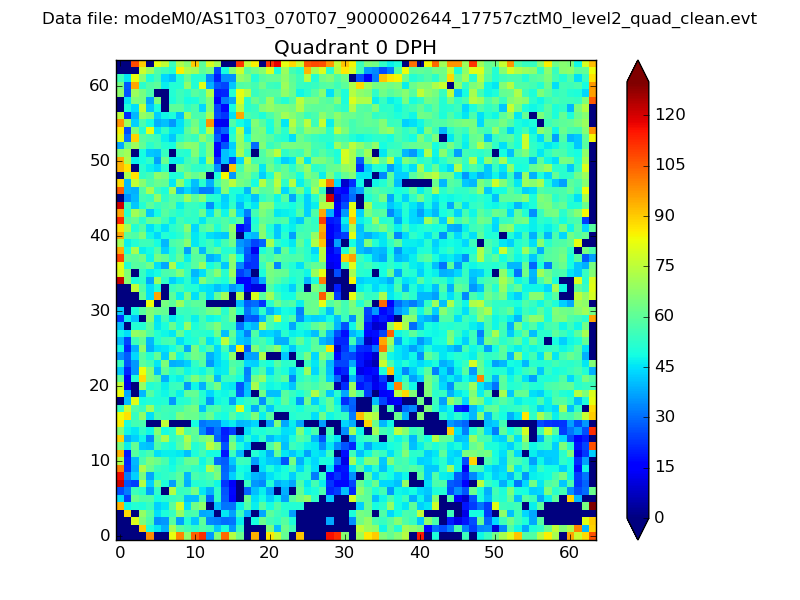 |
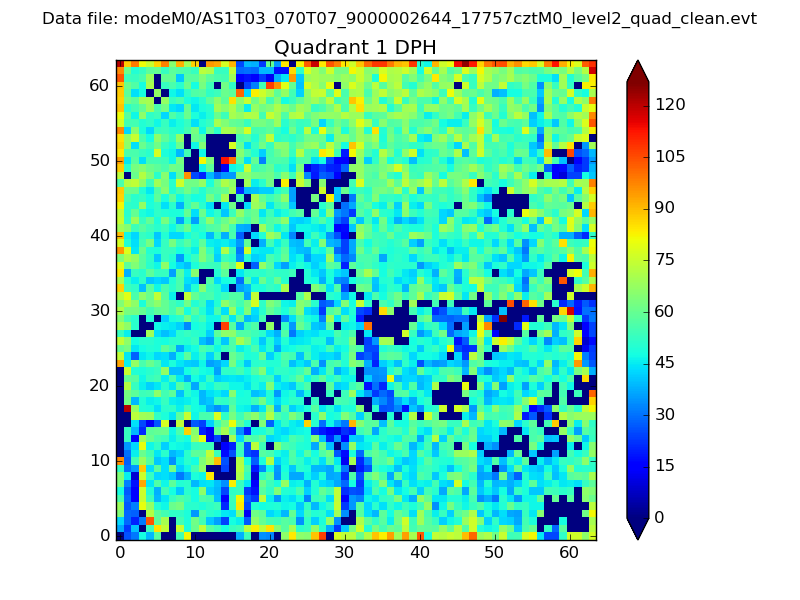 |
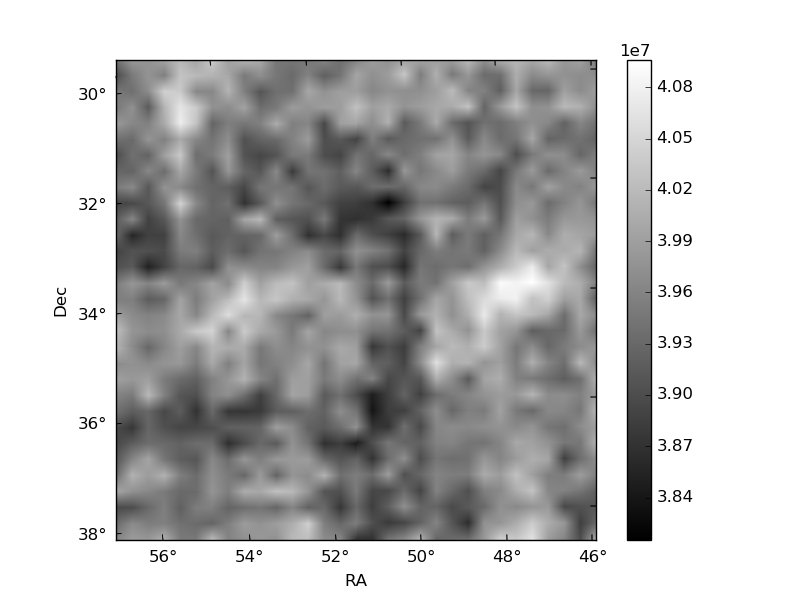
Quadrant B |
|---|---|---|---|
| Quadrant D | 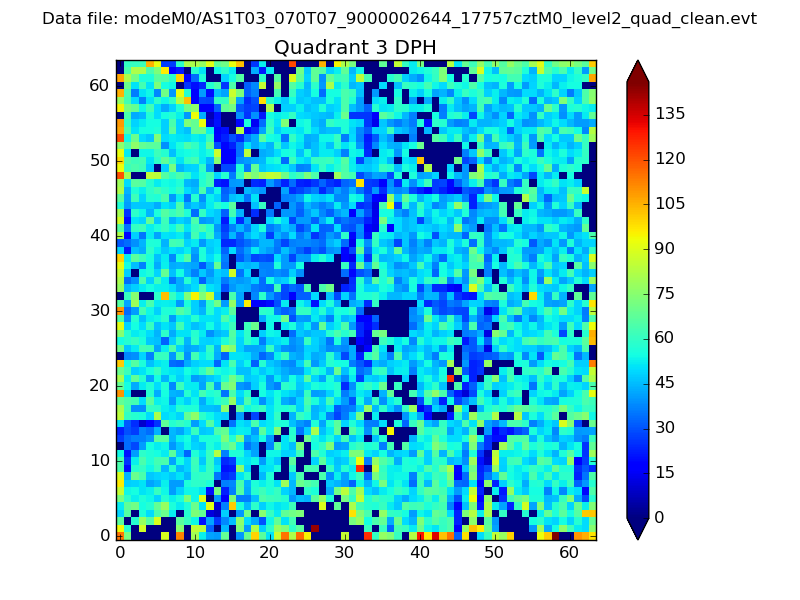 |
 |
Quadrant C |
| Plot type | Count rate plots | Images |
|---|---|---|
| Comparison with Poisson distribution Blue bars denote a histogram of data divided into 1 sec bins. Red curve is a Poisson curve with rate = median count rate of data. |
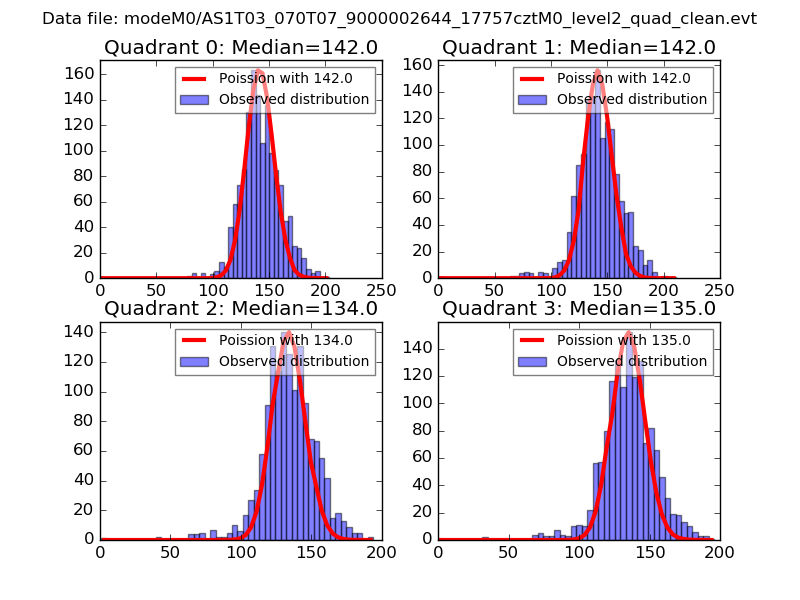 |
 |
| Quadrant-wise count rates Data is divided into 100 sec bins |
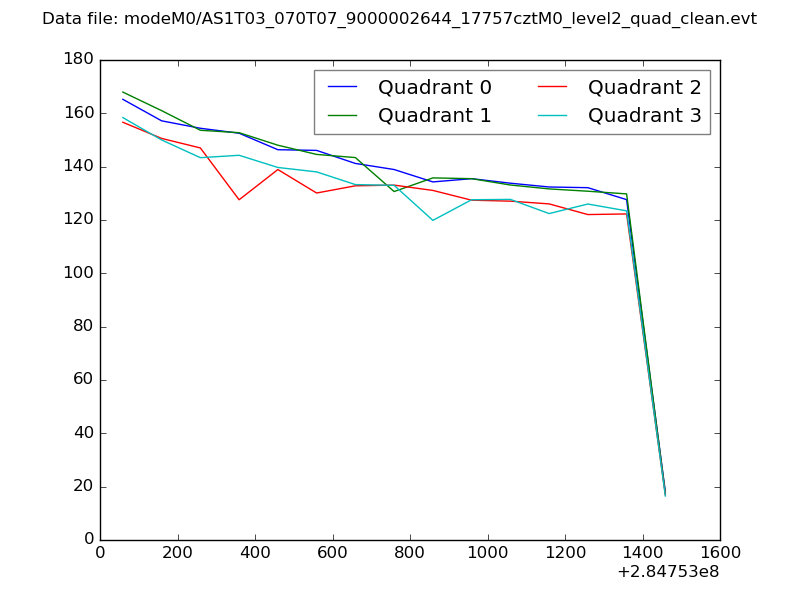 |
|
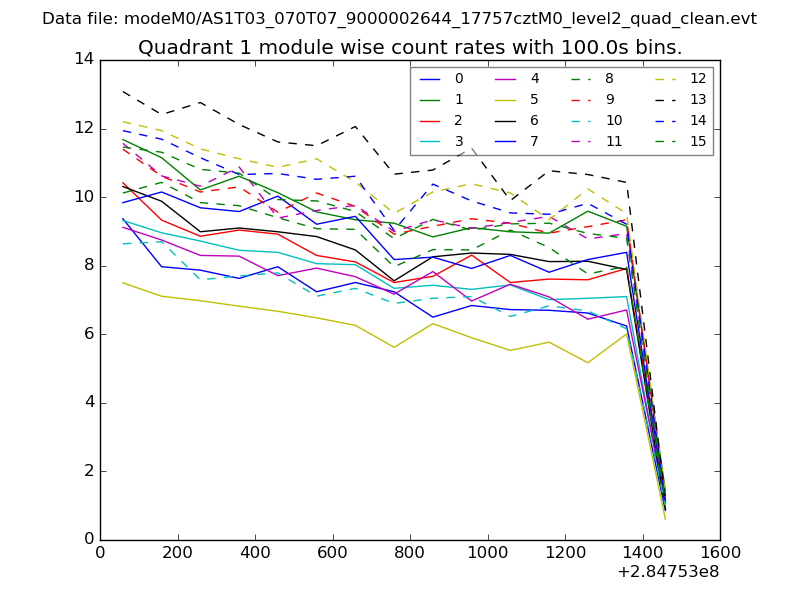
| Module-wise count rates for Quadrant A Data is divided into 100 sec bins |
 |
 |
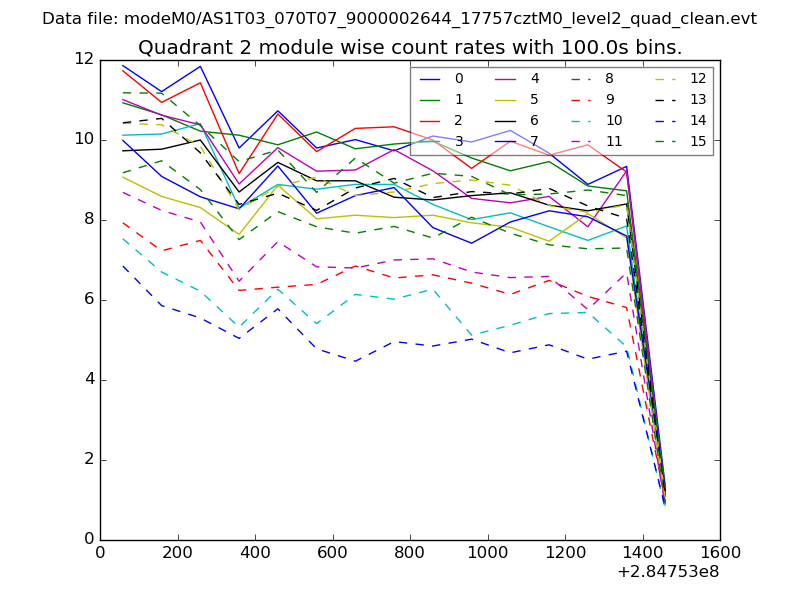
| Module-wise count rates for Quadrant B Data is divided into 100 sec bins |
 |
 |
| Module-wise count rates for Quadrant C Data is divided into 100 sec bins |
 |
 |
| Module-wise count rates for Quadrant D Data is divided into 100 sec bins |
 |
 |
| Parameter | Plot |
|---|---|
| CZT HV Monitor |  |
| D_VDD |  |
| Temperature 1 | 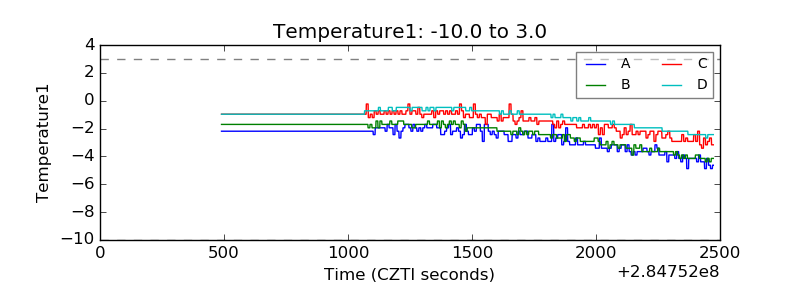 |
| Veto HV Monitor | 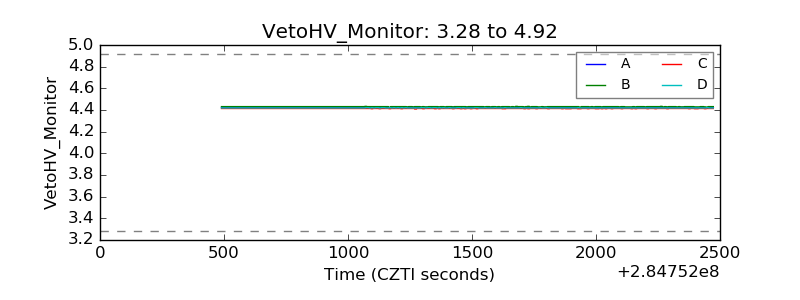 |
| Veto LLD |  |
| Alpha Counter | 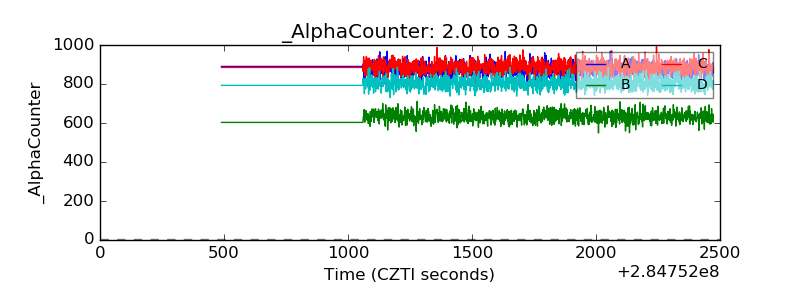 |
| _CPM_Rate | 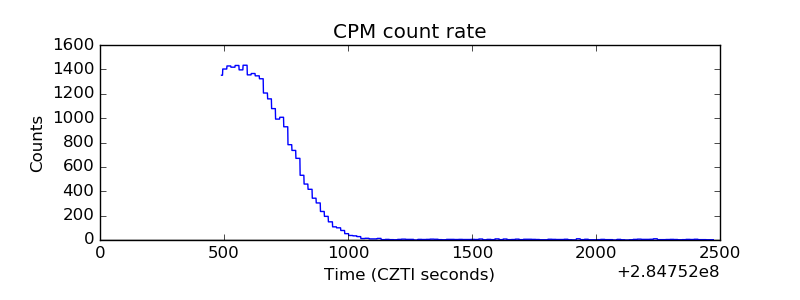 |
| CZT Counter | 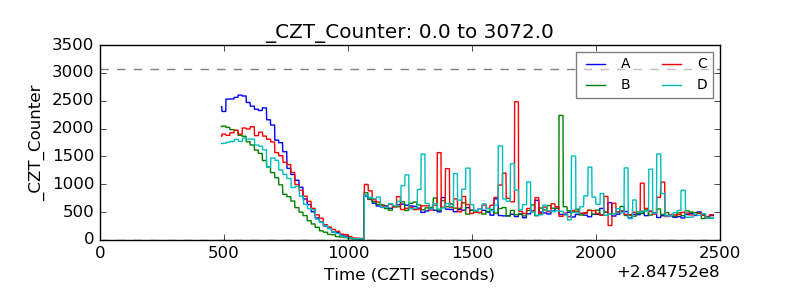 |
| +2.5 Volts monitor |  |
| +5 Volts monitor |  |
| _ROLL_ROT |  |
| _Roll_DEC | 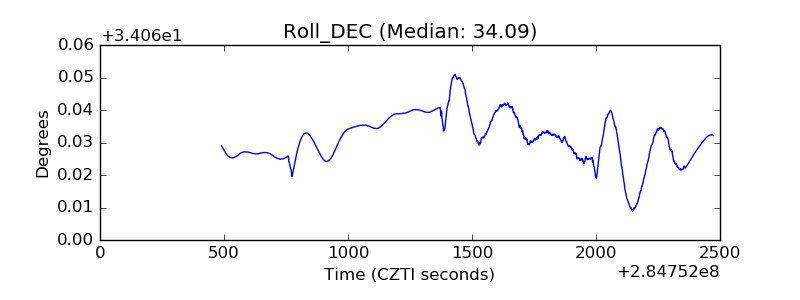 |
| _Roll_RA | 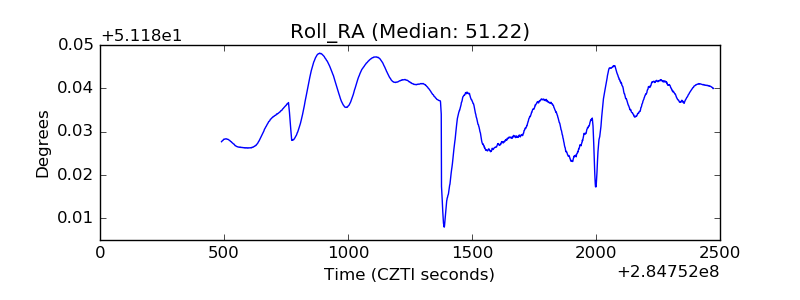 |
| Veto Counter | 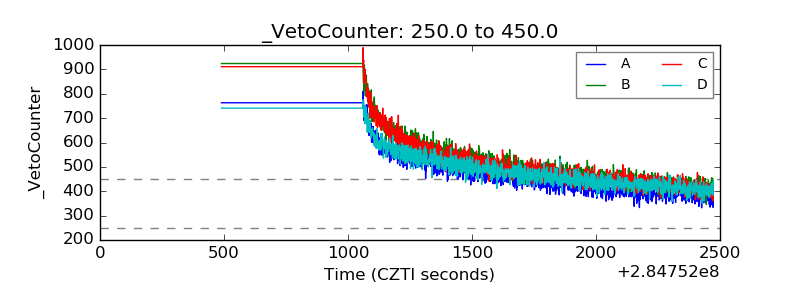 |