| Param | Original file | Final file |
|---|---|---|
| Filename | modeM0/AS1T03_070T08_9000002646cztM0_level2.fits | modeM0/AS1T03_070T08_9000002646cztM0_level2_quad_clean.evt |
| Size (bytes) | 191,623,680 | 92,462,400 |
| Size | 182.7 MB | 88.2 MB |
| Events in quadrant A | 1,188,540 | 387,433 |
| Events in quadrant B | 1,154,830 | 393,795 |
| Events in quadrant C | 1,149,030 | 370,614 |
| Events in quadrant D | 1,007,058 | 342,028 |
| Mode SS | |||
|---|---|---|---|
| Quadrant | BADHDUFLAG | Total packets | Discarded packets |
| A | 0 | 388 | 0 |
| B | 0 | 388 | 0 |
| C | 0 | 388 | 0 |
| D | 0 | 388 | 0 |
| Mode M9 | |||
|---|---|---|---|
| Quadrant | BADHDUFLAG | Total packets | Discarded packets |
| A | 0 | 50 | 0 |
| B | 0 | 50 | 0 |
| C | 0 | 50 | 0 |
| D | 0 | 50 | 0 |
| Mode M0 | |||
|---|---|---|---|
| Quadrant | BADHDUFLAG | Total packets | Discarded packets |
| A | 0 | 39984 | 0 |
| B | 0 | 40995 | 0 |
| C | 0 | 43377 | 0 |
| D | 0 | 43201 | 0 |
| Quadrant | Total seconds | Saturated seconds | Saturation percentage |
|---|---|---|---|
| A | 18922 | 229 | 1.210231% |
| B | 18922 | 234 | 1.236656% |
| C | 18922 | 546 | 2.885530% |
| D | 18922 | 332 | 1.754571% |
Noise dominated data is calculated using 1-second bins in cleaned event files. If a bin has >2000 counts, and if more than 50% of those come from <1% of pixels, then it is considered to be noise-dominated and hence unusable.
| Quadrant | # 1 sec bins | Bins with >0 counts | Bins with >2000 counts | High rate bins dominated by noise | Noise dominated (total time) | Noise dominated (detector-on time) | Marked lightcurve |
|---|---|---|---|---|---|---|---|
| A | 24007 | 18921 | 0 | 0 | 0.00% | 0.00% |  |
| B | 24007 | 18921 | 0 | 0 | 0.00% | 0.00% | 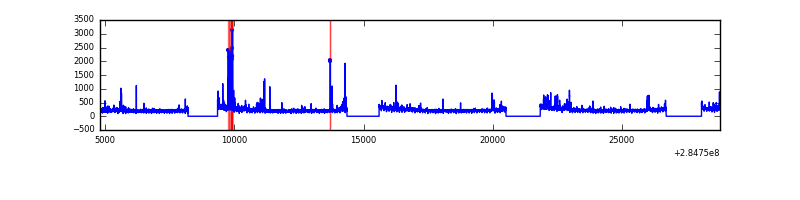 |
| C | 24007 | 18917 | 0 | 0 | 0.00% | 0.00% | 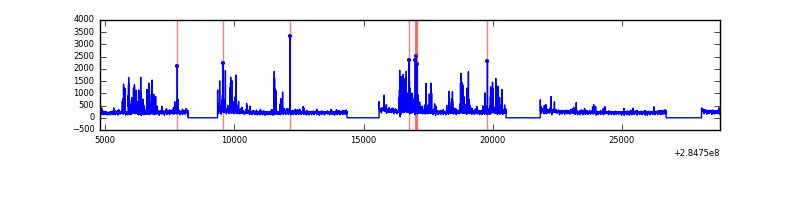 |
| D | 24007 | 18913 | 0 | 0 | 0.00% | 0.00% |  |
Top three noisy pixels from each quadrant. If the there are fewer than three noisy pixels in the level2.evt file, extra rows are filled as -1
| Pixel properties | Quadrant properties | ||||||
|---|---|---|---|---|---|---|---|
| Quadrant | DetID | PixID | Counts | Sigma | Mean | Median | Sigma |
| A | 0 | 29 | 1118 | 10.68 | 309 | 292 | 77.3 |
| A | 7 | 110 | 934 | 8.3 | 309 | 292 | 77.3 |
| A | 9 | 19 | 903 | 7.9 | 309 | 292 | 77.3 |
| B | 2 | 9 | 900 | 10.09 | 305 | 293 | 60.1 |
| B | 5 | 128 | 787 | 8.21 | 305 | 293 | 60.1 |
| B | 3 | 17 | 786 | 8.2 | 305 | 293 | 60.1 |
| C | 1 | 81 | 880 | 7.51 | 303 | 285 | 79.3 |
| C | 1 | 80 | 854 | 7.18 | 303 | 285 | 79.3 |
| C | 12 | 241 | 811 | 6.64 | 303 | 285 | 79.3 |
| D | 7 | 3 | 732 | 6.06 | 286 | 260 | 77.8 |
| D | 1 | 19 | 728 | 6.01 | 286 | 260 | 77.8 |
| D | 3 | 14 | 720 | 5.91 | 286 | 260 | 77.8 |
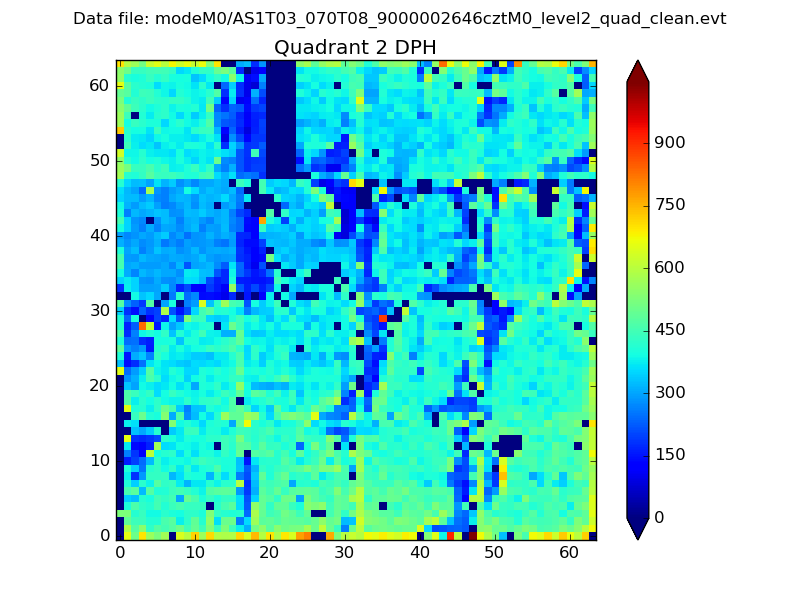
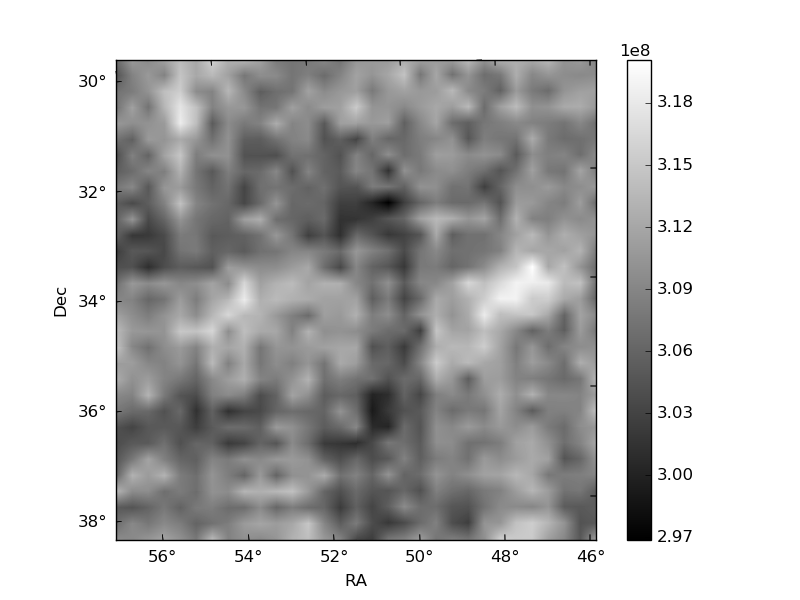
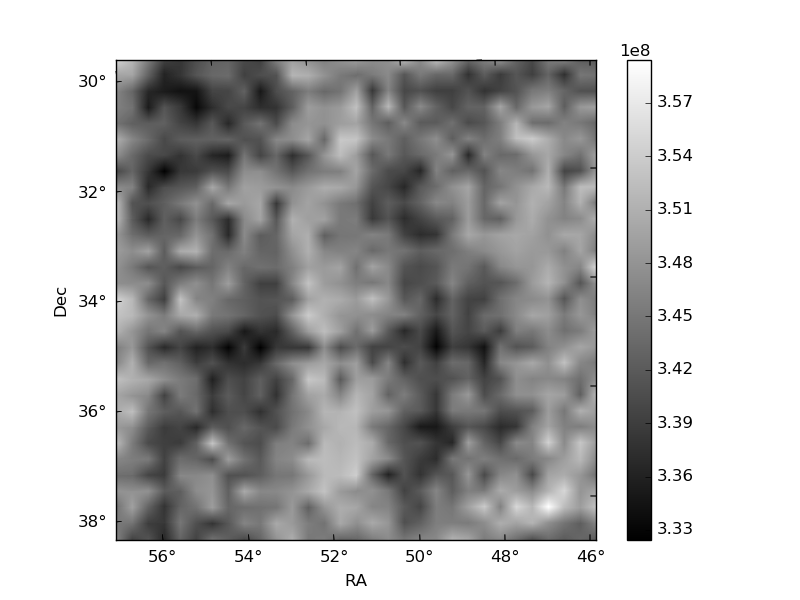
Histogram calculated using DETX and DETY for each event in the final _common_clean file
| Quadrant A | 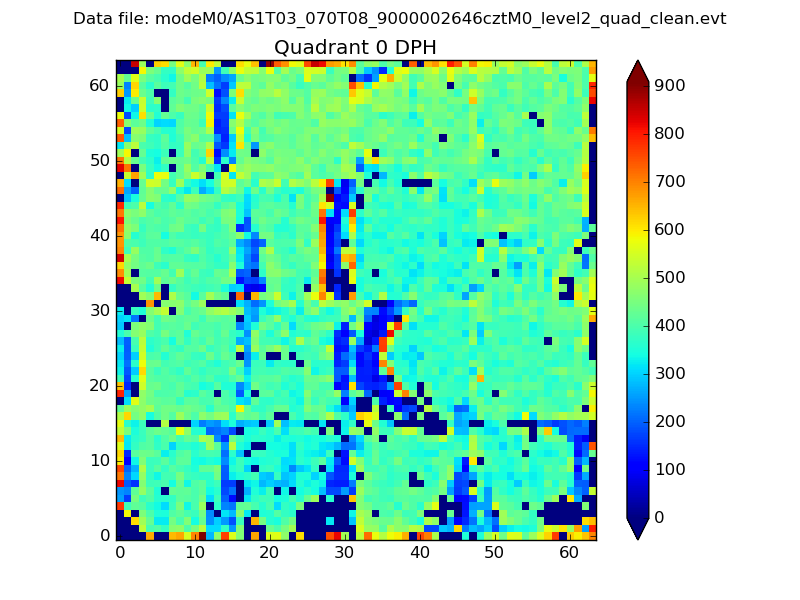 |
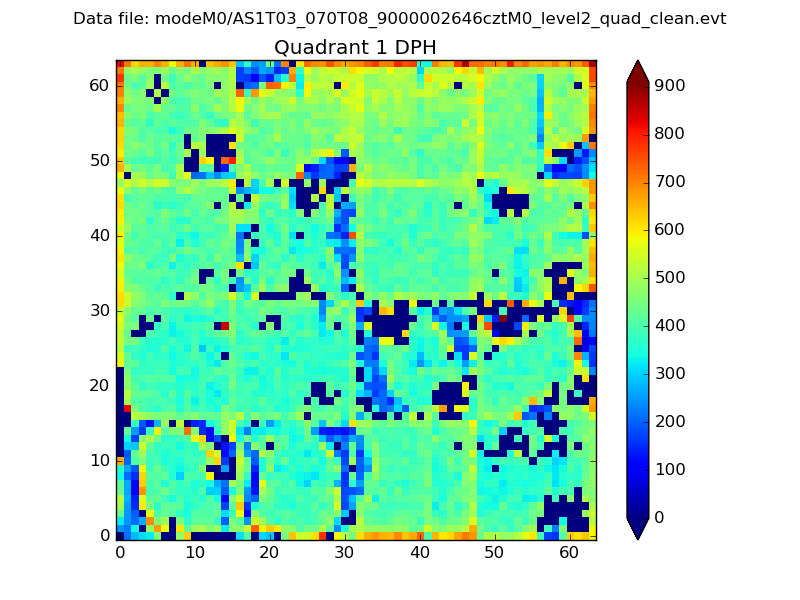 |
Quadrant B |
|---|---|---|---|
| Quadrant D | 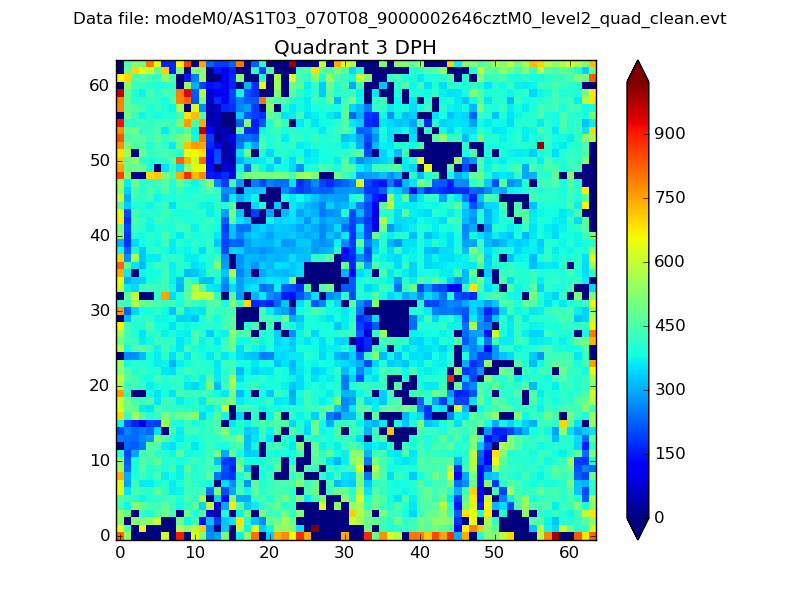 |
 |
Quadrant C |
| Plot type | Count rate plots | Images |
|---|---|---|
| Comparison with Poisson distribution Blue bars denote a histogram of data divided into 1 sec bins. Red curve is a Poisson curve with rate = median count rate of data. |
 |
 |
| Quadrant-wise count rates Data is divided into 100 sec bins |
 |
|
| Module-wise count rates for Quadrant A Data is divided into 100 sec bins |
 |
 |
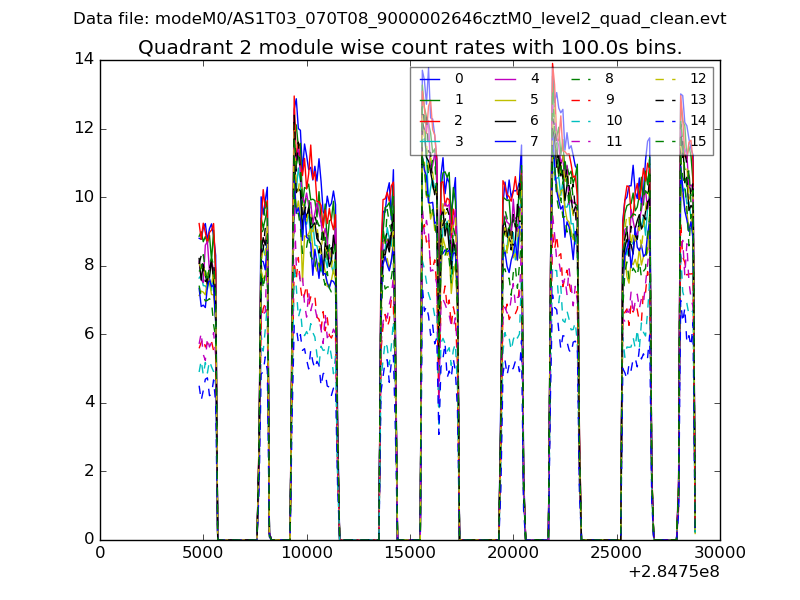
| Module-wise count rates for Quadrant B Data is divided into 100 sec bins |
 |
 |
| Module-wise count rates for Quadrant C Data is divided into 100 sec bins |
 |
 |
| Module-wise count rates for Quadrant D Data is divided into 100 sec bins |
 |
 |
| Parameter | Plot |
|---|---|
| CZT HV Monitor |  |
| D_VDD | 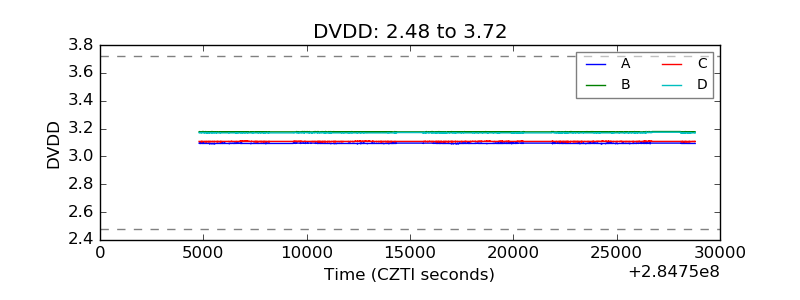 |
| Temperature 1 | 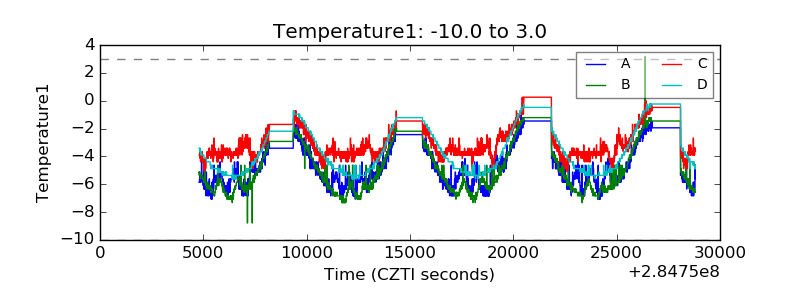 |
| Veto HV Monitor | 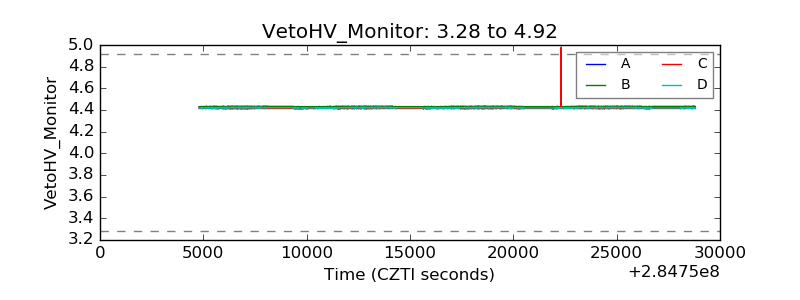 |
| Veto LLD | 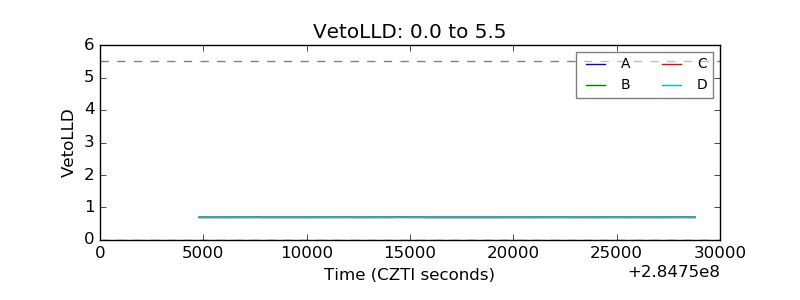 |
| Alpha Counter | 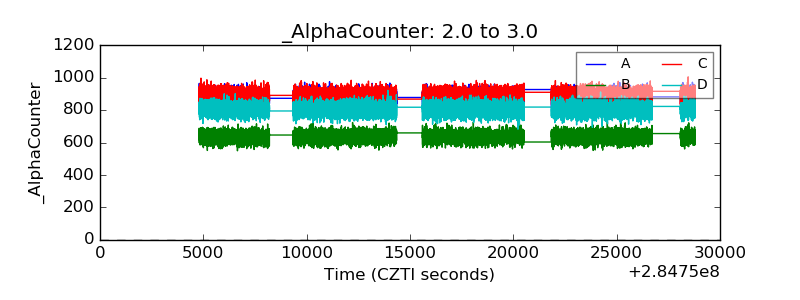 |
| _CPM_Rate |  |
| CZT Counter |  |
| +2.5 Volts monitor |  |
| +5 Volts monitor | 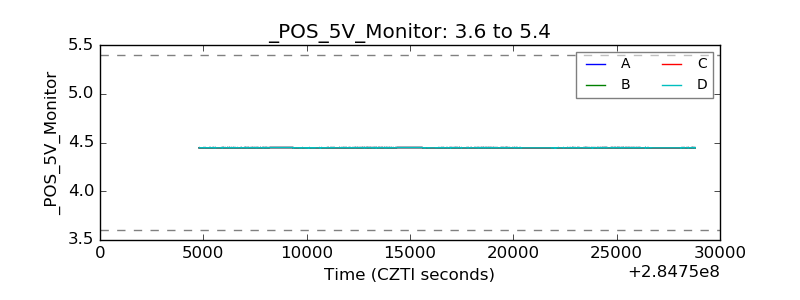 |
| _ROLL_ROT |  |
| _Roll_DEC | 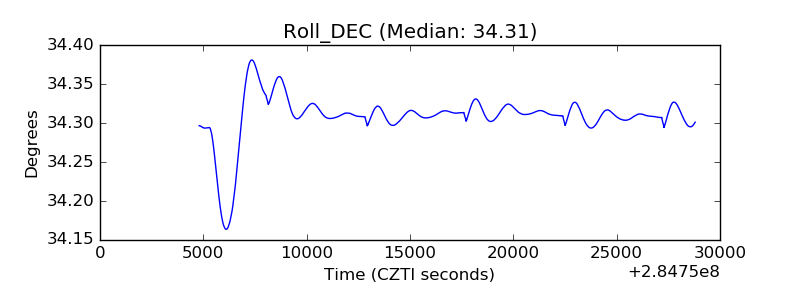 |
| _Roll_RA | 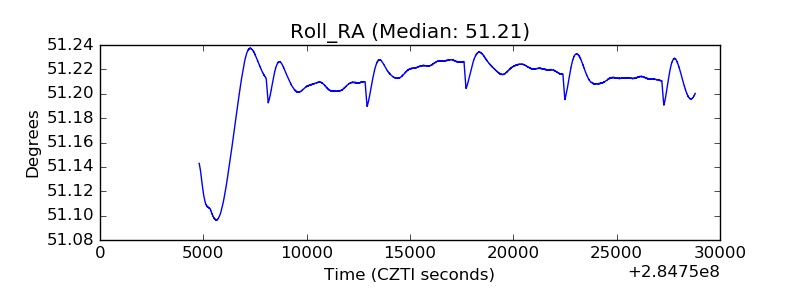 |
| Veto Counter | 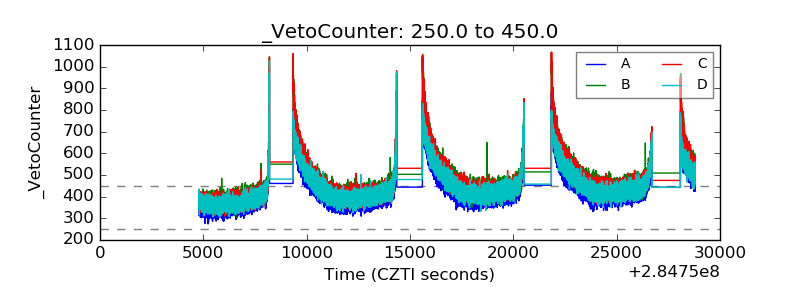 |