| Param | Original file | Final file |
|---|---|---|
| Filename | modeM0/AS1T03_070T08_9000002646_17757cztM0_level2.evt | modeM0/AS1T03_070T08_9000002646_17757cztM0_level2_quad_clean.evt |
| Size (bytes) | 343,126,080 | 56,070,720 |
| Size | 327.2 MB | 53.5 MB |
| Events in quadrant A | 2,138,120 | 351,868 |
| Events in quadrant B | 2,401,851 | 355,272 |
| Events in quadrant C | 2,628,795 | 337,545 |
| Events in quadrant D | 2,908,288 | 328,841 |
| Mode SS | |||
|---|---|---|---|
| Quadrant | BADHDUFLAG | Total packets | Discarded packets |
| A | 0 | 94 | 0 |
| B | 0 | 94 | 0 |
| C | 0 | 94 | 0 |
| D | 0 | 94 | 0 |
| Mode M9 | |||
|---|---|---|---|
| Quadrant | BADHDUFLAG | Total packets | Discarded packets |
| A | 0 | 11 | 0 |
| B | 0 | 11 | 0 |
| C | 0 | 11 | 0 |
| D | 0 | 11 | 0 |
| Mode M0 | |||
|---|---|---|---|
| Quadrant | BADHDUFLAG | Total packets | Discarded packets |
| A | 0 | 9564 | 1 |
| B | 0 | 10237 | 1 |
| C | 0 | 10785 | 1 |
| D | 0 | 11980 | 1 |
| Quadrant | Total seconds | Saturated seconds | Saturation percentage |
|---|---|---|---|
| A | 4613 | 34 | 0.737047% |
| B | 4613 | 93 | 2.016042% |
| C | 4613 | 138 | 2.991546% |
| D | 4613 | 188 | 4.075439% |
Noise dominated data is calculated using 1-second bins in cleaned event files. If a bin has >2000 counts, and if more than 50% of those come from <1% of pixels, then it is considered to be noise-dominated and hence unusable.
| Quadrant | # 1 sec bins | Bins with >0 counts | Bins with >2000 counts | High rate bins dominated by noise | Noise dominated (total time) | Noise dominated (detector-on time) | Marked lightcurve |
|---|---|---|---|---|---|---|---|
| A | 5758 | 4613 | 0 | 0 | 0.00% | 0.00% | 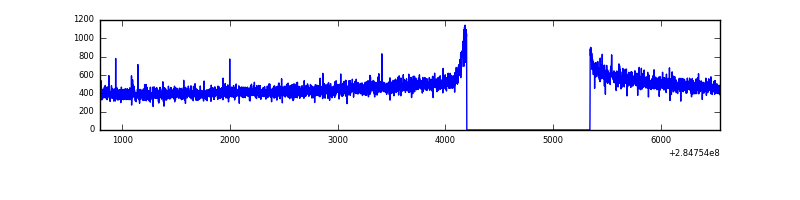 |
| B | 5758 | 4614 | 35 | 35 | 0.61% | 0.76% | 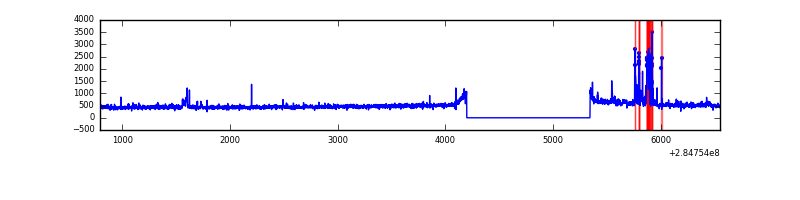 |
| C | 5758 | 4613 | 50 | 50 | 0.87% | 1.08% | 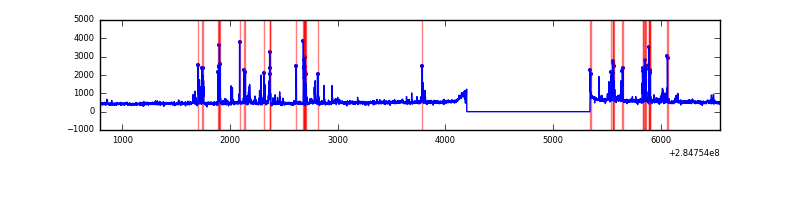 |
| D | 5758 | 4613 | 115 | 115 | 2.00% | 2.49% |  |
Top three noisy pixels from each quadrant. If the there are fewer than three noisy pixels in the level2.evt file, extra rows are filled as -1
| Pixel properties | Quadrant properties | ||||||
|---|---|---|---|---|---|---|---|
| Quadrant | DetID | PixID | Counts | Sigma | Mean | Median | Sigma |
| A | 0 | 226 | 4851 | 38.56 | 554 | 542 | 111.7 |
| A | 3 | 137 | 4134 | 32.15 | 554 | 542 | 111.7 |
| A | 12 | 194 | 4067 | 31.55 | 554 | 542 | 111.7 |
| B | 4 | 142 | 141059 | 1330.37 | 555 | 540 | 105.6 |
| B | 10 | 245 | 33685 | 313.8 | 555 | 540 | 105.6 |
| B | 0 | 219 | 31658 | 294.61 | 555 | 540 | 105.6 |
| C | 4 | 254 | 364718 | 2889.88 | 532 | 538 | 126.0 |
| C | 14 | 238 | 81124 | 639.47 | 532 | 538 | 126.0 |
| C | 3 | 233 | 71477 | 562.92 | 532 | 538 | 126.0 |
| D | 7 | 238 | 731392 | 5693.99 | 531 | 520 | 128.4 |
| D | 5 | 222 | 109911 | 852.23 | 531 | 520 | 128.4 |
| D | 10 | 70 | 20494 | 155.61 | 531 | 520 | 128.4 |
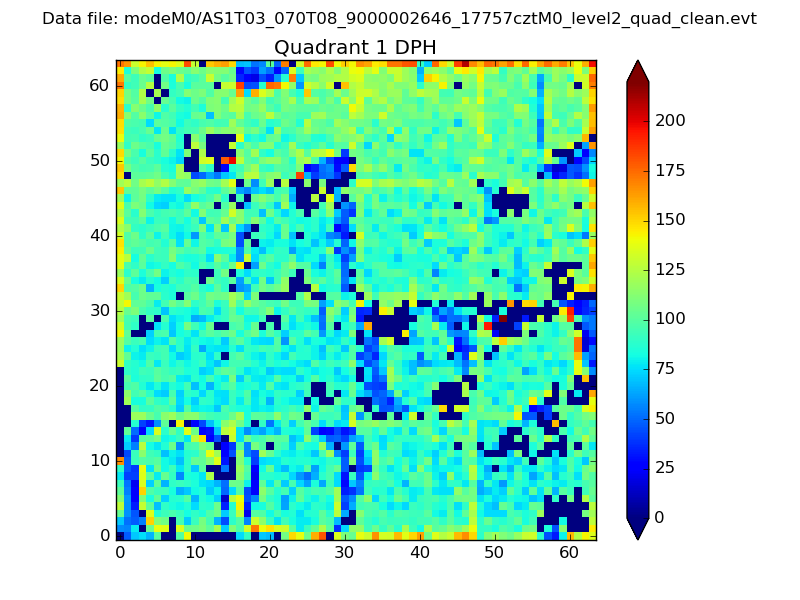
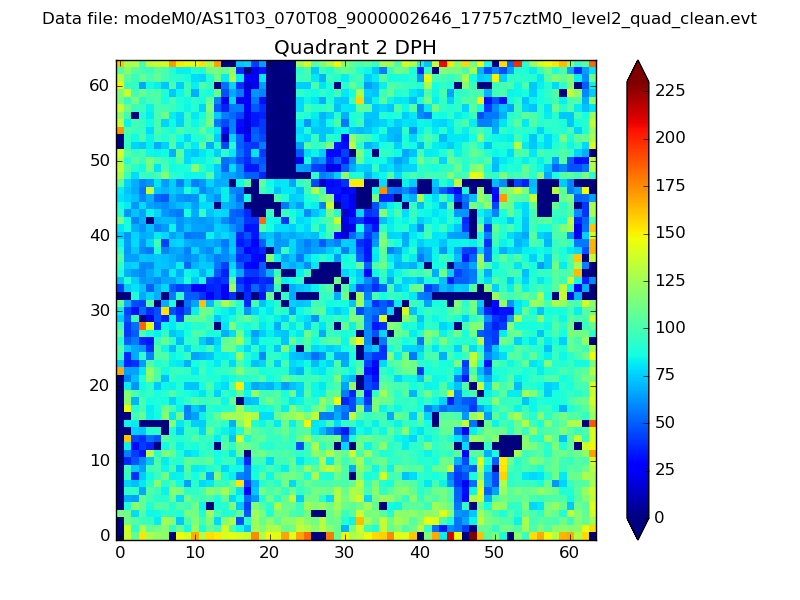
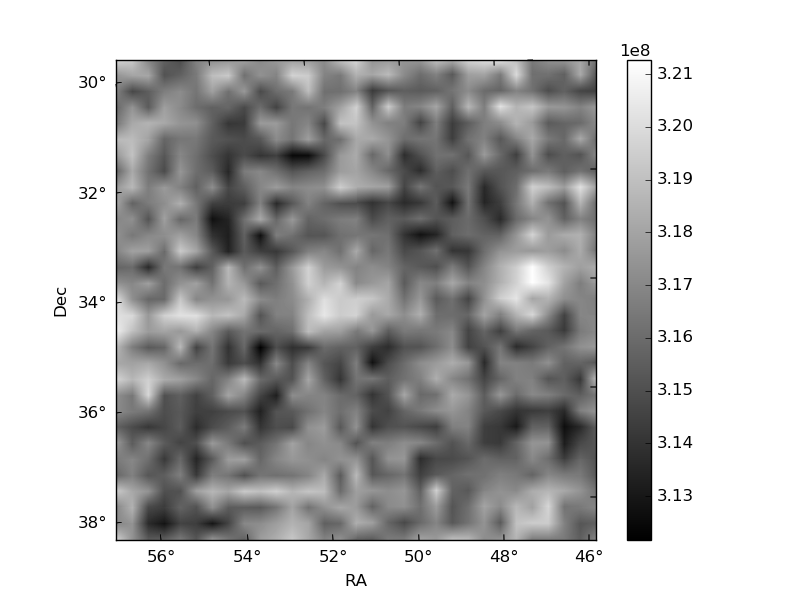
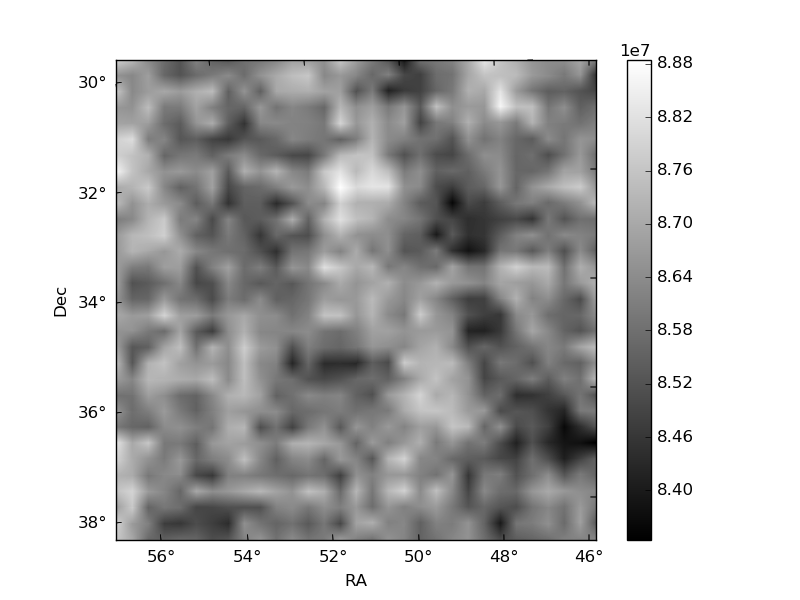
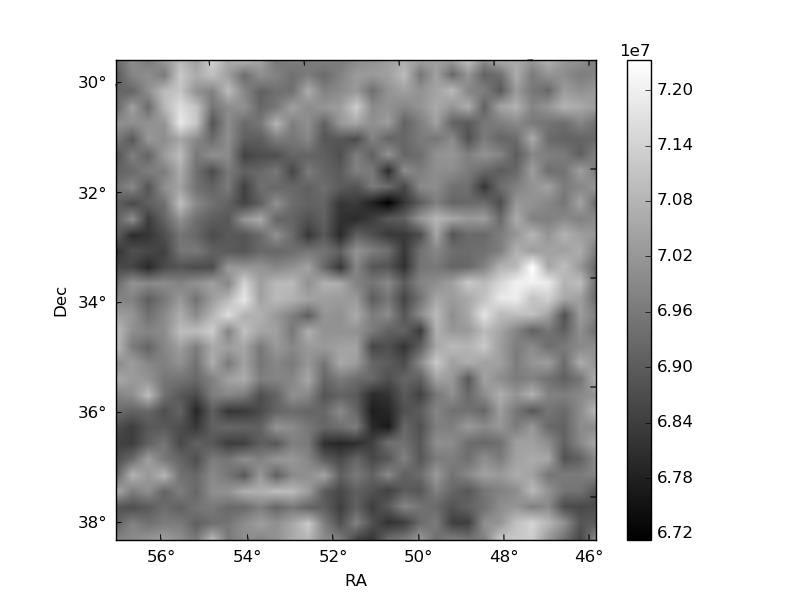
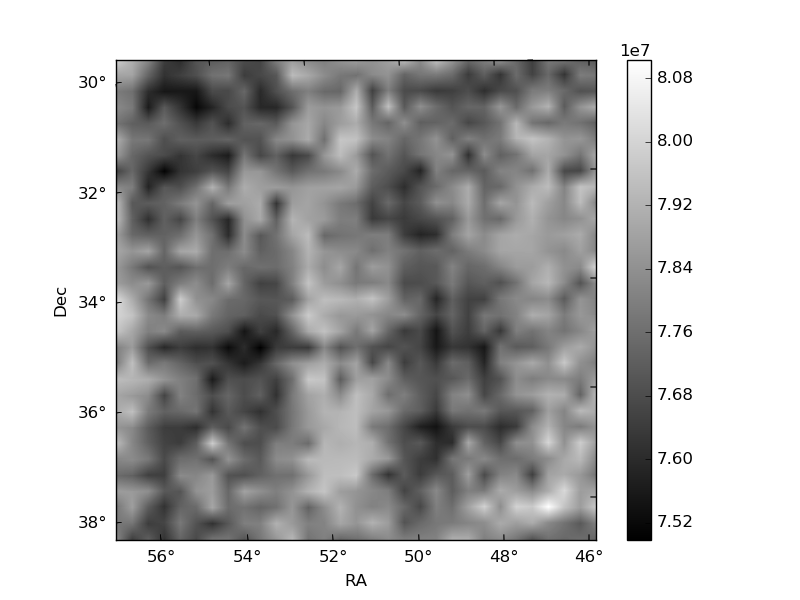
Histogram calculated using DETX and DETY for each event in the final _common_clean file
| Quadrant A | 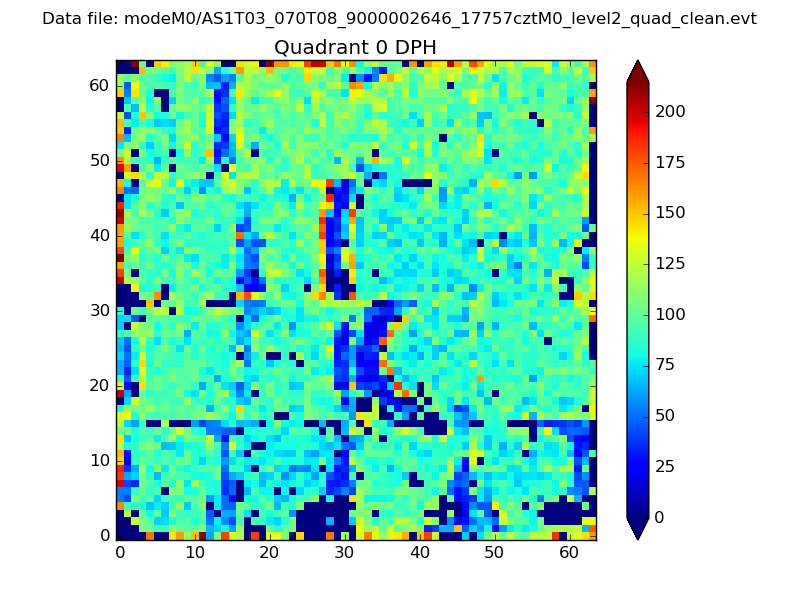 |
 |
Quadrant B |
|---|---|---|---|
| Quadrant D | 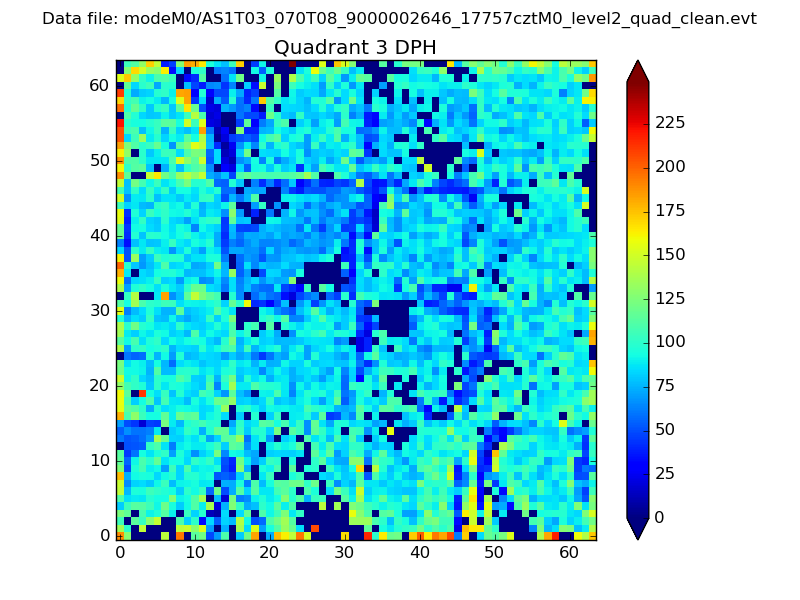 |
 |
Quadrant C |
| Plot type | Count rate plots | Images |
|---|---|---|
| Comparison with Poisson distribution Blue bars denote a histogram of data divided into 1 sec bins. Red curve is a Poisson curve with rate = median count rate of data. |
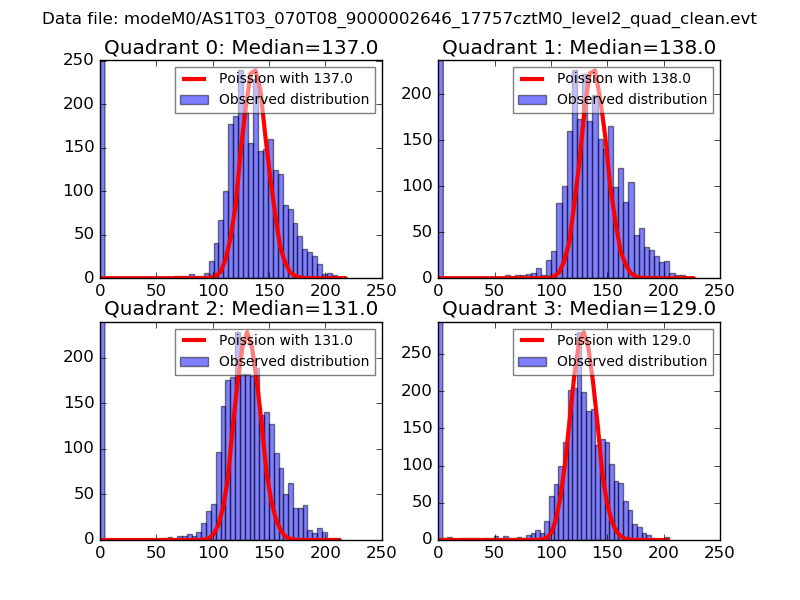 |
 |
| Quadrant-wise count rates Data is divided into 100 sec bins |
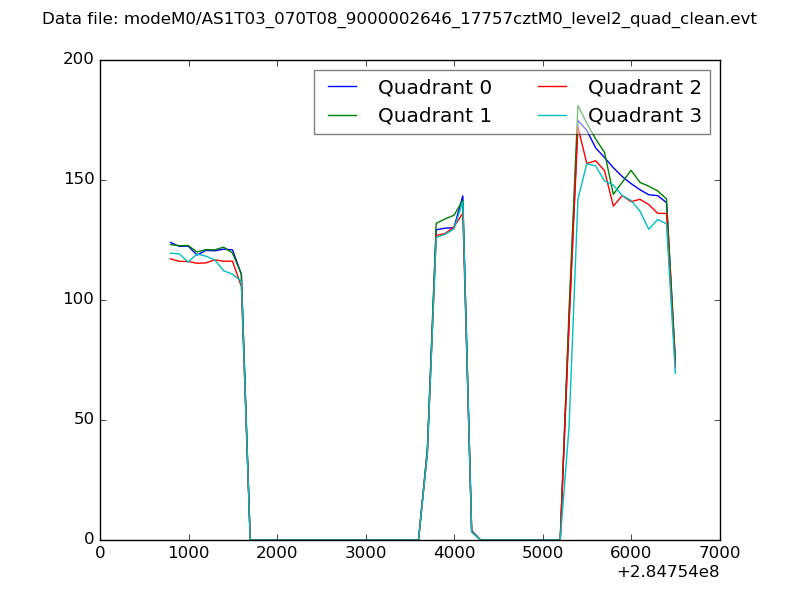 |
|
| Module-wise count rates for Quadrant A Data is divided into 100 sec bins |
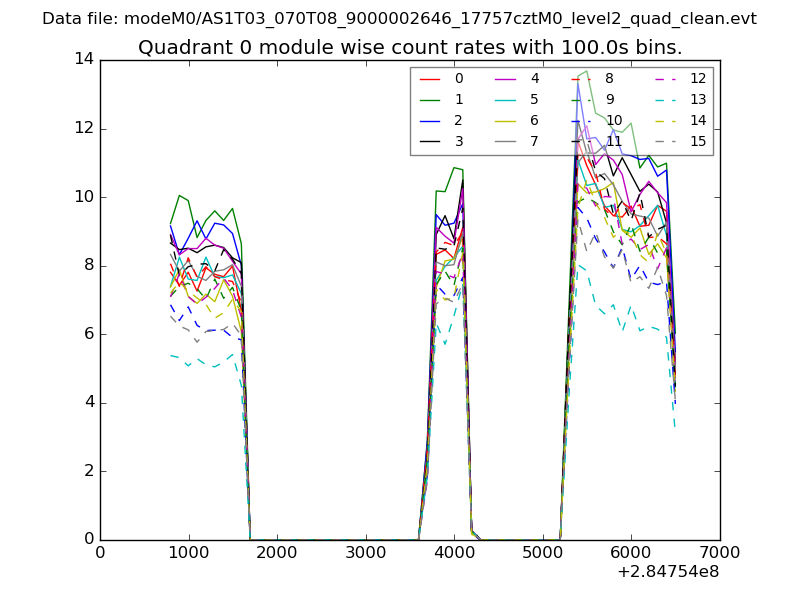 |
 |
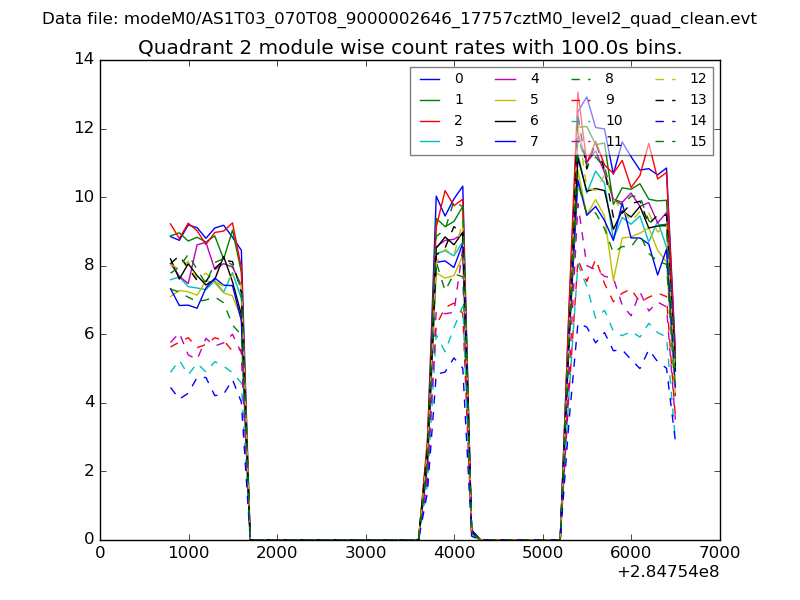
| Module-wise count rates for Quadrant B Data is divided into 100 sec bins |
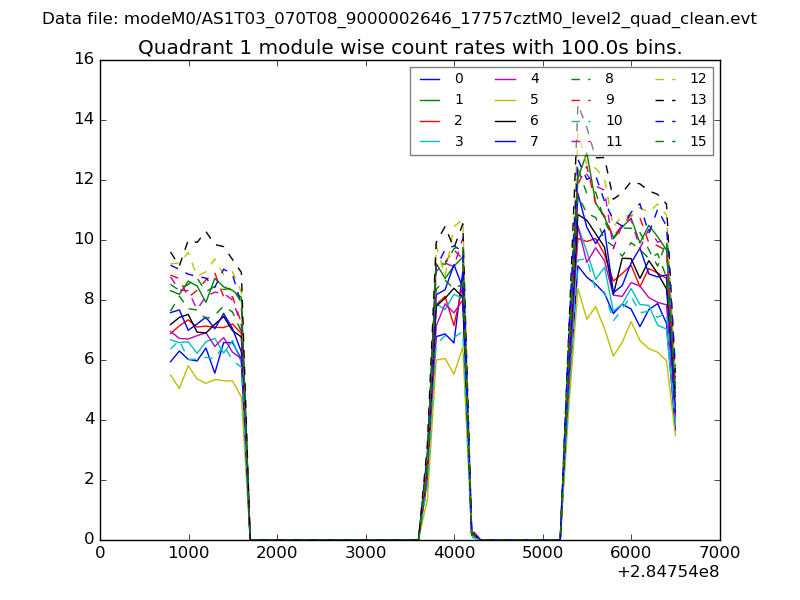 |
 |
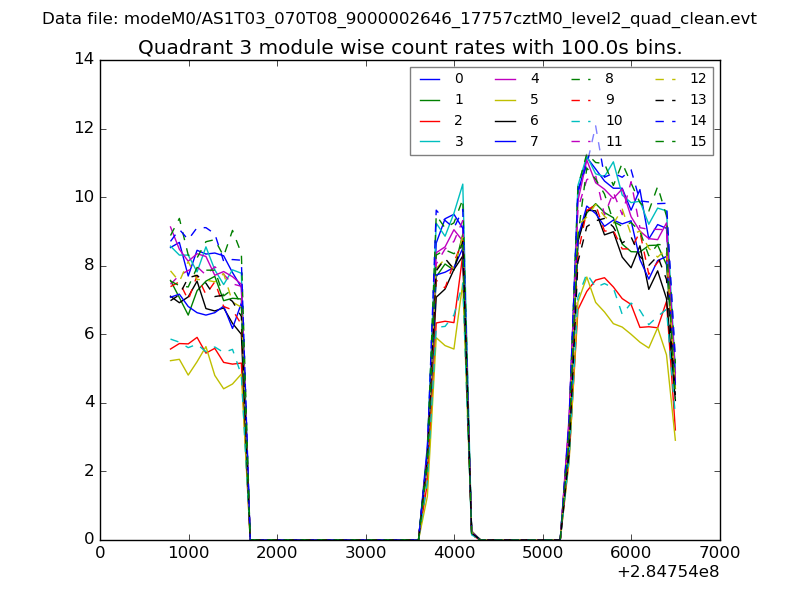
| Module-wise count rates for Quadrant C Data is divided into 100 sec bins |
 |
 |
| Module-wise count rates for Quadrant D Data is divided into 100 sec bins |
 |
 |
| Parameter | Plot |
|---|---|
| CZT HV Monitor | 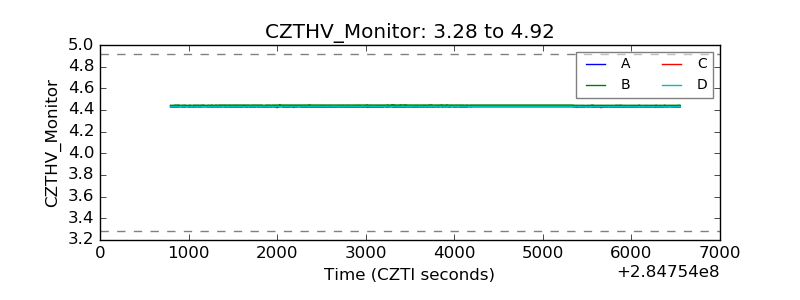 |
| D_VDD |  |
| Temperature 1 | 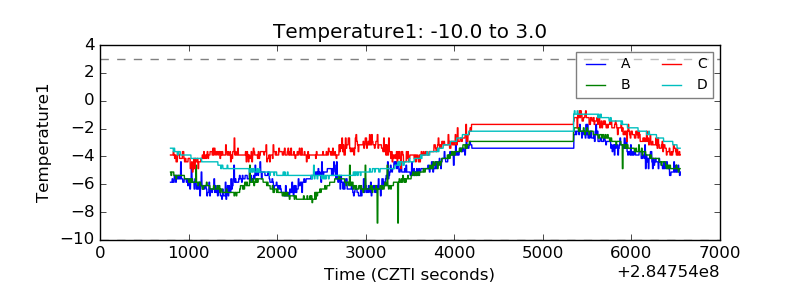 |
| Veto HV Monitor | 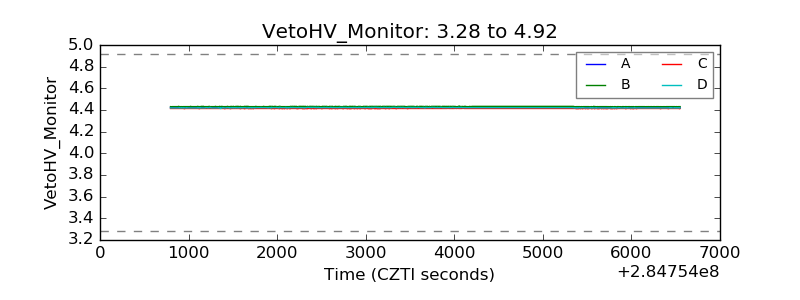 |
| Veto LLD | 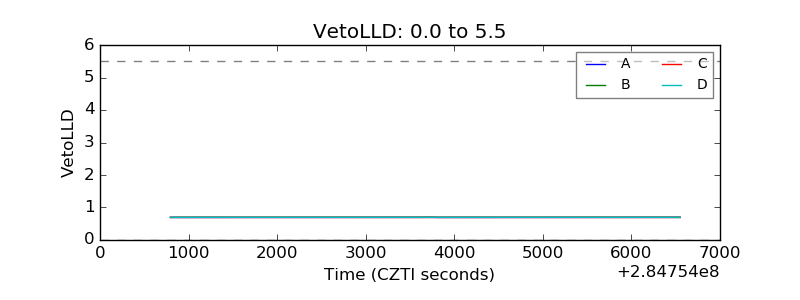 |
| Alpha Counter | 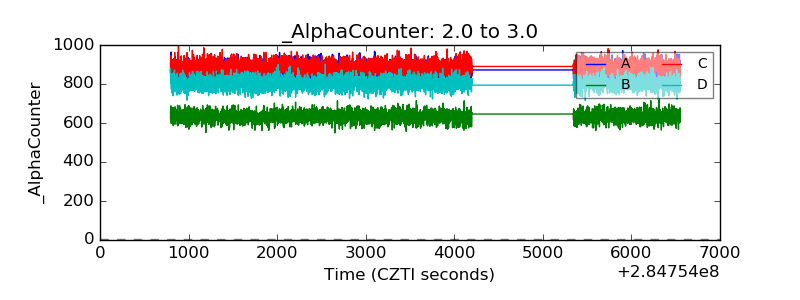 |
| _CPM_Rate | 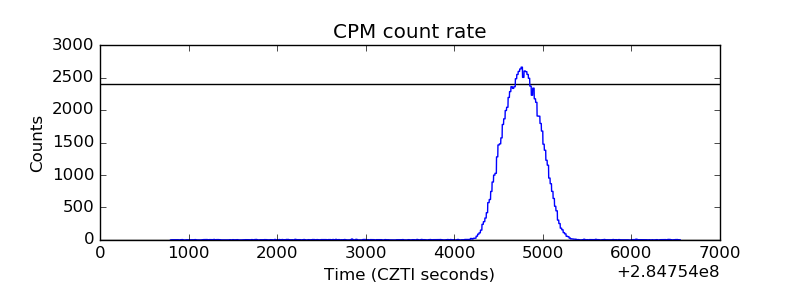 |
| CZT Counter | 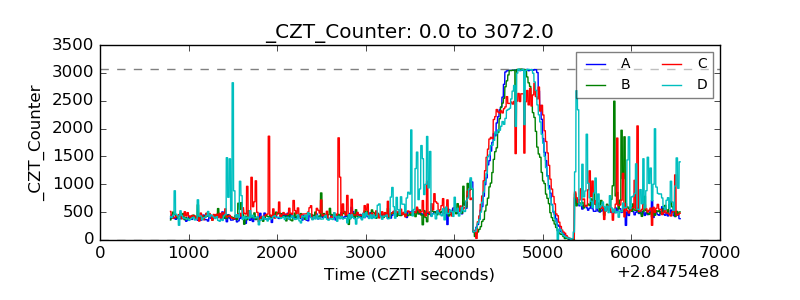 |
| +2.5 Volts monitor |  |
| +5 Volts monitor |  |
| _ROLL_ROT | 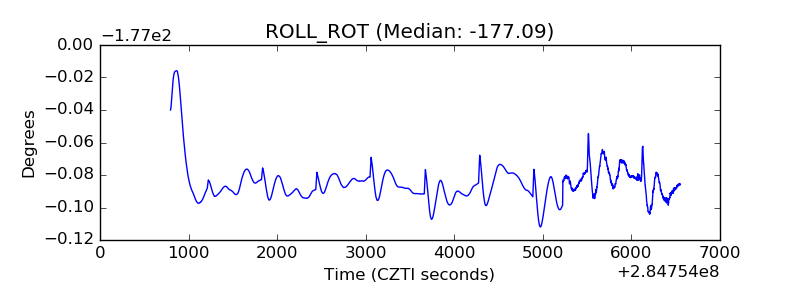 |
| _Roll_DEC | 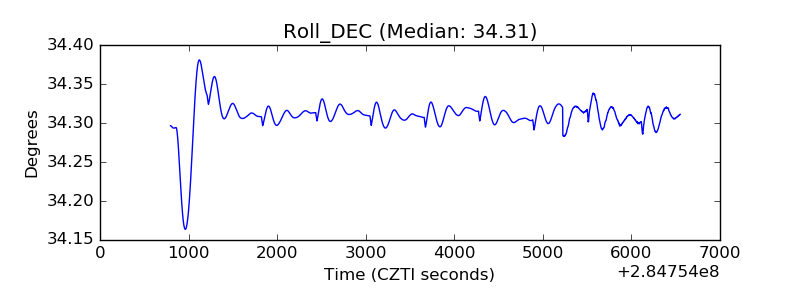 |
| _Roll_RA |  |
| Veto Counter | 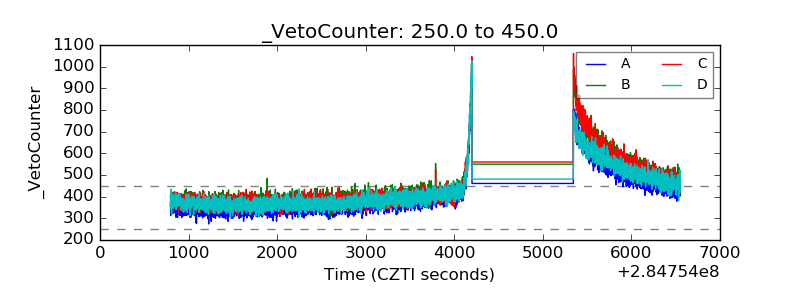 |