| Param | Original file | Final file |
|---|---|---|
| Filename | modeM0/AS1T03_070T08_9000002646_17758cztM0_level2.evt | modeM0/AS1T03_070T08_9000002646_17758cztM0_level2_quad_clean.evt |
| Size (bytes) | 462,435,840 | 91,817,280 |
| Size | 441.0 MB | 87.6 MB |
| Events in quadrant A | 3,001,732 | 602,494 |
| Events in quadrant B | 3,301,669 | 613,515 |
| Events in quadrant C | 3,641,616 | 571,885 |
| Events in quadrant D | 3,641,945 | 562,988 |
| Mode SS | |||
|---|---|---|---|
| Quadrant | BADHDUFLAG | Total packets | Discarded packets |
| A | 0 | 124 | 0 |
| B | 0 | 124 | 0 |
| C | 0 | 124 | 0 |
| D | 0 | 124 | 0 |
| Mode M9 | |||
|---|---|---|---|
| Quadrant | BADHDUFLAG | Total packets | Discarded packets |
| A | 0 | 17 | 0 |
| B | 0 | 18 | 0 |
| C | 0 | 18 | 0 |
| D | 0 | 18 | 0 |
| Mode M0 | |||
|---|---|---|---|
| Quadrant | BADHDUFLAG | Total packets | Discarded packets |
| A | 0 | 12946 | 3 |
| B | 0 | 13855 | 2 |
| C | 0 | 14788 | 2 |
| D | 0 | 15016 | 2 |
| Quadrant | Total seconds | Saturated seconds | Saturation percentage |
|---|---|---|---|
| A | 6158 | 44 | 0.714518% |
| B | 6158 | 109 | 1.770055% |
| C | 6158 | 247 | 4.011043% |
| D | 6158 | 147 | 2.387139% |
Noise dominated data is calculated using 1-second bins in cleaned event files. If a bin has >2000 counts, and if more than 50% of those come from <1% of pixels, then it is considered to be noise-dominated and hence unusable.
| Quadrant | # 1 sec bins | Bins with >0 counts | Bins with >2000 counts | High rate bins dominated by noise | Noise dominated (total time) | Noise dominated (detector-on time) | Marked lightcurve |
|---|---|---|---|---|---|---|---|
| A | 7403 | 6159 | 5 | 5 | 0.07% | 0.08% | 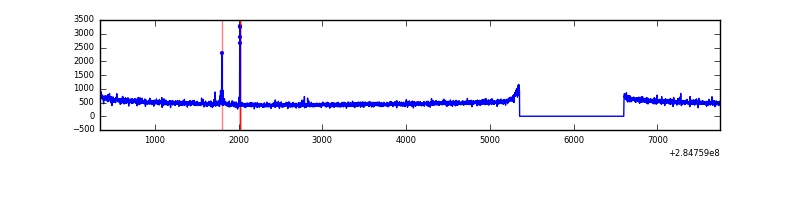 |
| B | 7403 | 6159 | 41 | 41 | 0.55% | 0.67% | 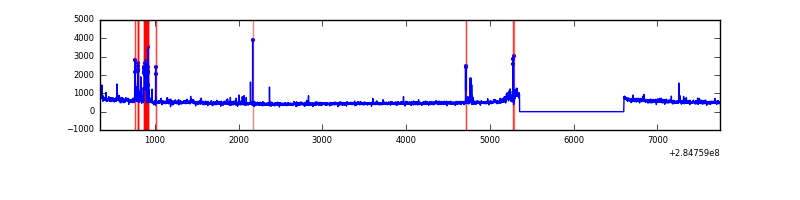 |
| C | 7403 | 6159 | 97 | 97 | 1.31% | 1.57% |  |
| D | 7403 | 6159 | 90 | 90 | 1.22% | 1.46% | 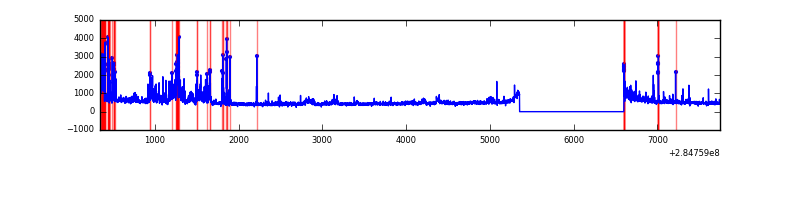 |
Top three noisy pixels from each quadrant. If the there are fewer than three noisy pixels in the level2.evt file, extra rows are filled as -1
| Pixel properties | Quadrant properties | ||||||
|---|---|---|---|---|---|---|---|
| Quadrant | DetID | PixID | Counts | Sigma | Mean | Median | Sigma |
| A | 15 | 174 | 22343 | 140.59 | 771 | 757 | 153.5 |
| A | 4 | 2 | 13438 | 82.59 | 771 | 757 | 153.5 |
| A | 0 | 226 | 6726 | 38.88 | 771 | 757 | 153.5 |
| B | 4 | 142 | 141350 | 971.43 | 772 | 753 | 144.7 |
| B | 10 | 245 | 44065 | 299.26 | 772 | 753 | 144.7 |
| B | 0 | 219 | 32786 | 221.33 | 772 | 753 | 144.7 |
| C | 4 | 254 | 475326 | 2751.33 | 738 | 746 | 172.5 |
| C | 14 | 238 | 114878 | 661.67 | 738 | 746 | 172.5 |
| C | 3 | 233 | 99907 | 574.88 | 738 | 746 | 172.5 |
| D | 7 | 238 | 585737 | 3089.16 | 741 | 723 | 189.4 |
| D | 5 | 222 | 165035 | 867.65 | 741 | 723 | 189.4 |
| D | 10 | 70 | 28430 | 146.31 | 741 | 723 | 189.4 |
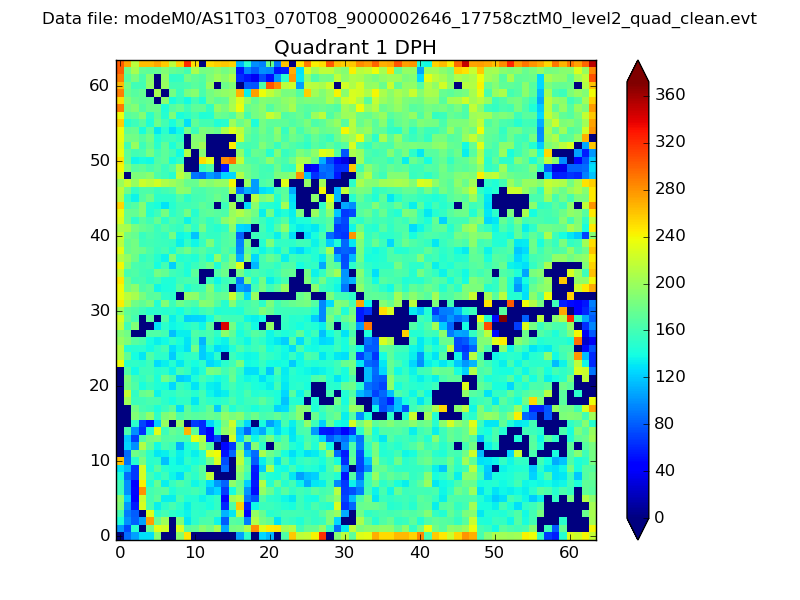
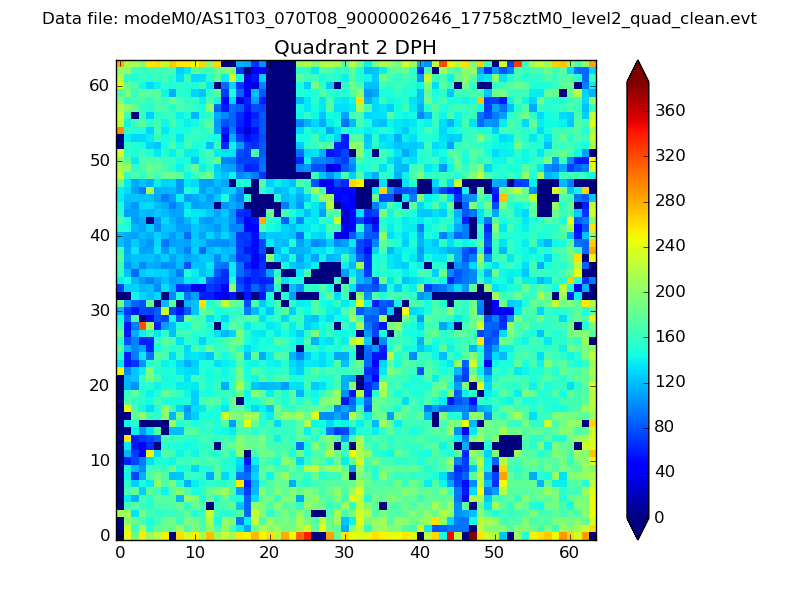
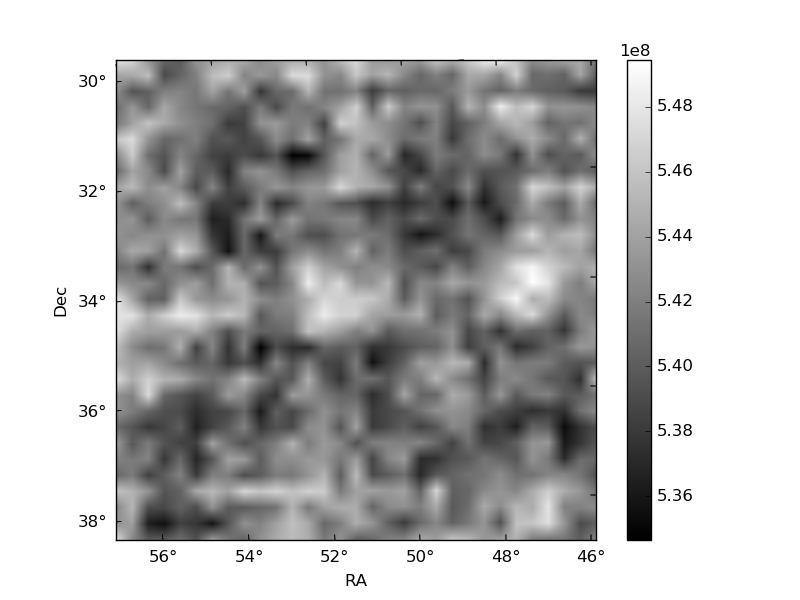
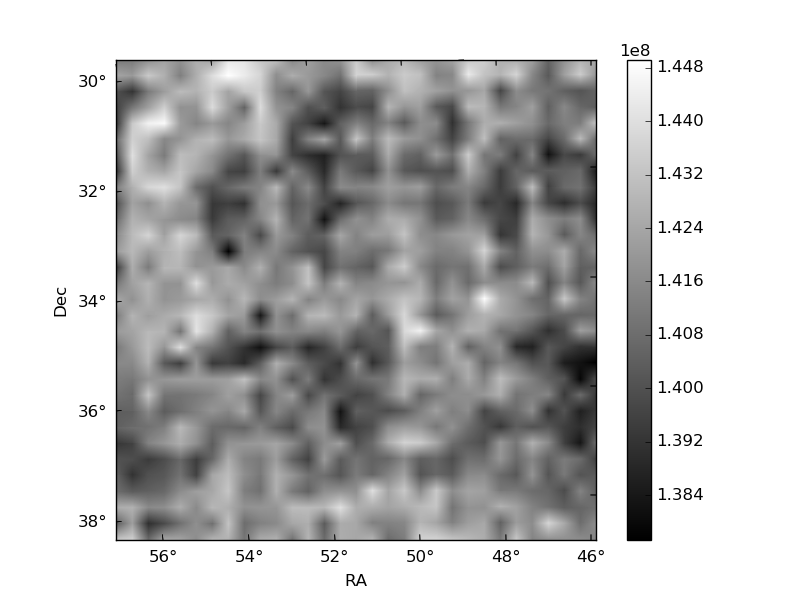
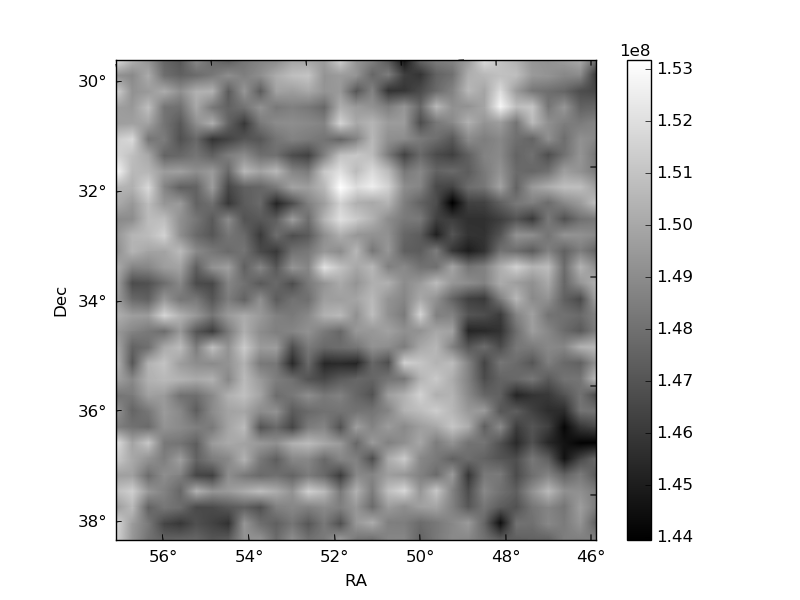
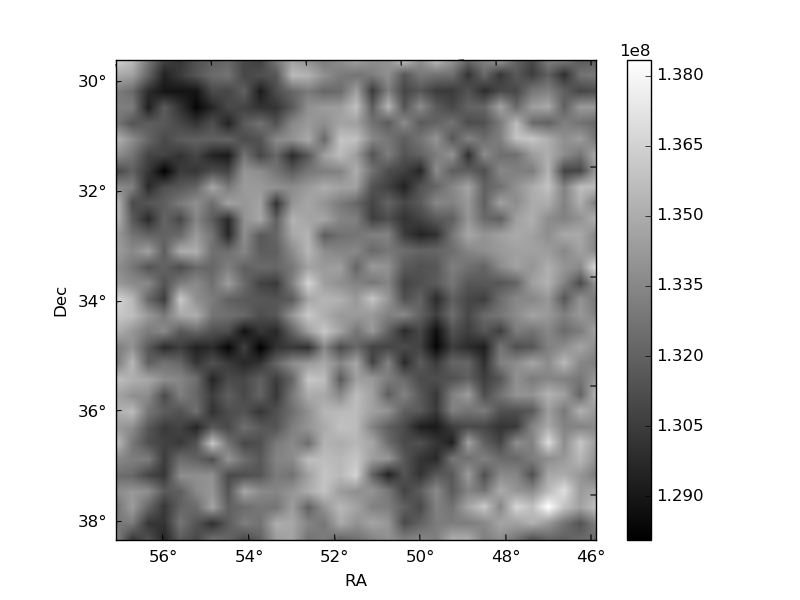
Histogram calculated using DETX and DETY for each event in the final _common_clean file
| Quadrant A | 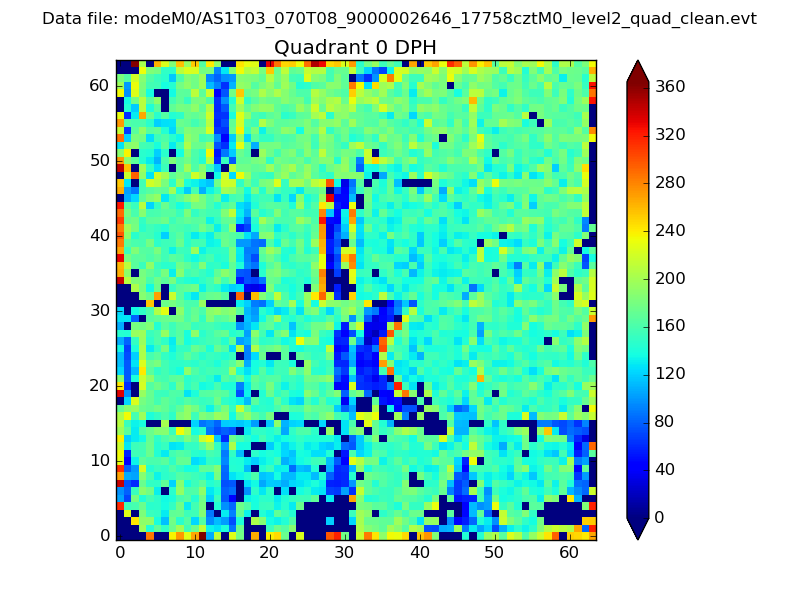 |
 |
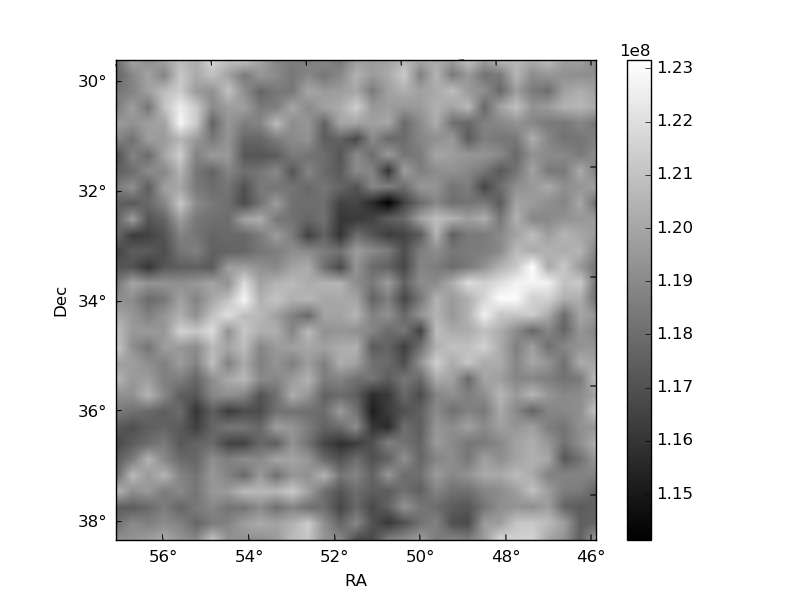
Quadrant B |
|---|---|---|---|
| Quadrant D | 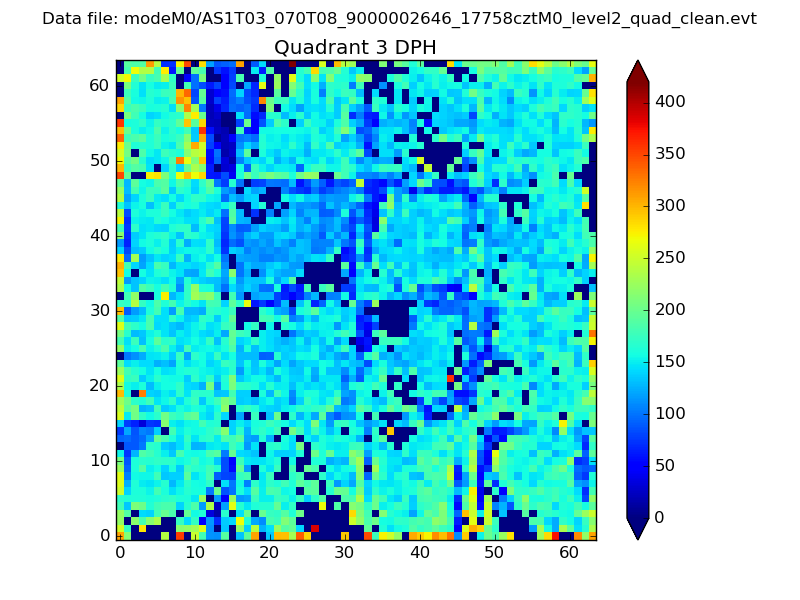 |
 |
Quadrant C |
| Plot type | Count rate plots | Images |
|---|---|---|
| Comparison with Poisson distribution Blue bars denote a histogram of data divided into 1 sec bins. Red curve is a Poisson curve with rate = median count rate of data. |
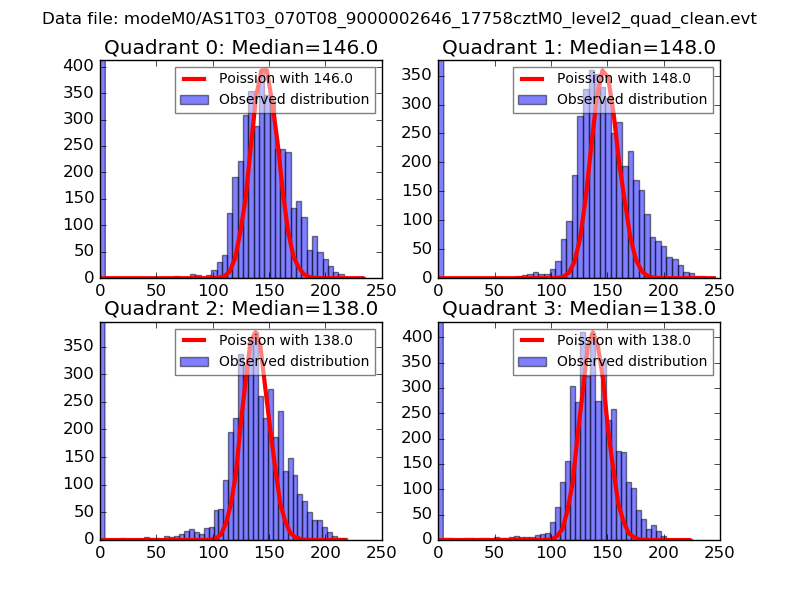 |
 |
| Quadrant-wise count rates Data is divided into 100 sec bins |
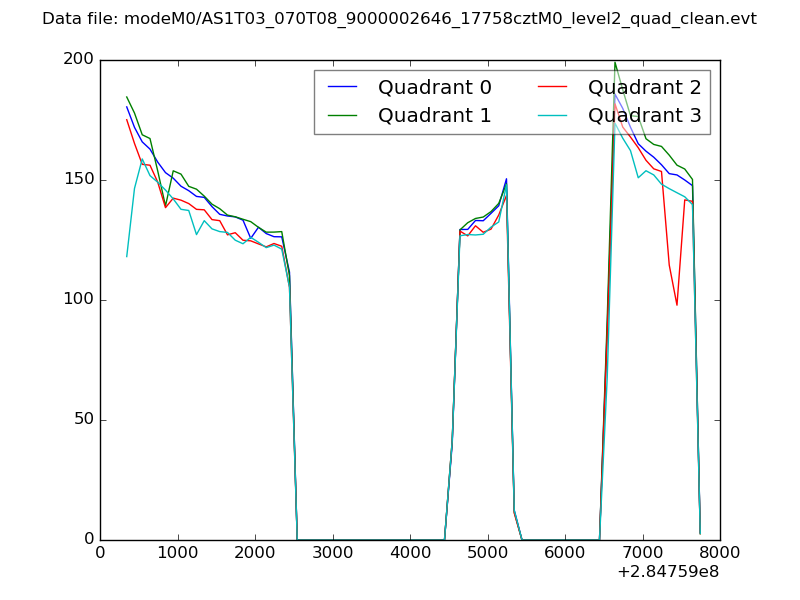 |
|
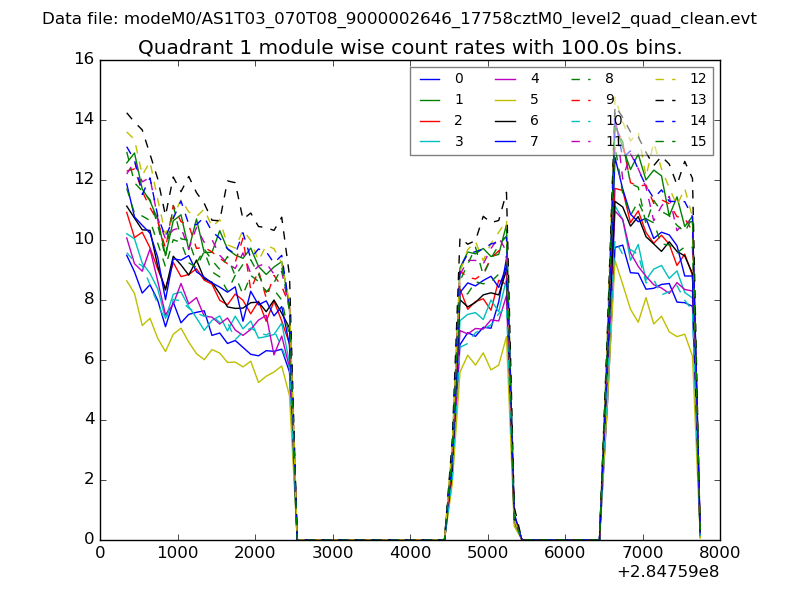
| Module-wise count rates for Quadrant A Data is divided into 100 sec bins |
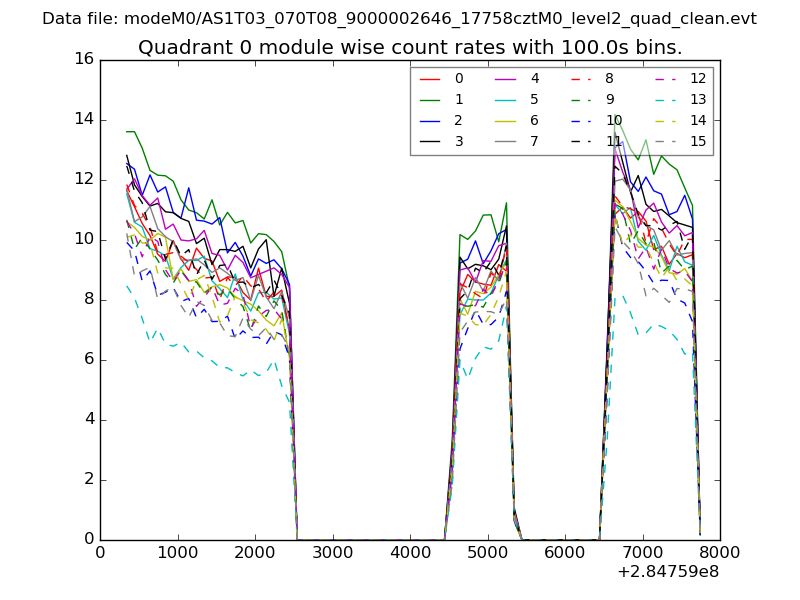 |
 |
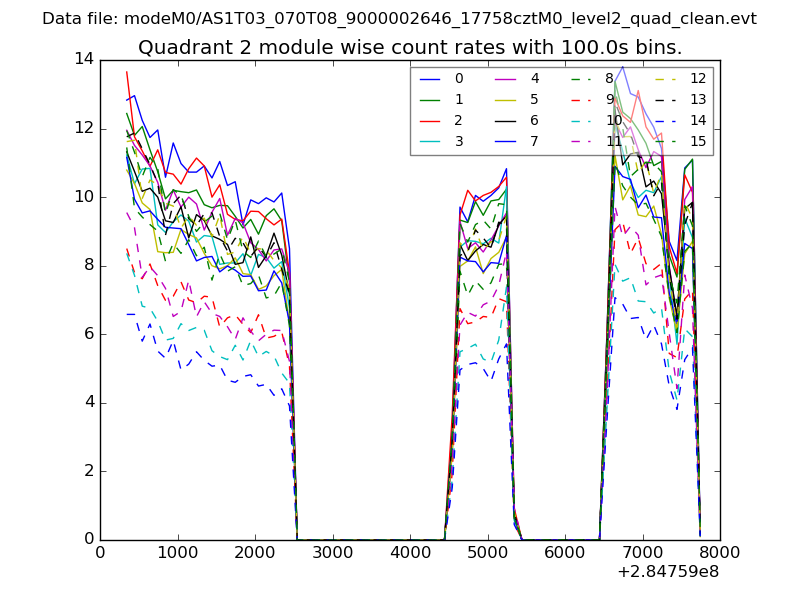
| Module-wise count rates for Quadrant B Data is divided into 100 sec bins |
 |
 |
| Module-wise count rates for Quadrant C Data is divided into 100 sec bins |
 |
 |
| Module-wise count rates for Quadrant D Data is divided into 100 sec bins |
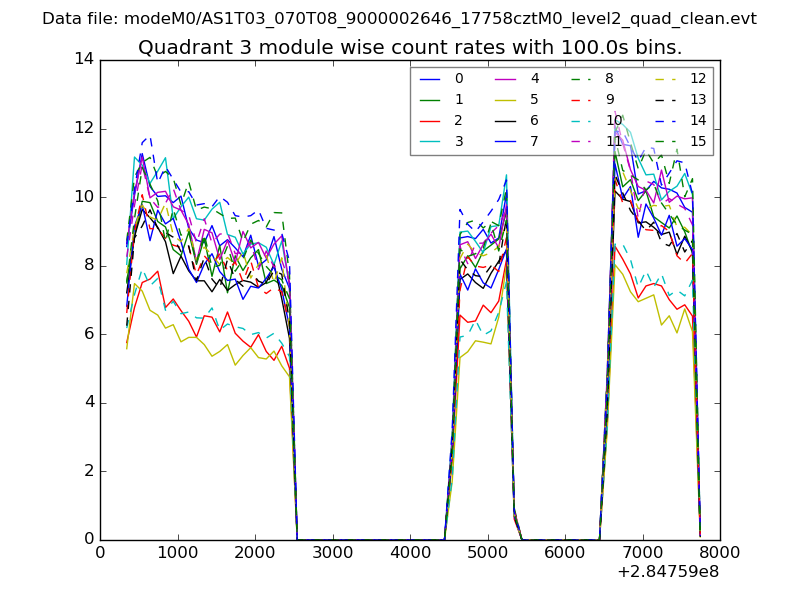 |
 |
| Parameter | Plot |
|---|---|
| CZT HV Monitor | 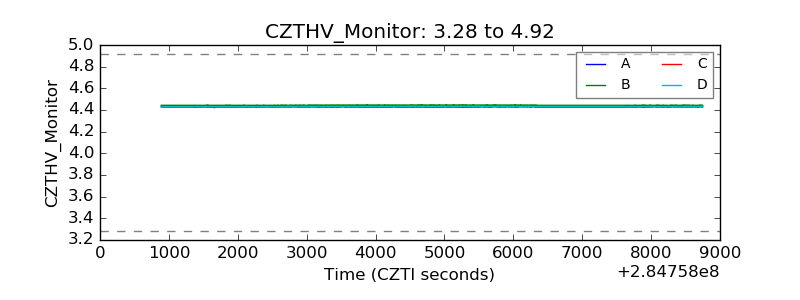 |
| D_VDD | 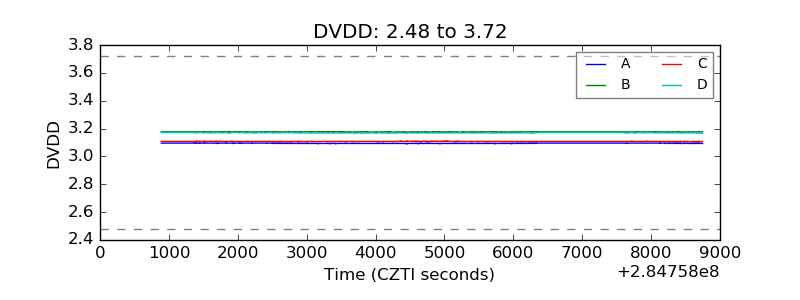 |
| Temperature 1 | 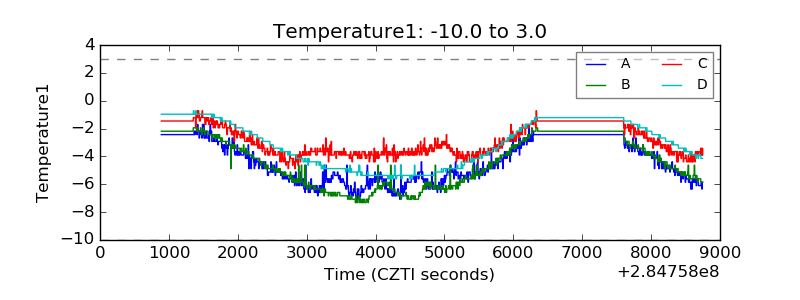 |
| Veto HV Monitor |  |
| Veto LLD | 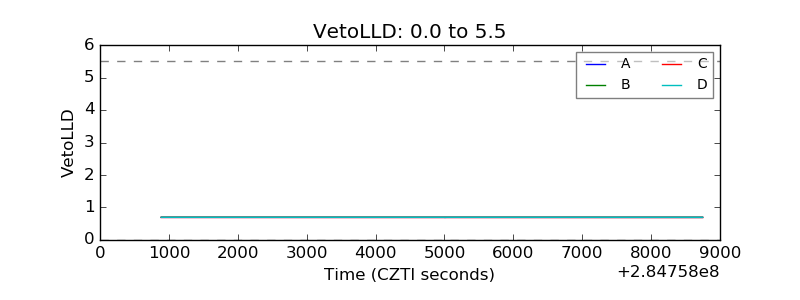 |
| Alpha Counter | 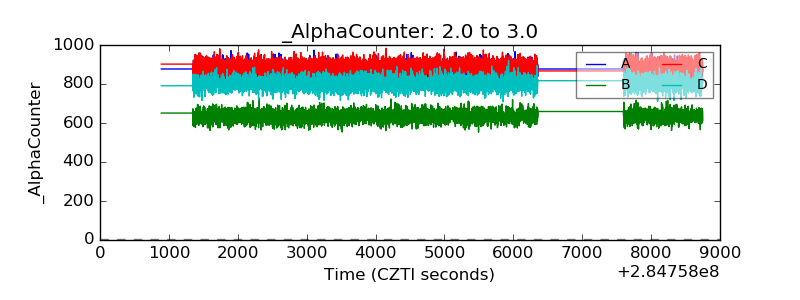 |
| _CPM_Rate | 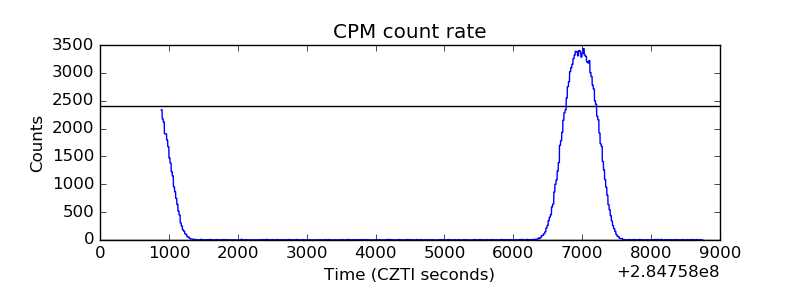 |
| CZT Counter | 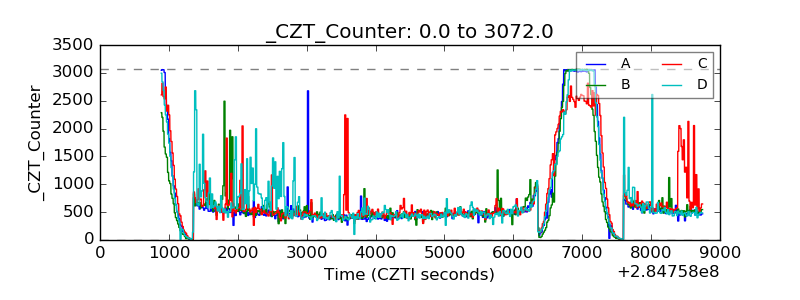 |
| +2.5 Volts monitor |  |
| +5 Volts monitor | 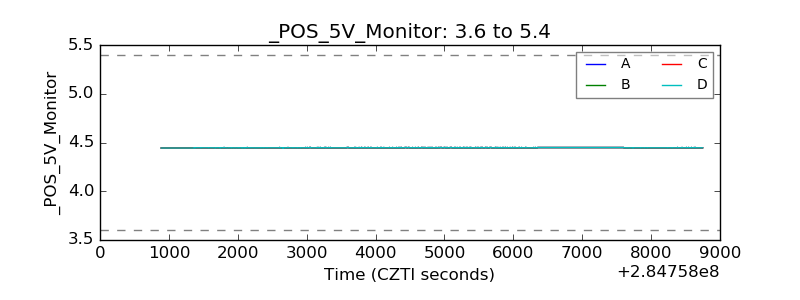 |
| _ROLL_ROT | 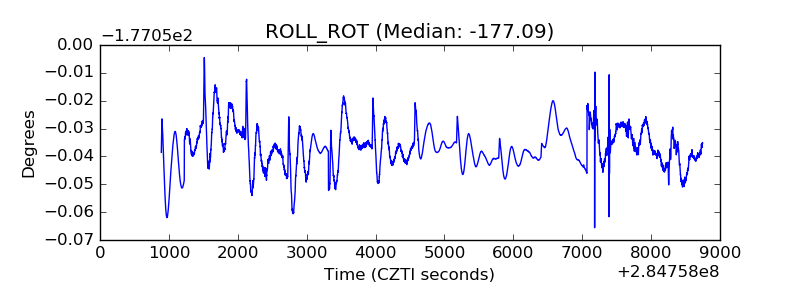 |
| _Roll_DEC | 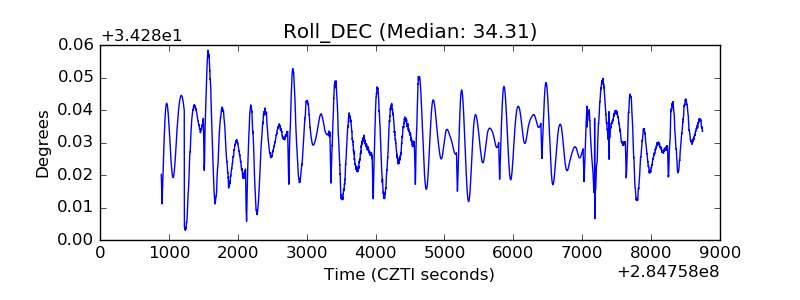 |
| _Roll_RA | 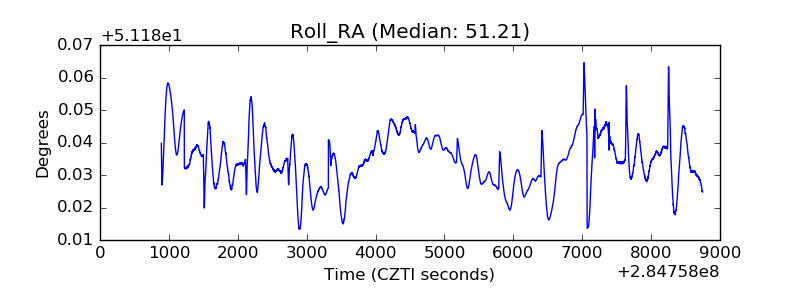 |
| Veto Counter | 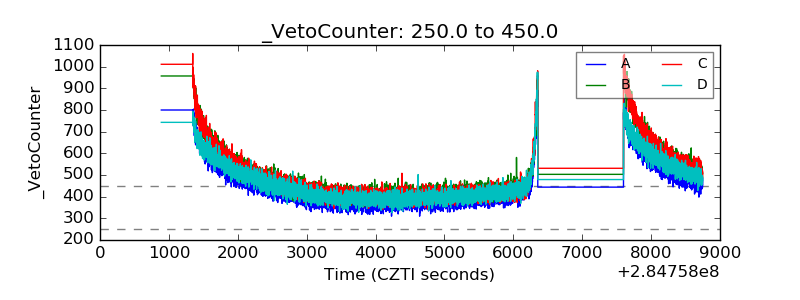 |