| Param | Original file | Final file |
|---|---|---|
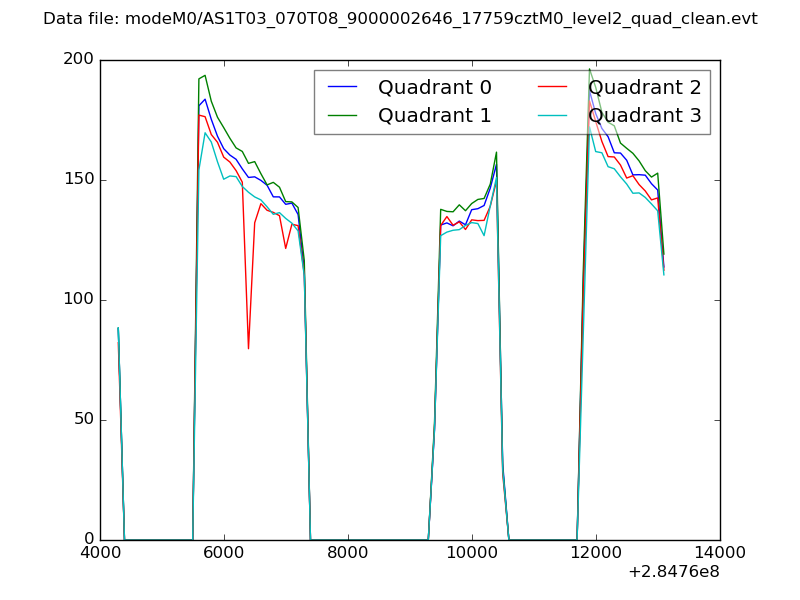
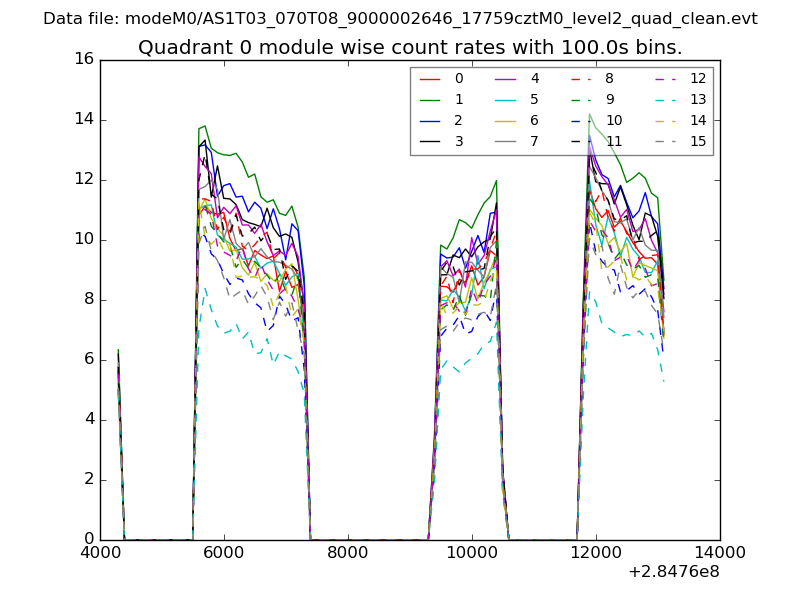
| Filename | modeM0/AS1T03_070T08_9000002646_17759cztM0_level2.evt | modeM0/AS1T03_070T08_9000002646_17759cztM0_level2_quad_clean.evt |
| Size (bytes) | 469,100,160 | 98,426,880 |
| Size | 447.4 MB | 93.9 MB |
| Events in quadrant A | 3,124,791 | 645,864 |
| Events in quadrant B | 3,337,691 | 669,393 |
| Events in quadrant C | 3,987,089 | 616,108 |
| Events in quadrant D | 3,328,819 | 609,387 |
| Mode SS | |||
|---|---|---|---|
| Quadrant | BADHDUFLAG | Total packets | Discarded packets |
| A | 0 | 128 | 0 |
| B | 0 | 128 | 0 |
| C | 0 | 128 | 0 |
| D | 0 | 128 | 0 |
| Mode M9 | |||
|---|---|---|---|
| Quadrant | BADHDUFLAG | Total packets | Discarded packets |
| A | 0 | 26 | 0 |
| B | 0 | 26 | 0 |
| C | 0 | 26 | 0 |
| D | 0 | 26 | 0 |
| Mode M0 | |||
|---|---|---|---|
| Quadrant | BADHDUFLAG | Total packets | Discarded packets |
| A | 0 | 13275 | 2 |
| B | 0 | 13939 | 2 |
| C | 0 | 15886 | 2 |
| D | 0 | 14146 | 2 |
| Quadrant | Total seconds | Saturated seconds | Saturation percentage |
|---|---|---|---|
| A | 6313 | 67 | 1.061302% |
| B | 6314 | 96 | 1.520431% |
| C | 6314 | 315 | 4.988914% |
| D | 6313 | 120 | 1.900840% |
Noise dominated data is calculated using 1-second bins in cleaned event files. If a bin has >2000 counts, and if more than 50% of those come from <1% of pixels, then it is considered to be noise-dominated and hence unusable.
| Quadrant | # 1 sec bins | Bins with >0 counts | Bins with >2000 counts | High rate bins dominated by noise | Noise dominated (total time) | Noise dominated (detector-on time) | Marked lightcurve |
|---|---|---|---|---|---|---|---|
| A | 8883 | 6315 | 0 | 0 | 0.00% | 0.00% |  |
| B | 8884 | 6316 | 0 | 0 | 0.00% | 0.00% | 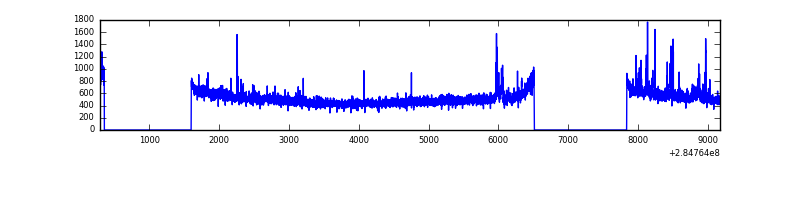 |
| C | 8884 | 6316 | 109 | 109 | 1.23% | 1.73% | 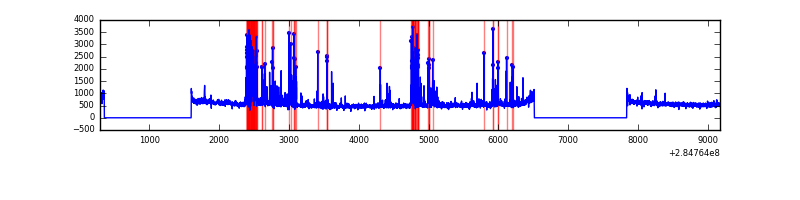 |
| D | 8883 | 6315 | 38 | 38 | 0.43% | 0.60% | 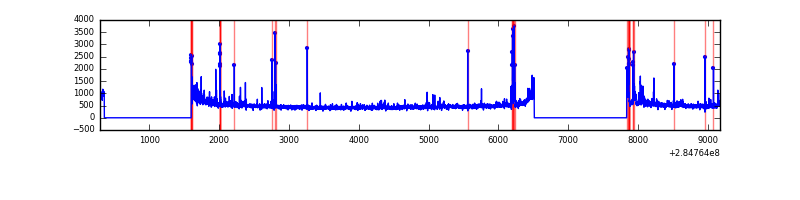 |
Top three noisy pixels from each quadrant. If the there are fewer than three noisy pixels in the level2.evt file, extra rows are filled as -1
| Pixel properties | Quadrant properties | ||||||
|---|---|---|---|---|---|---|---|
| Quadrant | DetID | PixID | Counts | Sigma | Mean | Median | Sigma |
| A | 0 | 226 | 7077 | 39.0 | 810 | 795 | 161.1 |
| A | 15 | 174 | 6117 | 33.04 | 810 | 795 | 161.1 |
| A | 12 | 194 | 6006 | 32.35 | 810 | 795 | 161.1 |
| B | 0 | 229 | 58542 | 374.0 | 820 | 801 | 154.4 |
| B | 0 | 219 | 24843 | 155.73 | 820 | 801 | 154.4 |
| B | 0 | 230 | 24363 | 152.62 | 820 | 801 | 154.4 |
| C | 4 | 254 | 666896 | 3644.29 | 779 | 787 | 182.8 |
| C | 14 | 238 | 120990 | 657.63 | 779 | 787 | 182.8 |
| C | 3 | 233 | 79805 | 432.31 | 779 | 787 | 182.8 |
| D | 7 | 238 | 209761 | 1034.43 | 781 | 766 | 202.0 |
| D | 1 | 52 | 74368 | 364.3 | 781 | 766 | 202.0 |
| D | 5 | 222 | 35052 | 169.7 | 781 | 766 | 202.0 |
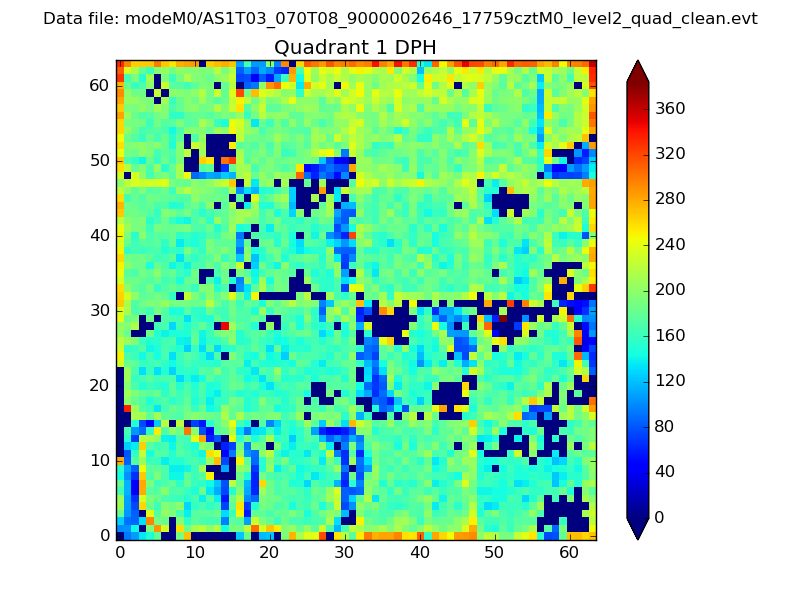
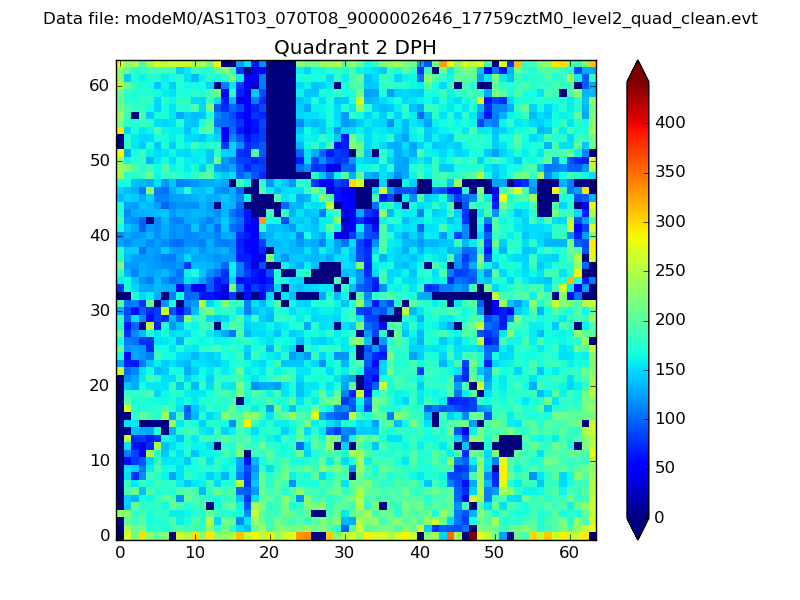
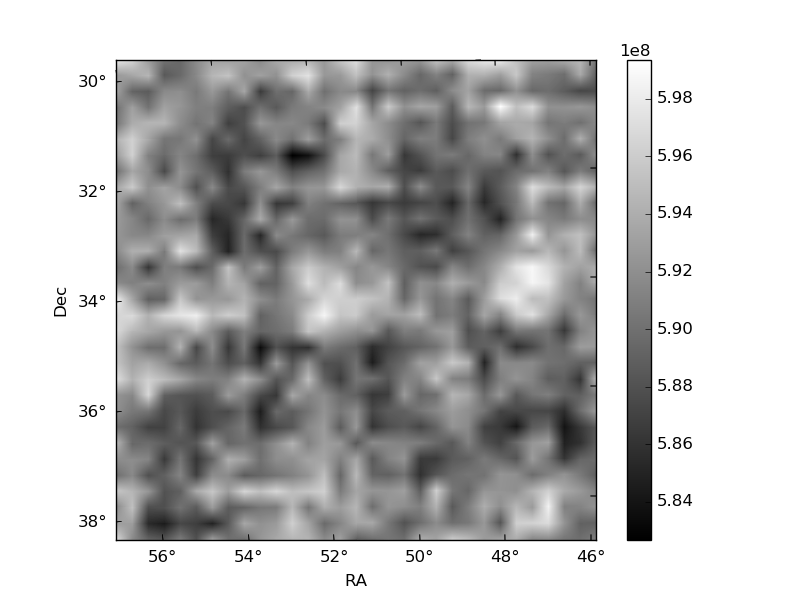
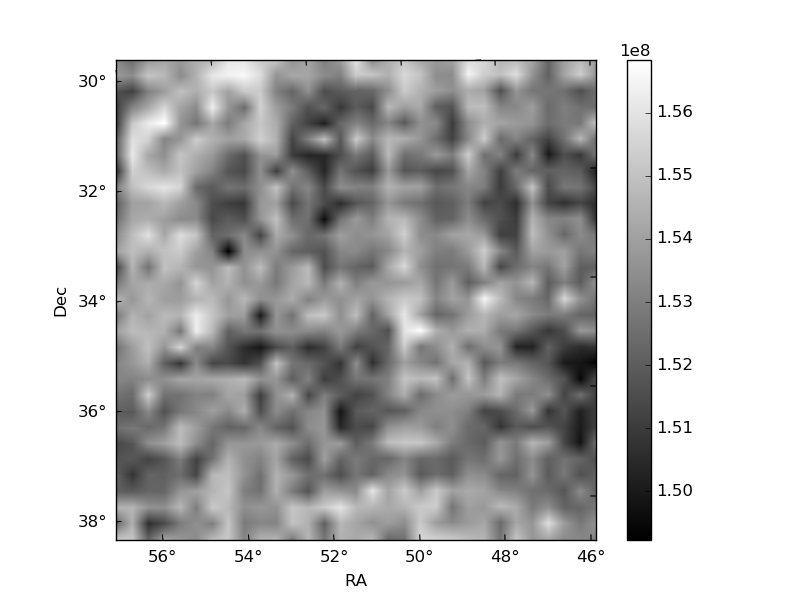
Histogram calculated using DETX and DETY for each event in the final _common_clean file
| Quadrant A | 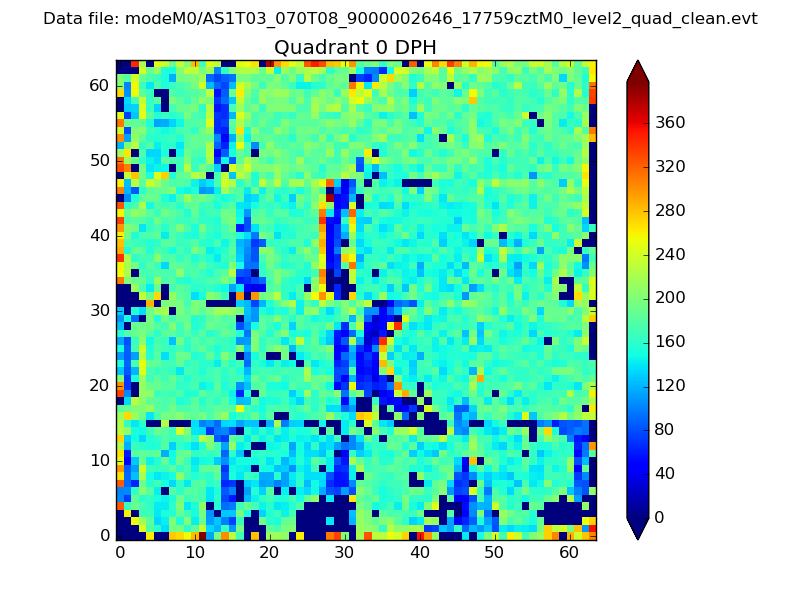 |
 |
Quadrant B |
|---|---|---|---|
| Quadrant D | 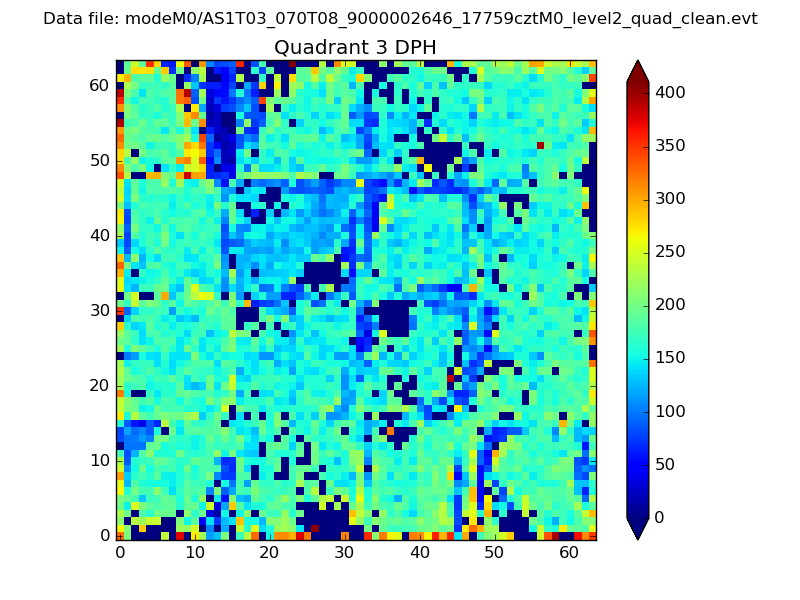 |
 |
Quadrant C |
| Plot type | Count rate plots | Images |
|---|---|---|
| Comparison with Poisson distribution Blue bars denote a histogram of data divided into 1 sec bins. Red curve is a Poisson curve with rate = median count rate of data. |
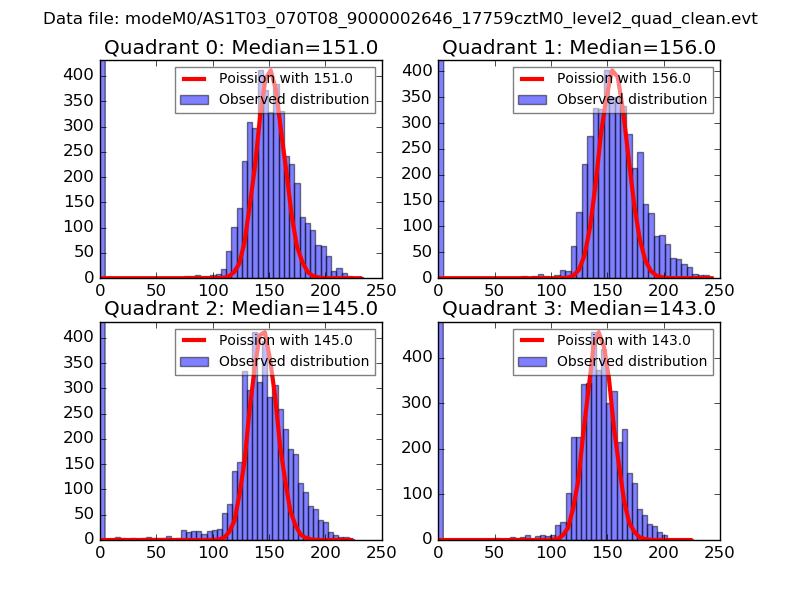 |
 |
| Quadrant-wise count rates Data is divided into 100 sec bins |
 |
|
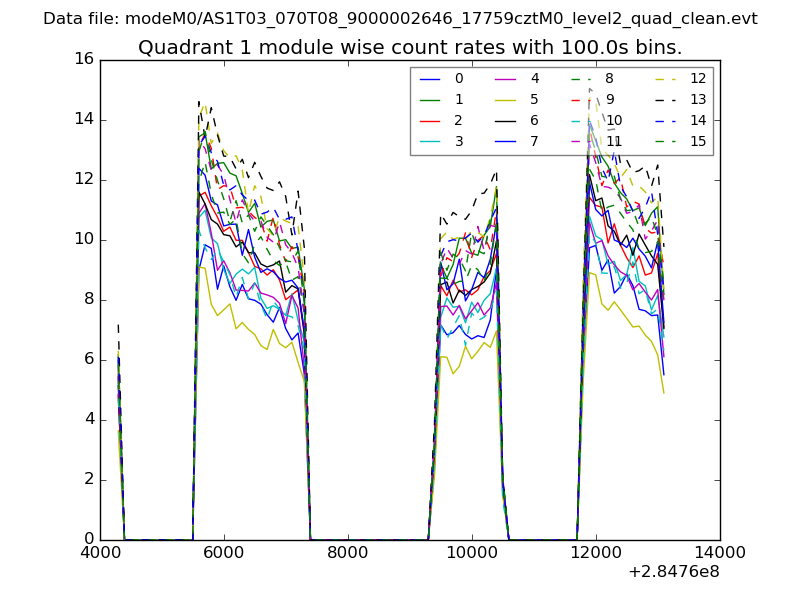
| Module-wise count rates for Quadrant A Data is divided into 100 sec bins |
 |
 |
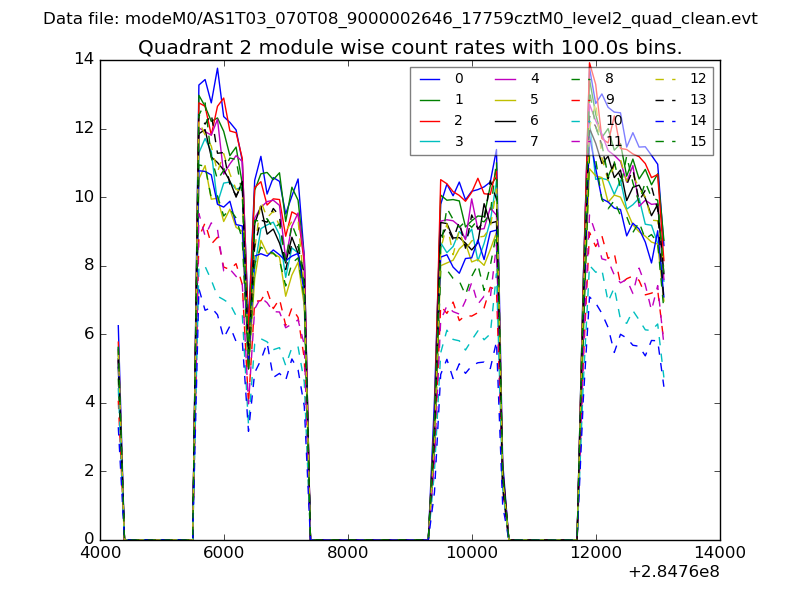
| Module-wise count rates for Quadrant B Data is divided into 100 sec bins |
 |
 |
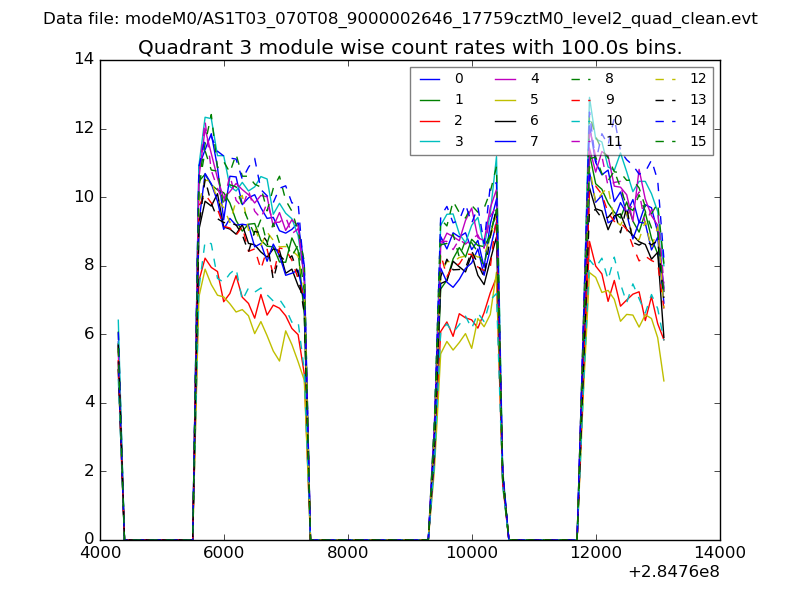
| Module-wise count rates for Quadrant C Data is divided into 100 sec bins |
 |
 |
| Module-wise count rates for Quadrant D Data is divided into 100 sec bins |
 |
 |
| Parameter | Plot |
|---|---|
| CZT HV Monitor | 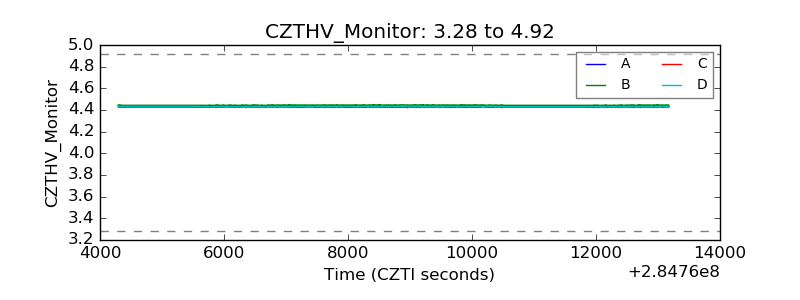 |
| D_VDD |  |
| Temperature 1 | 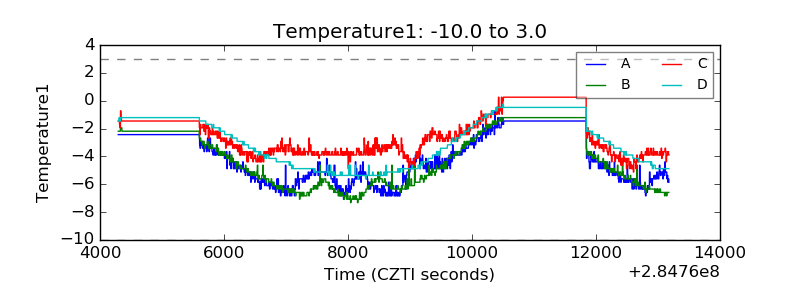 |
| Veto HV Monitor | 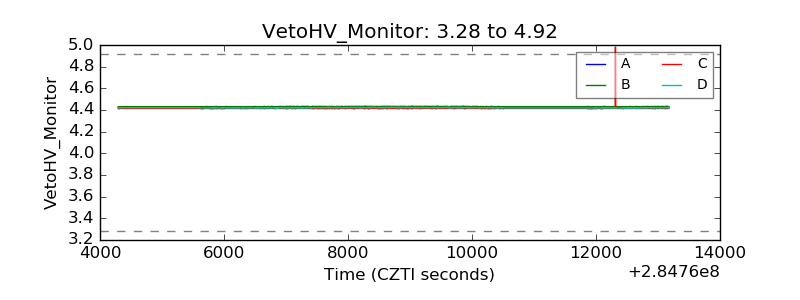 |
| Veto LLD | 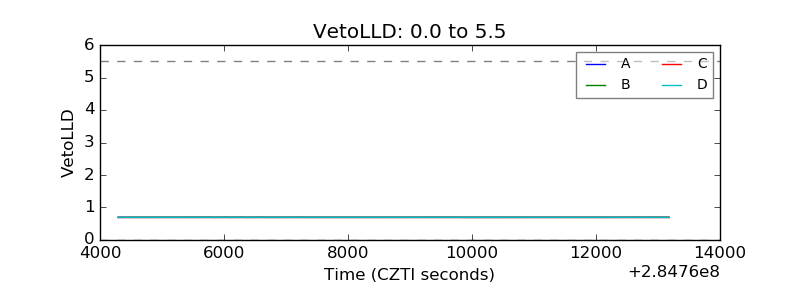 |
| Alpha Counter | 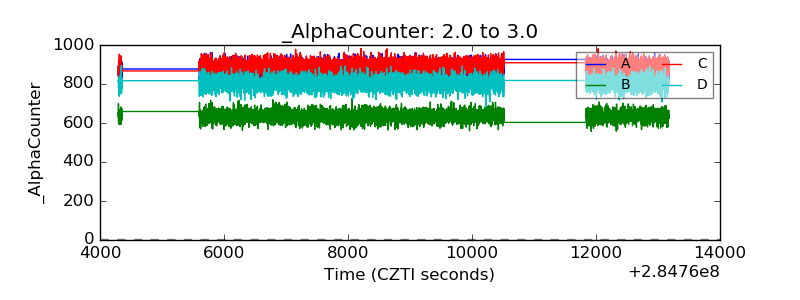 |
| _CPM_Rate | 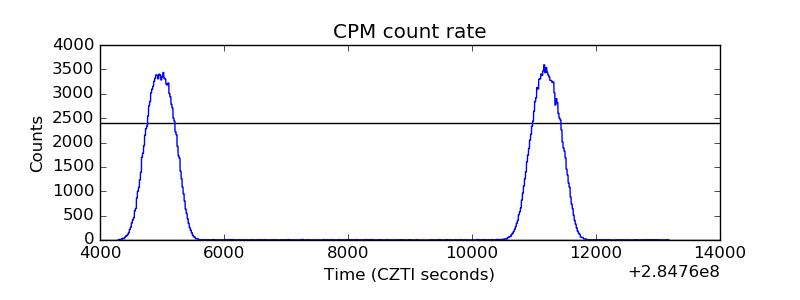 |
| CZT Counter | 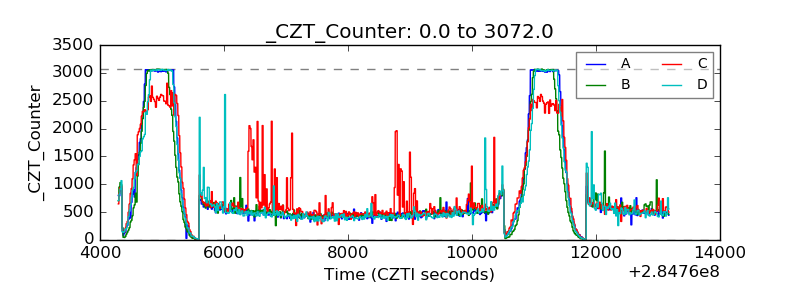 |
| +2.5 Volts monitor |  |
| +5 Volts monitor |  |
| _ROLL_ROT | 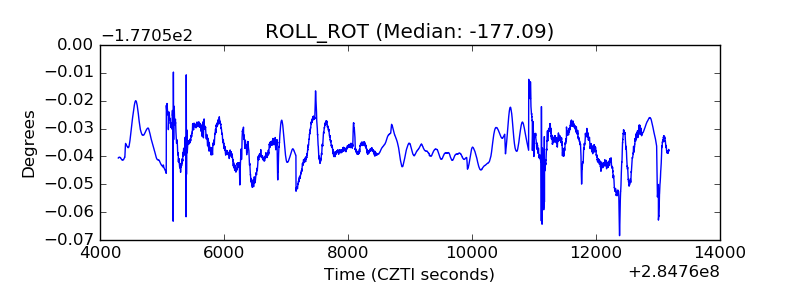 |
| _Roll_DEC | 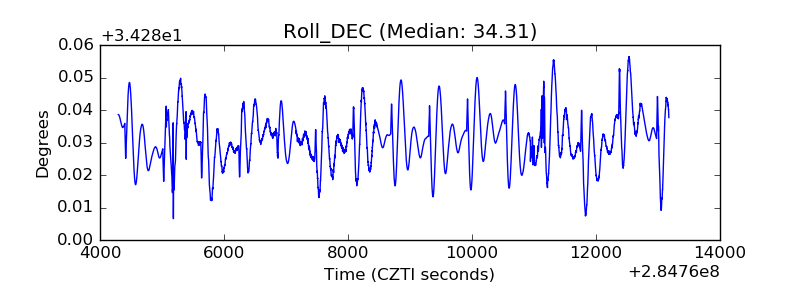 |
| _Roll_RA | 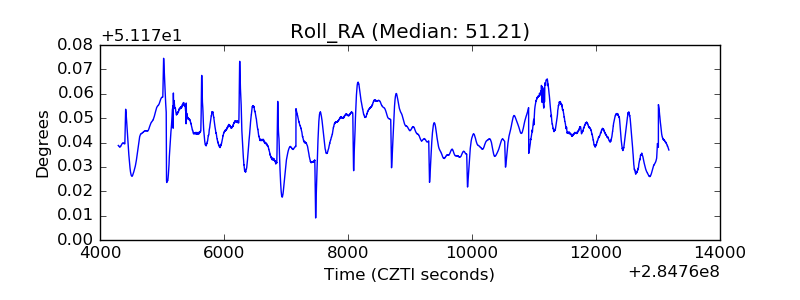 |
| Veto Counter | 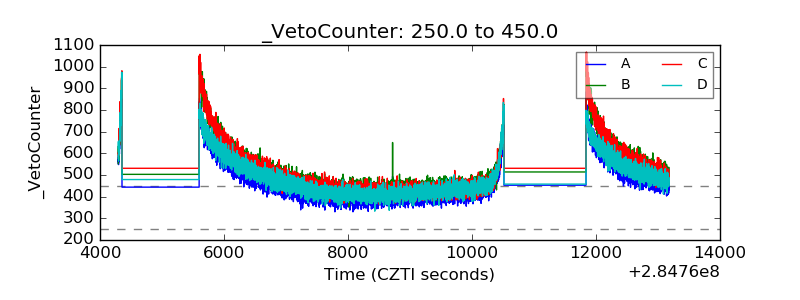 |