| Param | Original file | Final file |
|---|---|---|
| Filename | modeM0/AS1T03_070T08_9000002646_17761cztM0_level2.evt | modeM0/AS1T03_070T08_9000002646_17761cztM0_level2_quad_clean.evt |
| Size (bytes) | 79,718,400 | 20,911,680 |
| Size | 76.0 MB | 19.9 MB |
| Events in quadrant A | 730,731 | 137,243 |
| Events in quadrant B | 541,998 | 150,459 |
| Events in quadrant C | 528,341 | 139,884 |
| Events in quadrant D | 548,827 | 134,771 |
| Mode SS | |||
|---|---|---|---|
| Quadrant | BADHDUFLAG | Total packets | Discarded packets |
| A | 0 | 22 | 0 |
| B | 0 | 22 | 0 |
| C | 0 | 22 | 0 |
| D | 0 | 22 | 0 |
| Mode M9 | |||
|---|---|---|---|
| Quadrant | BADHDUFLAG | Total packets | Discarded packets |
| A | 0 | 13 | 0 |
| B | 0 | 13 | 0 |
| C | 0 | 13 | 0 |
| D | 0 | 13 | 0 |
| Mode M0 | |||
|---|---|---|---|
| Quadrant | BADHDUFLAG | Total packets | Discarded packets |
| A | 0 | 2753 | 1 |
| B | 0 | 2171 | 1 |
| C | 0 | 2108 | 1 |
| D | 0 | 2211 | 1 |
| Quadrant | Total seconds | Saturated seconds | Saturation percentage |
|---|---|---|---|
| A | 896 | 113 | 12.611607% |
| B | 897 | 28 | 3.121516% |
| C | 897 | 47 | 5.239688% |
| D | 897 | 16 | 1.783724% |
Noise dominated data is calculated using 1-second bins in cleaned event files. If a bin has >2000 counts, and if more than 50% of those come from <1% of pixels, then it is considered to be noise-dominated and hence unusable.
| Quadrant | # 1 sec bins | Bins with >0 counts | Bins with >2000 counts | High rate bins dominated by noise | Noise dominated (total time) | Noise dominated (detector-on time) | Marked lightcurve |
|---|---|---|---|---|---|---|---|
| A | 2266 | 897 | 94 | 94 | 4.15% | 10.48% | 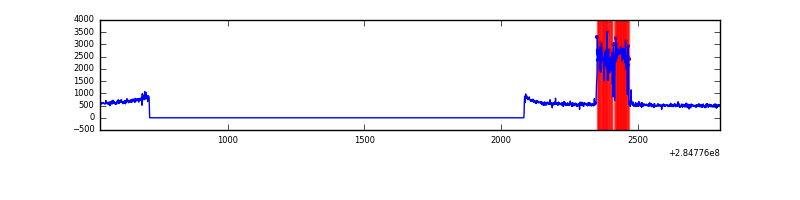 |
| B | 2267 | 898 | 0 | 0 | 0.00% | 0.00% | 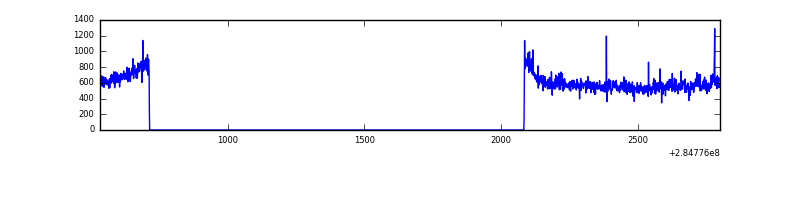 |
| C | 2267 | 898 | 0 | 0 | 0.00% | 0.00% | 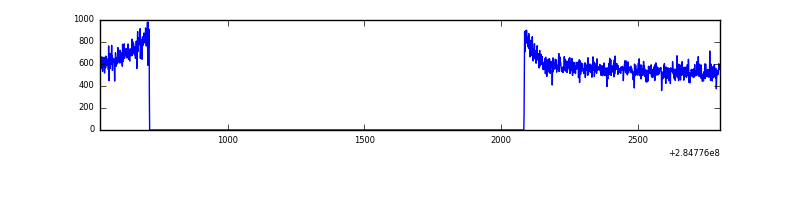 |
| D | 2267 | 898 | 4 | 4 | 0.18% | 0.45% | 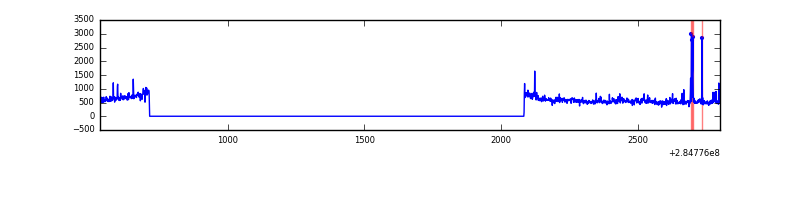 |
Top three noisy pixels from each quadrant. If the there are fewer than three noisy pixels in the level2.evt file, extra rows are filled as -1
| Pixel properties | Quadrant properties | ||||||
|---|---|---|---|---|---|---|---|
| Quadrant | DetID | PixID | Counts | Sigma | Mean | Median | Sigma |
| A | 15 | 174 | 241602 | 8941.03 | 126 | 123 | 27.0 |
| A | 15 | 191 | 2728 | 96.45 | 126 | 123 | 27.0 |
| A | 8 | 205 | 1122 | 36.99 | 126 | 123 | 27.0 |
| B | 0 | 219 | 9202 | 333.99 | 134 | 131 | 27.2 |
| B | 10 | 245 | 3644 | 129.35 | 134 | 131 | 27.2 |
| B | 12 | 111 | 2848 | 100.04 | 134 | 131 | 27.2 |
| C | 14 | 238 | 19858 | 625.77 | 128 | 129 | 31.5 |
| C | 5 | 218 | 3644 | 111.49 | 128 | 129 | 31.5 |
| C | 3 | 233 | 2402 | 72.1 | 128 | 129 | 31.5 |
| D | 2 | 165 | 22297 | 674.57 | 128 | 124 | 32.9 |
| D | 1 | 52 | 14608 | 440.64 | 128 | 124 | 32.9 |
| D | 2 | 152 | 14220 | 428.84 | 128 | 124 | 32.9 |
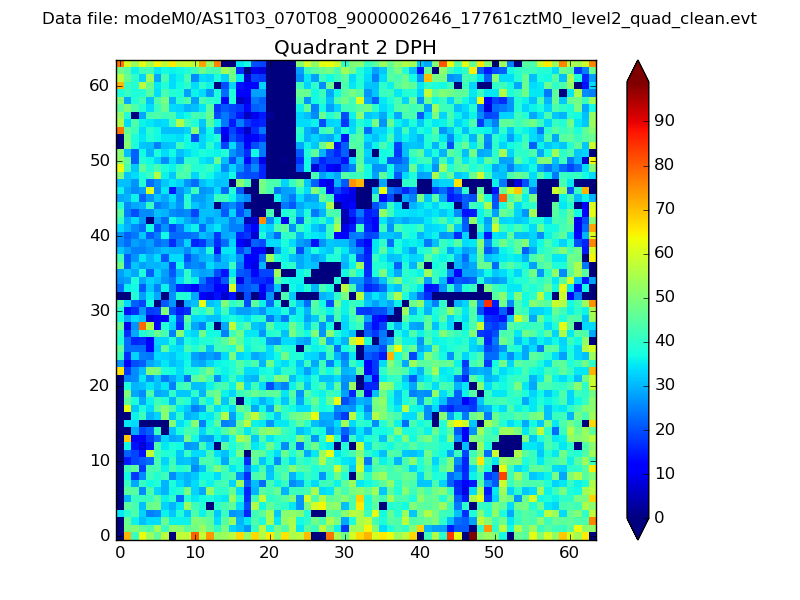
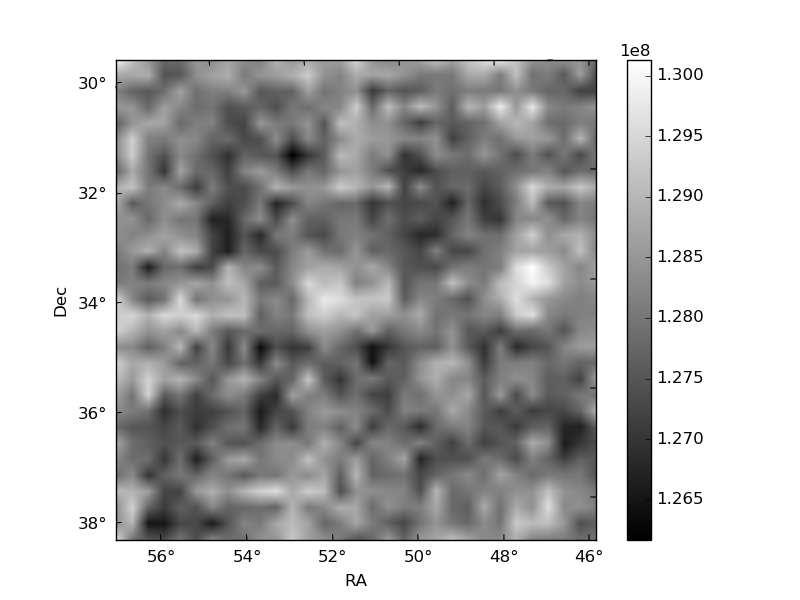
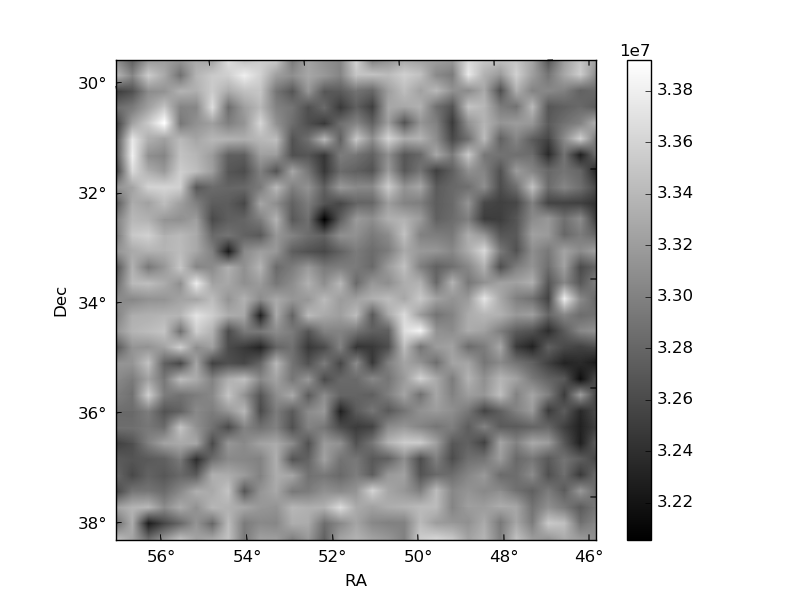
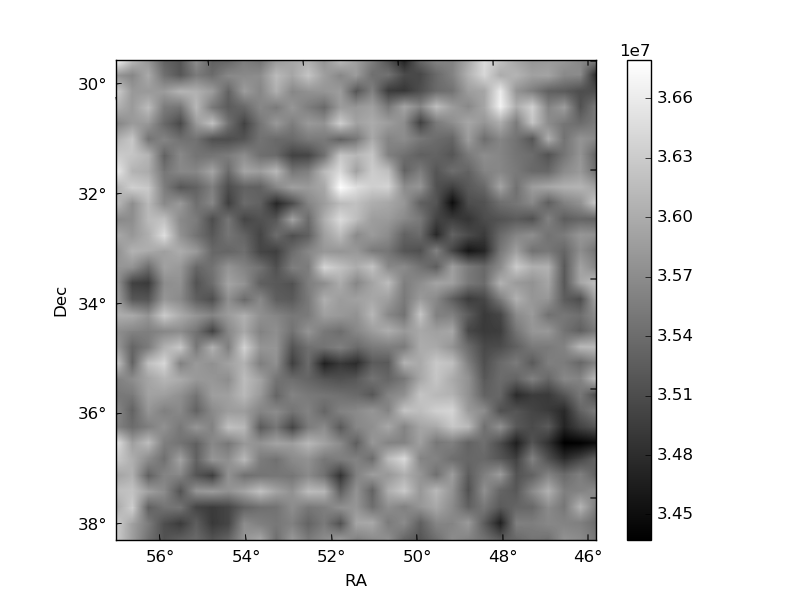
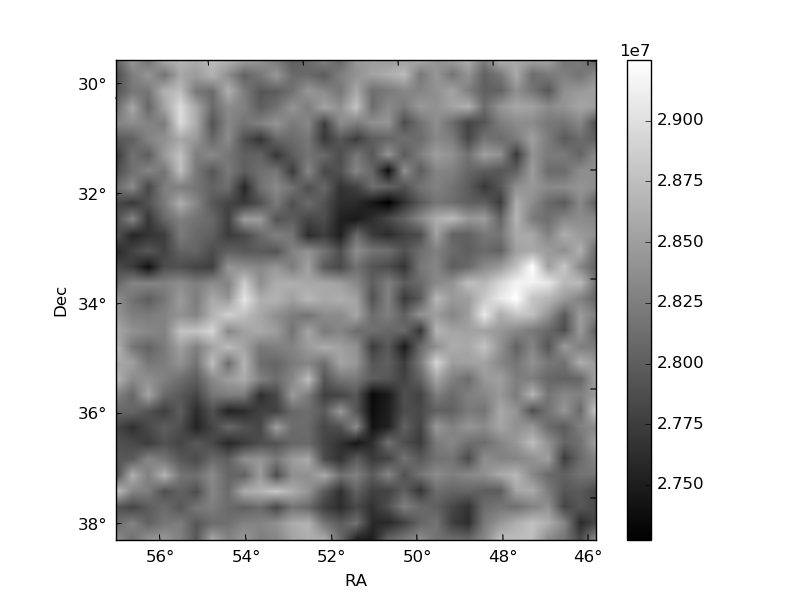
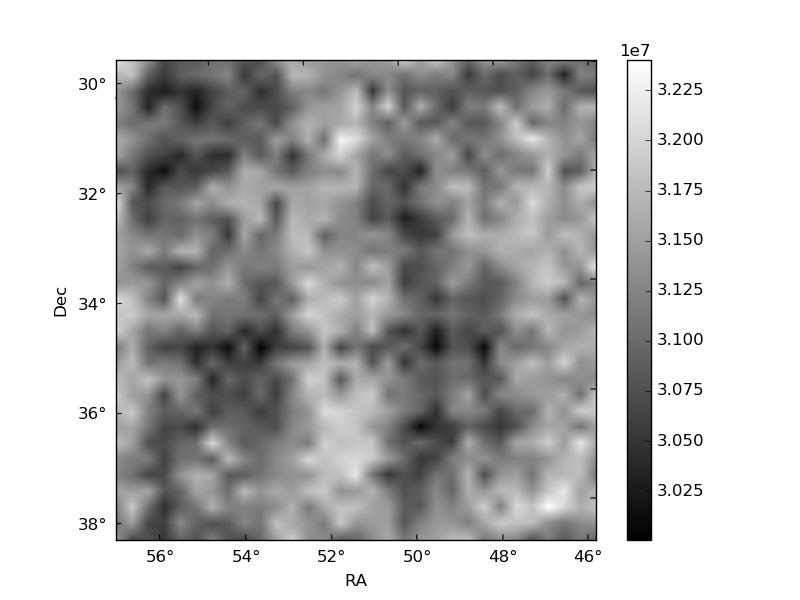
Histogram calculated using DETX and DETY for each event in the final _common_clean file
| Quadrant A | 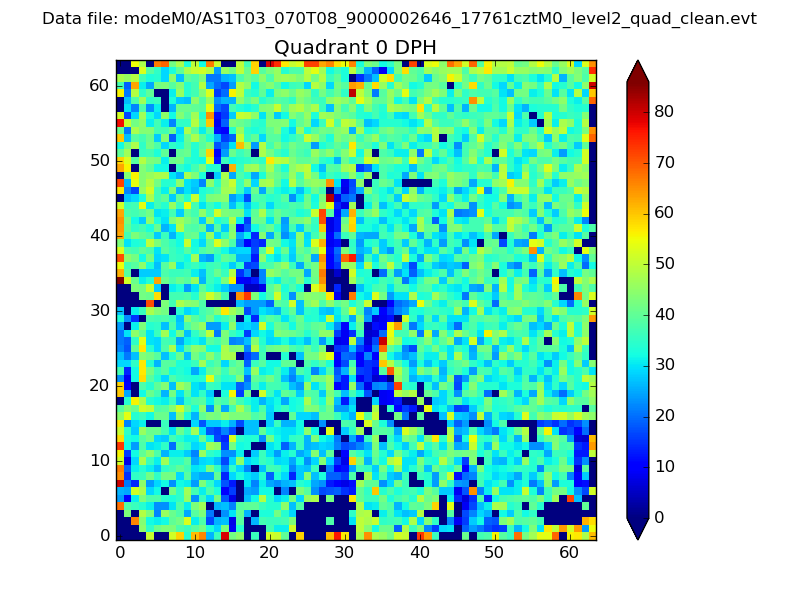 |
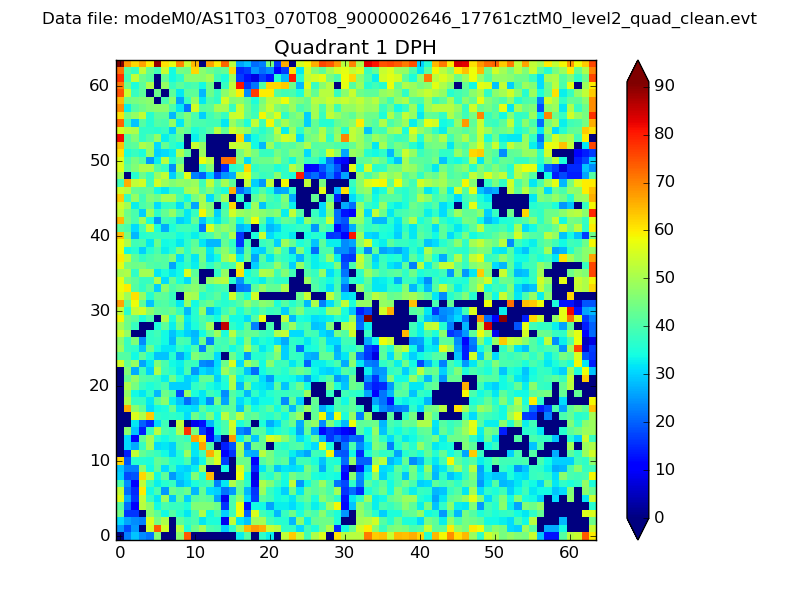 |
Quadrant B |
|---|---|---|---|
| Quadrant D | 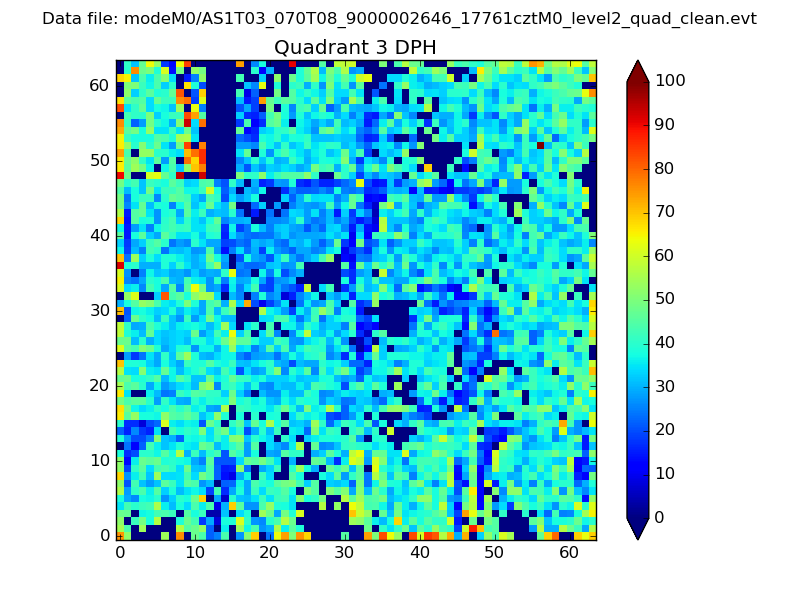 |
 |
Quadrant C |
| Plot type | Count rate plots | Images |
|---|---|---|
| Comparison with Poisson distribution Blue bars denote a histogram of data divided into 1 sec bins. Red curve is a Poisson curve with rate = median count rate of data. |
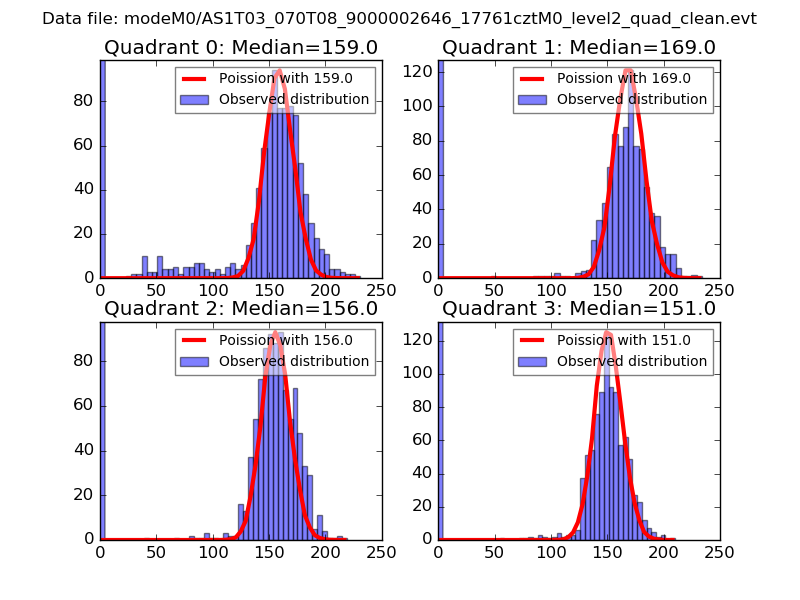 |
 |
| Quadrant-wise count rates Data is divided into 100 sec bins |
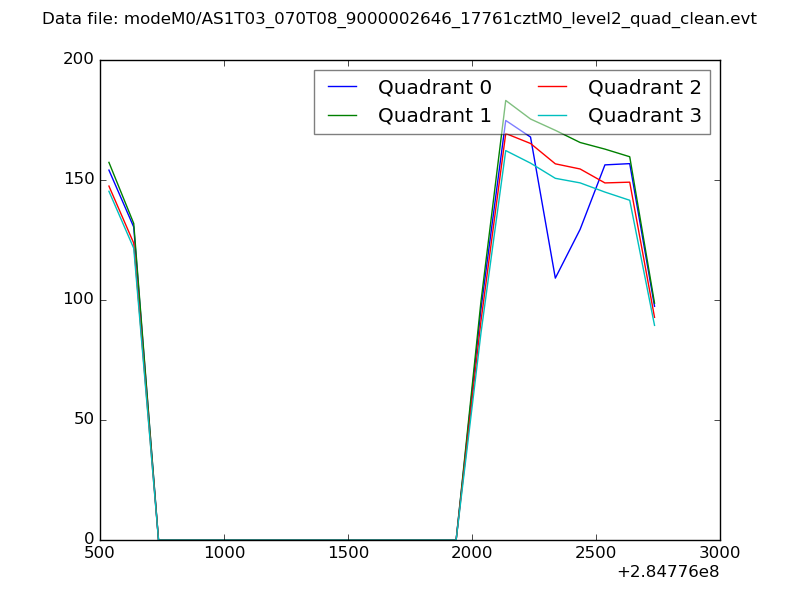 |
|
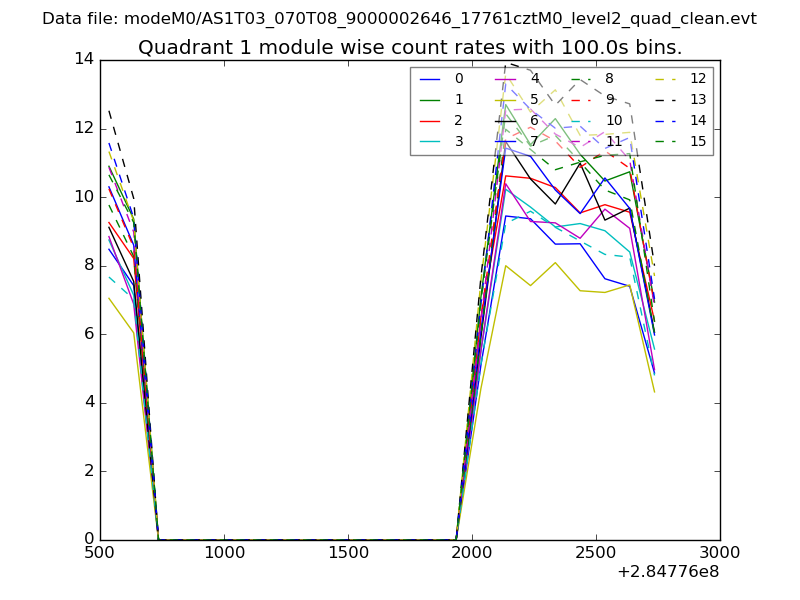
| Module-wise count rates for Quadrant A Data is divided into 100 sec bins |
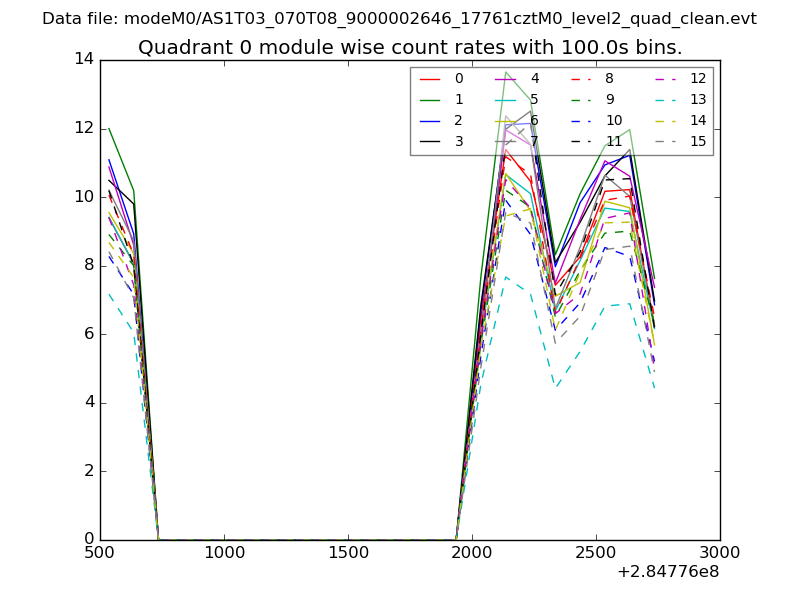 |
 |
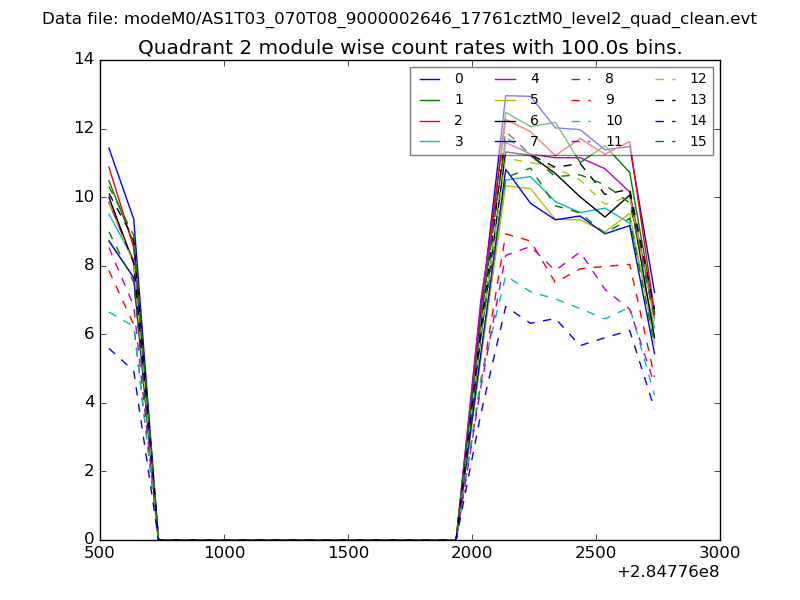
| Module-wise count rates for Quadrant B Data is divided into 100 sec bins |
 |
 |
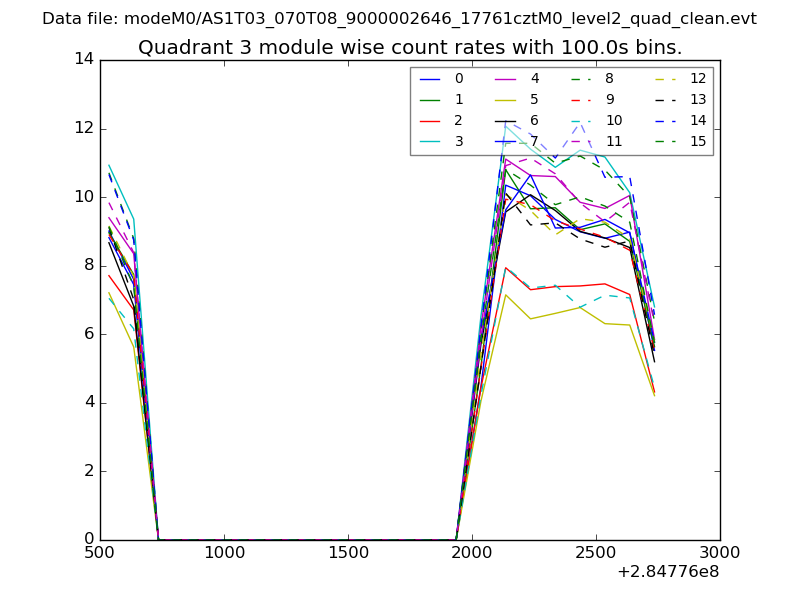
| Module-wise count rates for Quadrant C Data is divided into 100 sec bins |
 |
 |
| Module-wise count rates for Quadrant D Data is divided into 100 sec bins |
 |
 |
| Parameter | Plot |
|---|---|
| CZT HV Monitor | 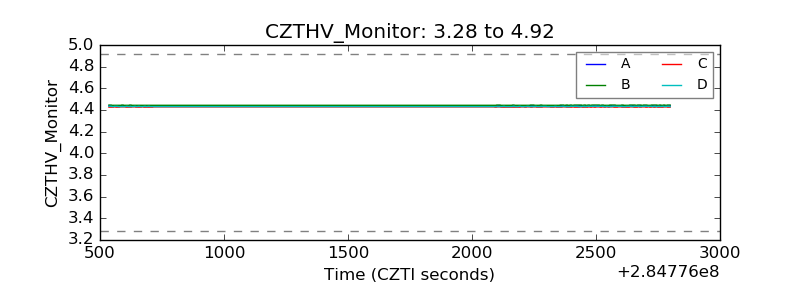 |
| D_VDD | 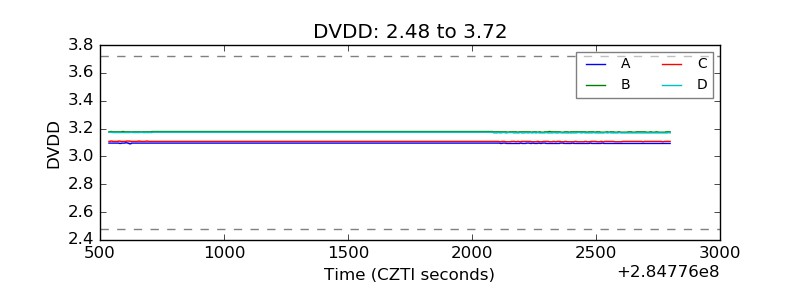 |
| Temperature 1 | 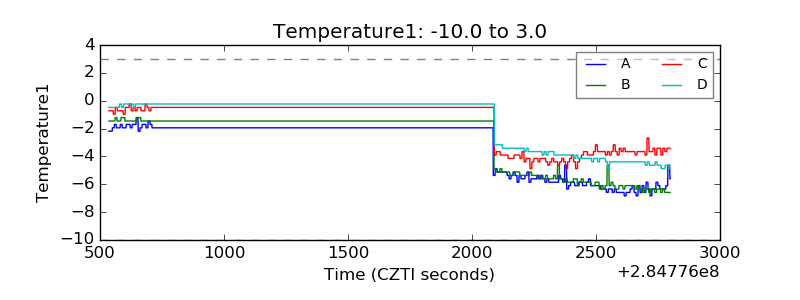 |
| Veto HV Monitor | 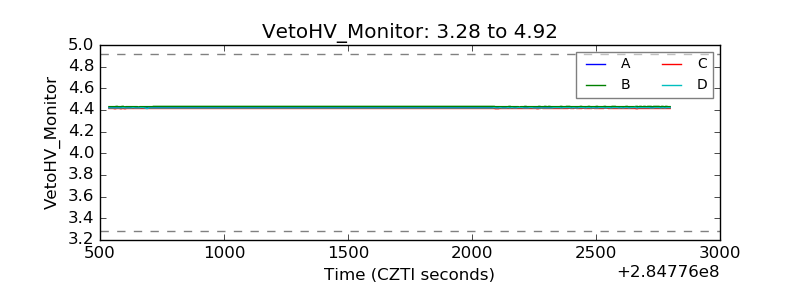 |
| Veto LLD | 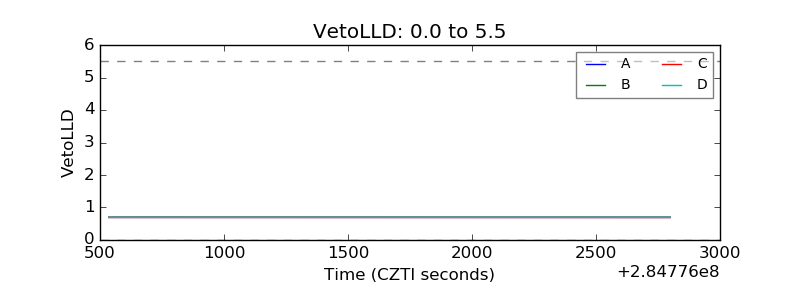 |
| Alpha Counter | 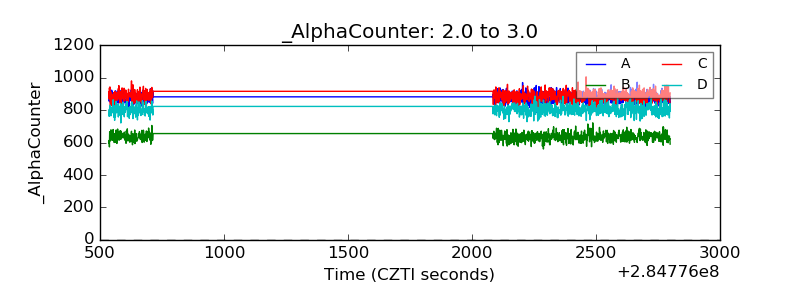 |
| _CPM_Rate | 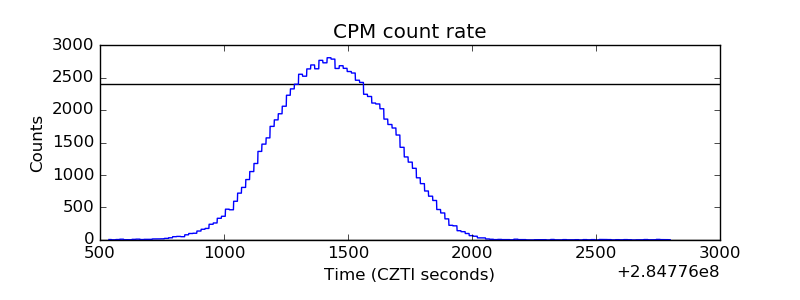 |
| CZT Counter | 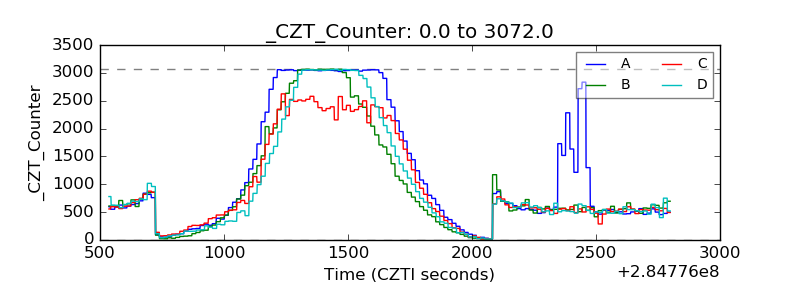 |
| +2.5 Volts monitor |  |
| +5 Volts monitor |  |
| _ROLL_ROT | 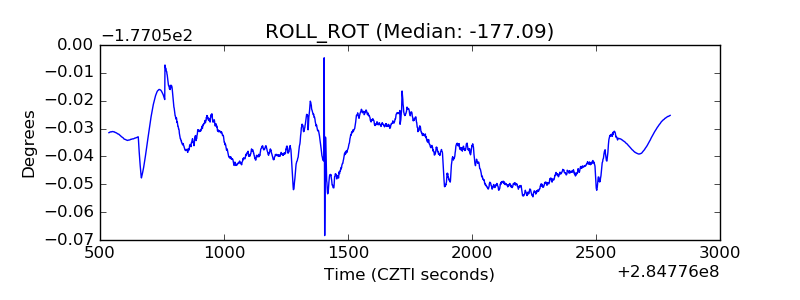 |
| _Roll_DEC | 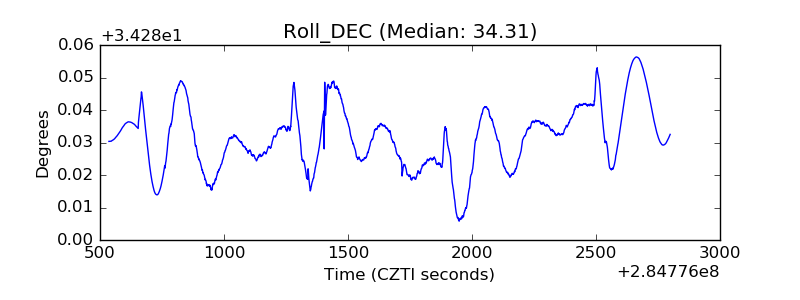 |
| _Roll_RA | 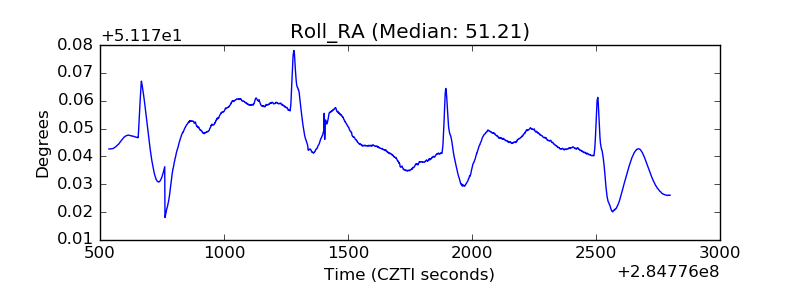 |
| Veto Counter | 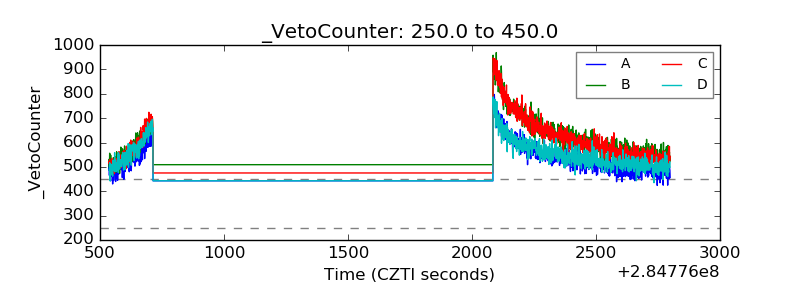 |