| Param | Original file | Final file |
|---|---|---|
| Filename | modeM0/AS1A05_015T01_9000002650_17764cztM0_level2.evt | modeM0/AS1A05_015T01_9000002650_17764cztM0_level2_quad_clean.evt |
| Size (bytes) | 129,476,160 | 32,175,360 |
| Size | 123.5 MB | 30.7 MB |
| Events in quadrant A | 931,159 | 210,633 |
| Events in quadrant B | 962,498 | 218,363 |
| Events in quadrant C | 943,375 | 207,439 |
| Events in quadrant D | 958,278 | 205,125 |
| Mode SS | |||
|---|---|---|---|
| Quadrant | BADHDUFLAG | Total packets | Discarded packets |
| A | 0 | 40 | 4 |
| B | 0 | 40 | 4 |
| C | 0 | 40 | 4 |
| D | 0 | 40 | 6 |
| Mode M9 | |||
|---|---|---|---|
| Quadrant | BADHDUFLAG | Total packets | Discarded packets |
| A | 0 | 1 | 0 |
| B | 0 | 1 | 0 |
| C | 0 | 1 | 0 |
| D | 0 | 1 | 0 |
| Mode M0 | |||
|---|---|---|---|
| Quadrant | BADHDUFLAG | Total packets | Discarded packets |
| A | 0 | 4257 | 220 |
| B | 0 | 4290 | 211 |
| C | 0 | 4251 | 220 |
| D | 0 | 4345 | 227 |
| Quadrant | Total seconds | Saturated seconds | Saturation percentage |
|---|---|---|---|
| A | 1812 | 269 | 14.845475% |
| B | 1819 | 272 | 14.953271% |
| C | 1815 | 250 | 13.774105% |
| D | 1814 | 224 | 12.348401% |
Noise dominated data is calculated using 1-second bins in cleaned event files. If a bin has >2000 counts, and if more than 50% of those come from <1% of pixels, then it is considered to be noise-dominated and hence unusable.
| Quadrant | # 1 sec bins | Bins with >0 counts | Bins with >2000 counts | High rate bins dominated by noise | Noise dominated (total time) | Noise dominated (detector-on time) | Marked lightcurve |
|---|---|---|---|---|---|---|---|
| A | 1949 | 1893 | 0 | 0 | 0.00% | 0.00% | 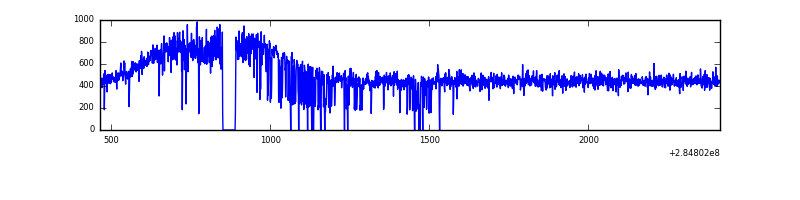 |
| B | 1949 | 1896 | 0 | 0 | 0.00% | 0.00% | 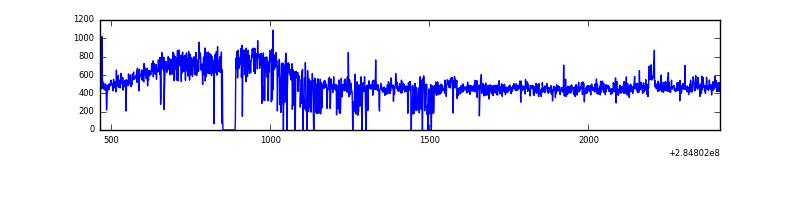 |
| C | 1949 | 1893 | 0 | 0 | 0.00% | 0.00% | 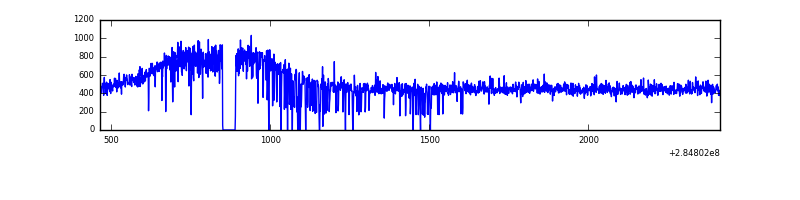 |
| D | 1949 | 1890 | 4 | 4 | 0.21% | 0.21% | 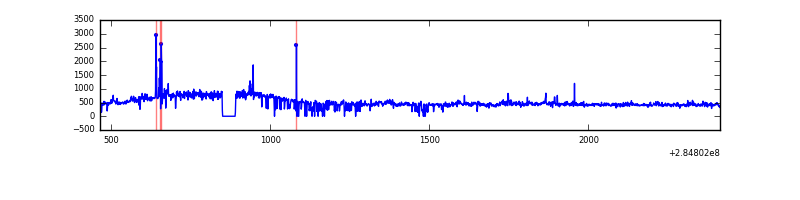 |
Top three noisy pixels from each quadrant. If the there are fewer than three noisy pixels in the level2.evt file, extra rows are filled as -1
| Pixel properties | Quadrant properties | ||||||
|---|---|---|---|---|---|---|---|
| Quadrant | DetID | PixID | Counts | Sigma | Mean | Median | Sigma |
| A | 0 | 226 | 2114 | 35.84 | 242 | 235 | 52.4 |
| A | 3 | 137 | 1976 | 33.21 | 242 | 235 | 52.4 |
| A | 12 | 194 | 1937 | 32.46 | 242 | 235 | 52.4 |
| B | 0 | 189 | 20633 | 410.01 | 239 | 230 | 49.8 |
| B | 12 | 111 | 5851 | 112.96 | 239 | 230 | 49.8 |
| B | 0 | 219 | 5798 | 111.89 | 239 | 230 | 49.8 |
| C | 14 | 238 | 33482 | 604.51 | 228 | 227 | 55.0 |
| C | 5 | 218 | 15691 | 281.1 | 228 | 227 | 55.0 |
| C | 13 | 61 | 1640 | 25.69 | 228 | 227 | 55.0 |
| D | 2 | 152 | 23922 | 401.95 | 236 | 228 | 58.9 |
| D | 2 | 120 | 16215 | 271.21 | 236 | 228 | 58.9 |
| D | 10 | 70 | 10023 | 166.17 | 236 | 228 | 58.9 |
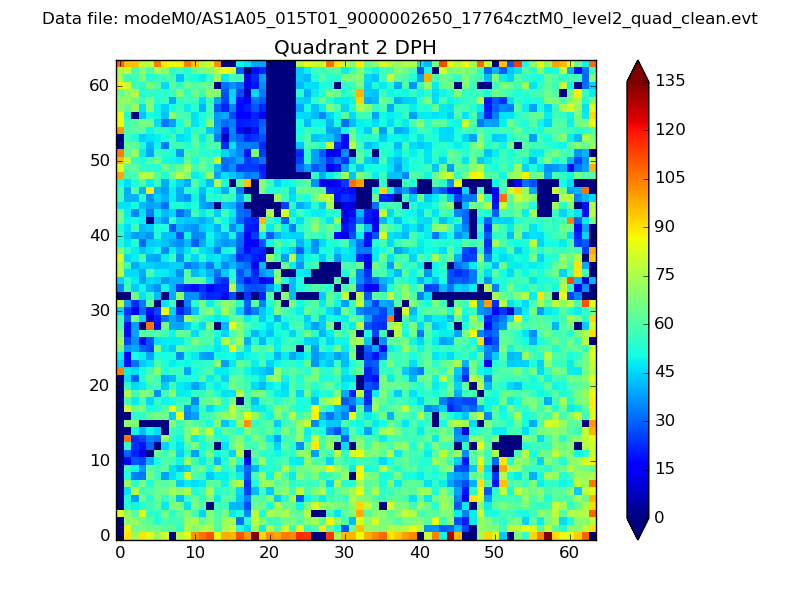
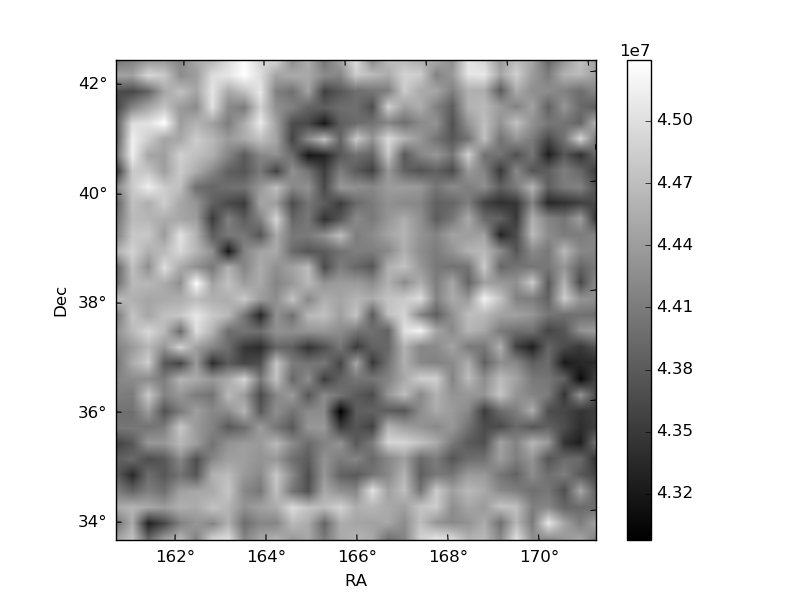
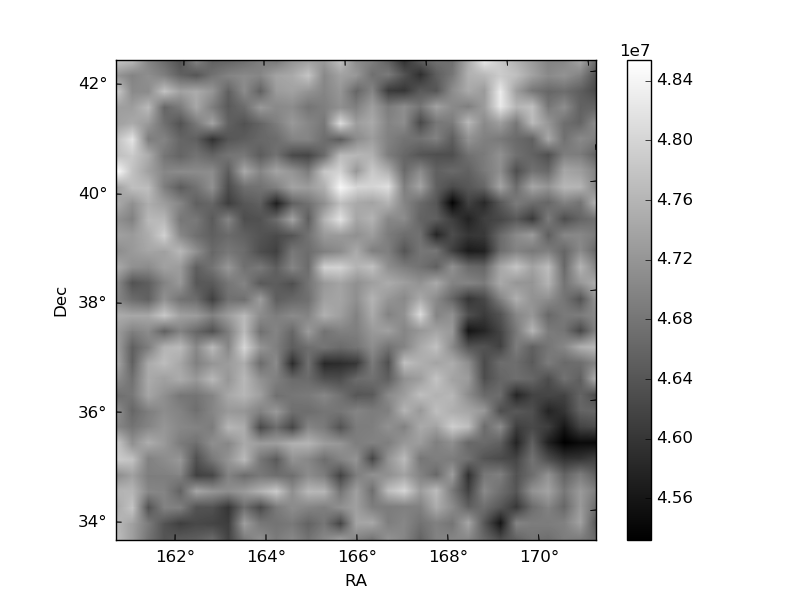
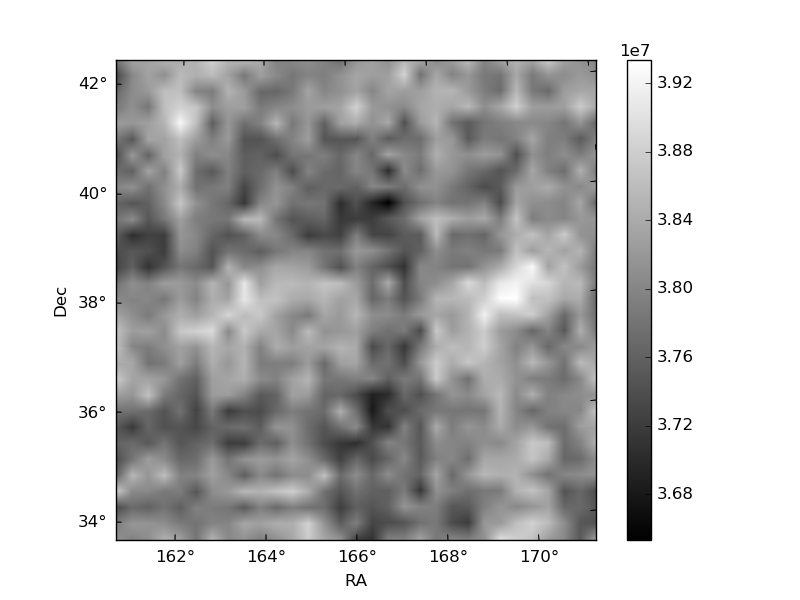
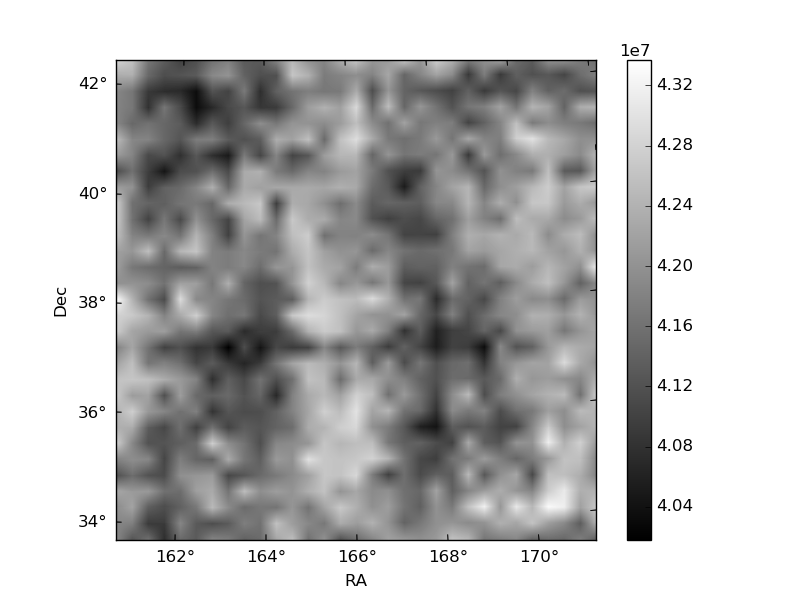
Histogram calculated using DETX and DETY for each event in the final _common_clean file
| Quadrant A | 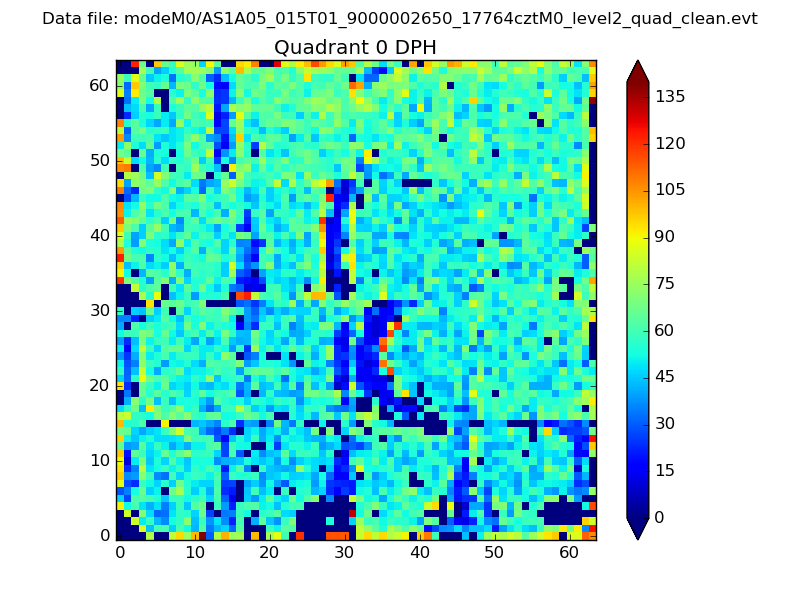 |
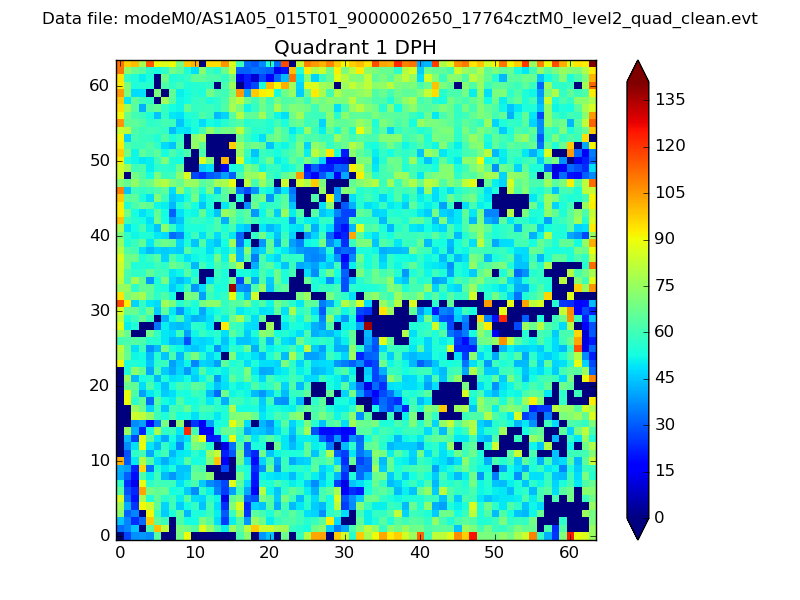 |
Quadrant B |
|---|---|---|---|
| Quadrant D | 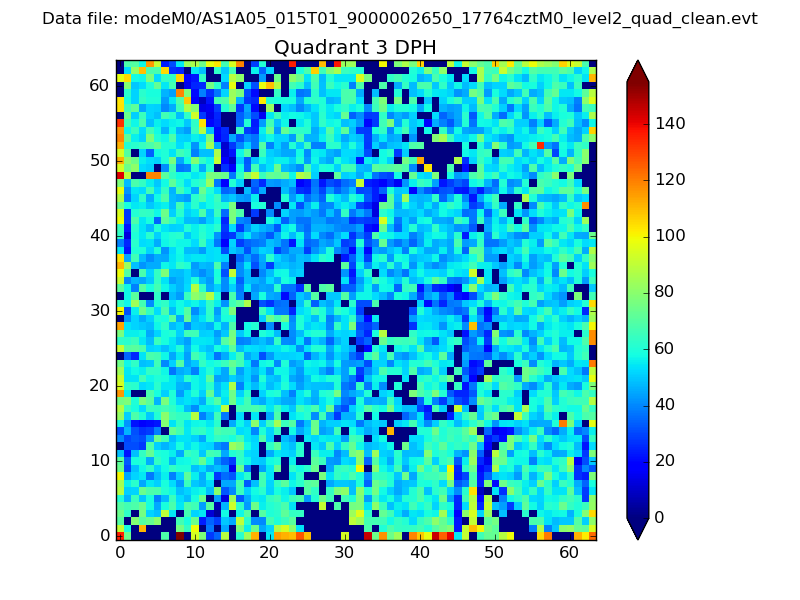 |
 |
Quadrant C |
| Plot type | Count rate plots | Images |
|---|---|---|
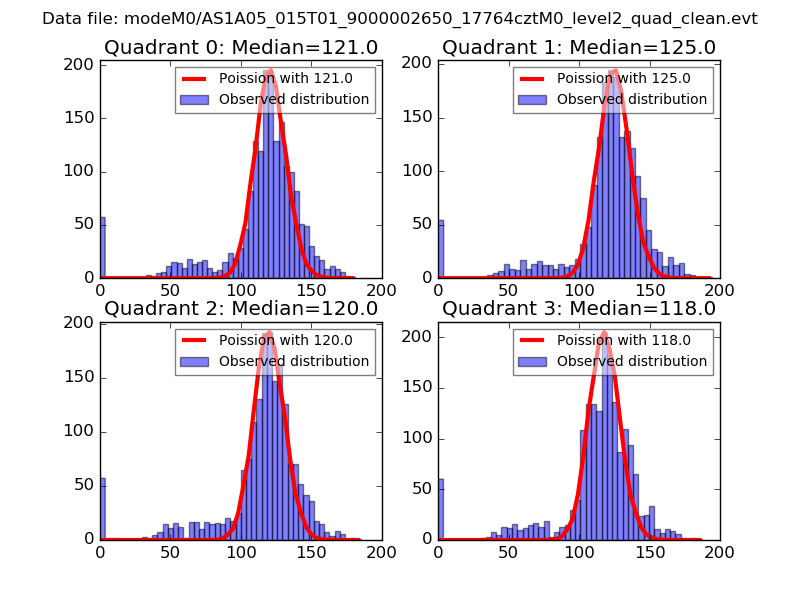
| Comparison with Poisson distribution Blue bars denote a histogram of data divided into 1 sec bins. Red curve is a Poisson curve with rate = median count rate of data. |
 |
 |
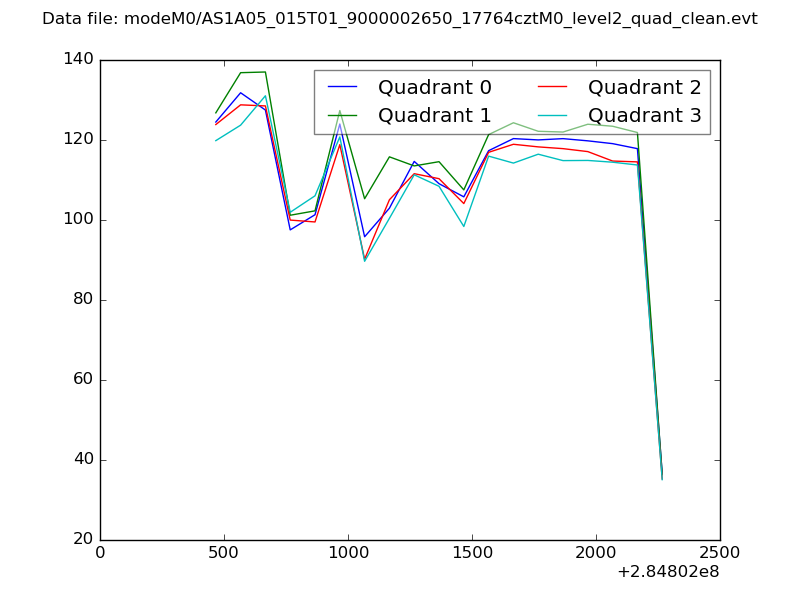
| Quadrant-wise count rates Data is divided into 100 sec bins |
 |
|
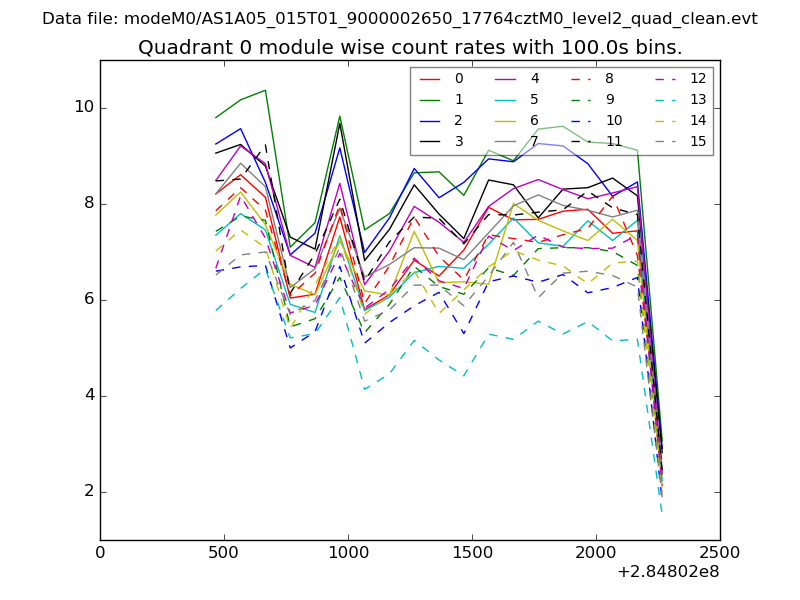
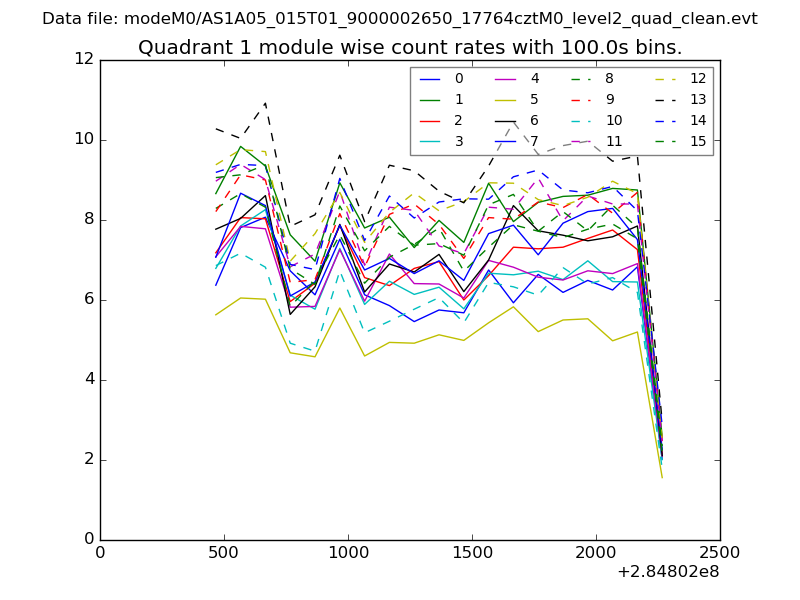
| Module-wise count rates for Quadrant A Data is divided into 100 sec bins |
 |
 |
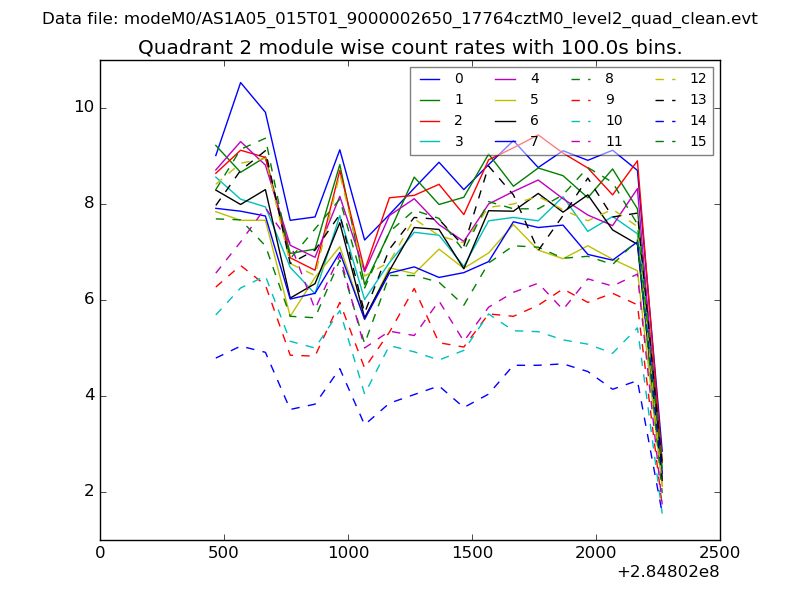
| Module-wise count rates for Quadrant B Data is divided into 100 sec bins |
 |
 |
| Module-wise count rates for Quadrant C Data is divided into 100 sec bins |
 |
 |
| Module-wise count rates for Quadrant D Data is divided into 100 sec bins |
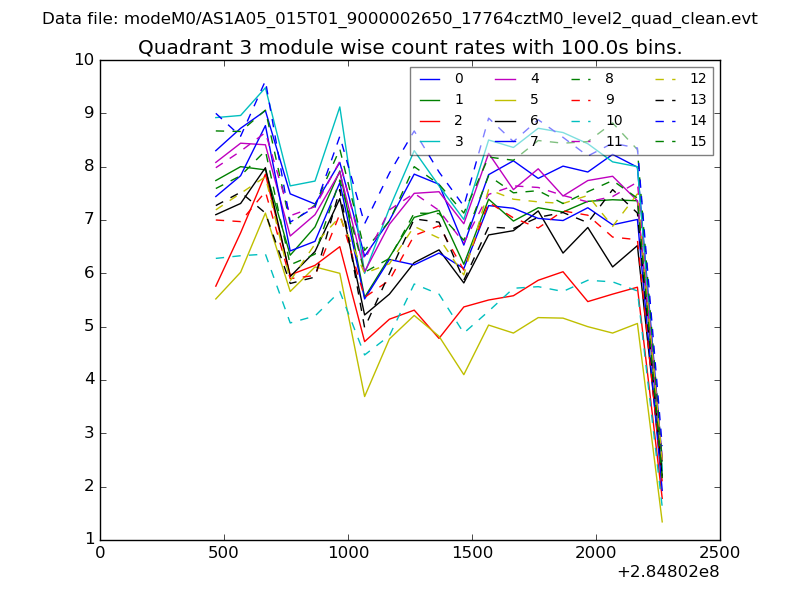 |
 |
| Parameter | Plot |
|---|---|
| CZT HV Monitor | 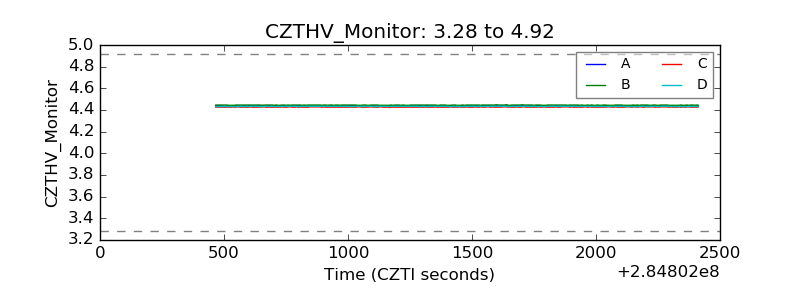 |
| D_VDD | 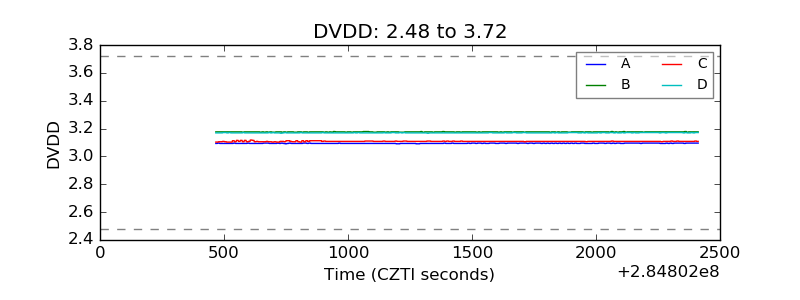 |
| Temperature 1 | 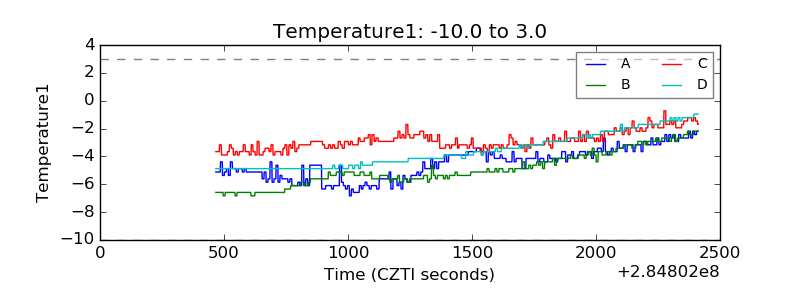 |
| Veto HV Monitor | 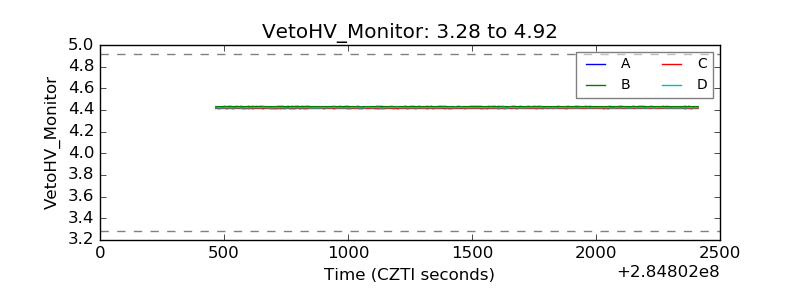 |
| Veto LLD | 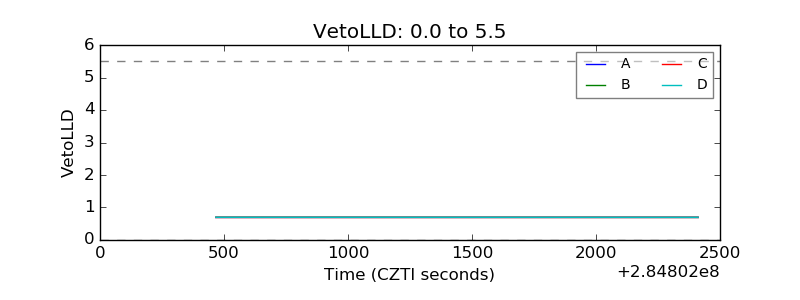 |
| Alpha Counter | 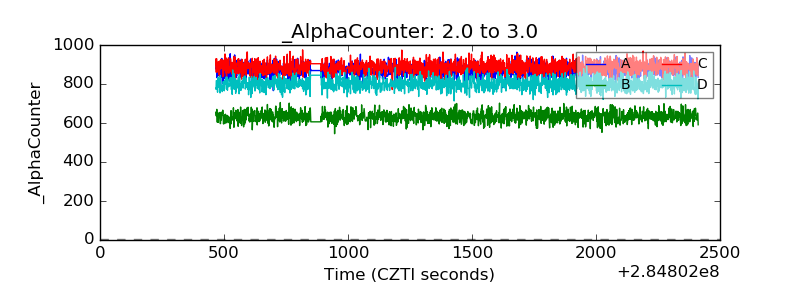 |
| _CPM_Rate | 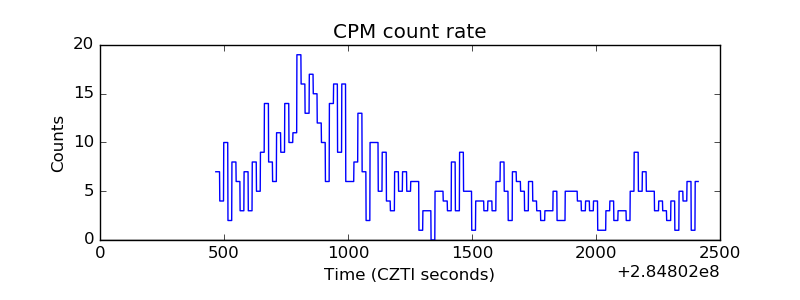 |
| CZT Counter | 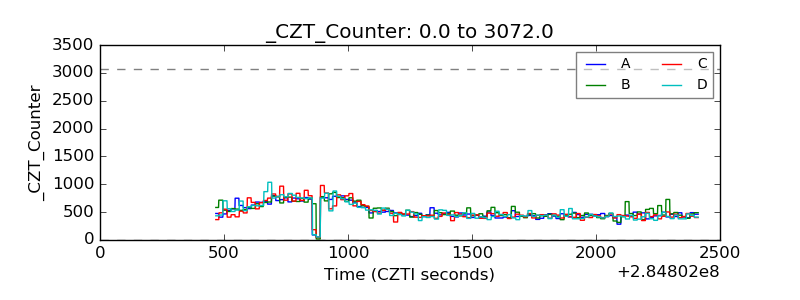 |
| +2.5 Volts monitor | 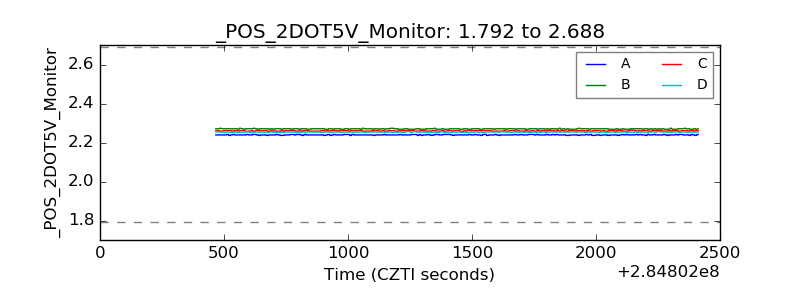 |
| +5 Volts monitor | 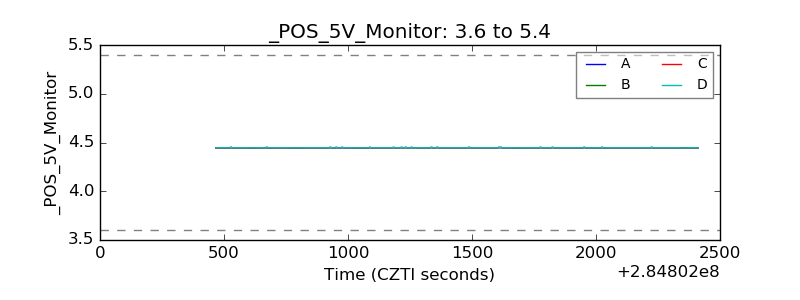 |
| _ROLL_ROT | 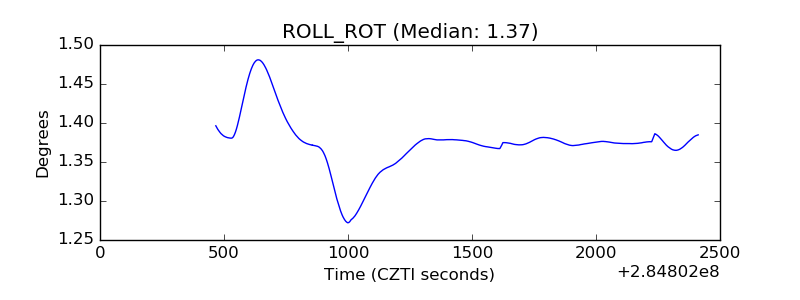 |
| _Roll_DEC | 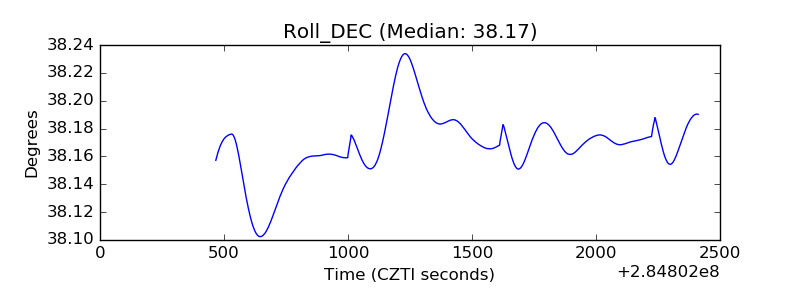 |
| _Roll_RA | 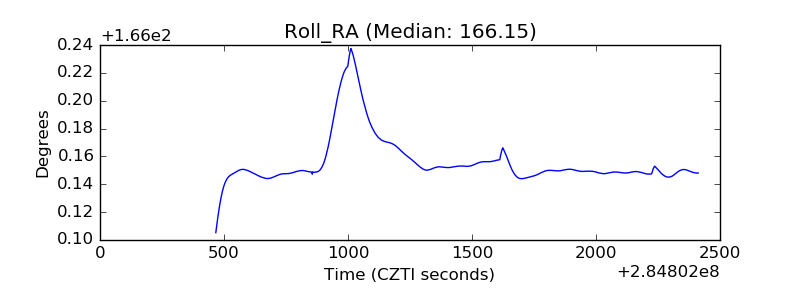 |
| Veto Counter | 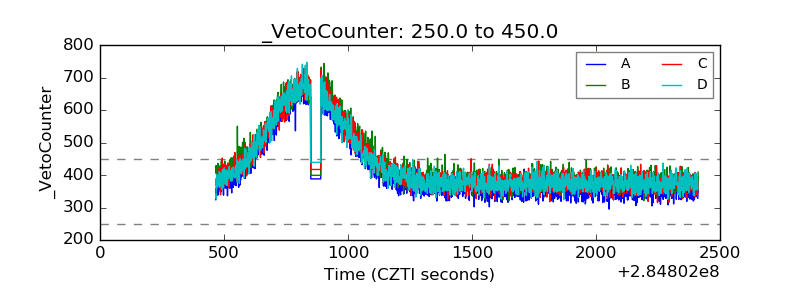 |