| Param | Original file | Final file |
|---|---|---|
| Filename | modeM0/AS1A05_015T01_9000002650_17765cztM0_level2.evt | modeM0/AS1A05_015T01_9000002650_17765cztM0_level2_quad_clean.evt |
| Size (bytes) | 341,576,640 | 49,429,440 |
| Size | 325.8 MB | 47.1 MB |
| Events in quadrant A | 2,297,662 | 293,066 |
| Events in quadrant B | 2,574,671 | 304,427 |
| Events in quadrant C | 2,526,017 | 280,539 |
| Events in quadrant D | 2,623,571 | 285,735 |
| Mode SS | |||
|---|---|---|---|
| Quadrant | BADHDUFLAG | Total packets | Discarded packets |
| A | 0 | 109 | 15 |
| B | 0 | 109 | 15 |
| C | 0 | 110 | 18 |
| D | 0 | 111 | 17 |
| Mode M0 | |||
|---|---|---|---|
| Quadrant | BADHDUFLAG | Total packets | Discarded packets |
| A | 0 | 11496 | 1499 |
| B | 0 | 12209 | 1515 |
| C | 0 | 12447 | 1920 |
| D | 0 | 12936 | 1952 |
| Quadrant | Total seconds | Saturated seconds | Saturation percentage |
|---|---|---|---|
| A | 4735 | 303 | 6.399155% |
| B | 4746 | 321 | 6.763590% |
| C | 4705 | 378 | 8.034006% |
| D | 4725 | 314 | 6.645503% |
Noise dominated data is calculated using 1-second bins in cleaned event files. If a bin has >2000 counts, and if more than 50% of those come from <1% of pixels, then it is considered to be noise-dominated and hence unusable.
| Quadrant | # 1 sec bins | Bins with >0 counts | Bins with >2000 counts | High rate bins dominated by noise | Noise dominated (total time) | Noise dominated (detector-on time) | Marked lightcurve |
|---|---|---|---|---|---|---|---|
| A | 7753 | 4890 | 1 | 1 | 0.01% | 0.02% | 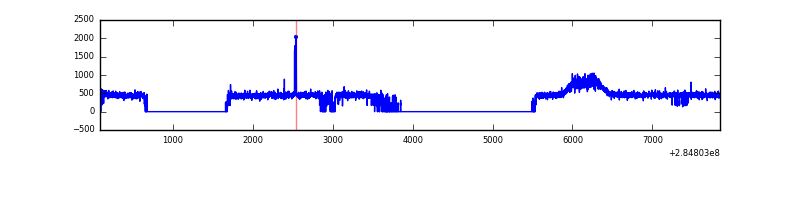 |
| B | 7759 | 4899 | 9 | 9 | 0.12% | 0.18% | 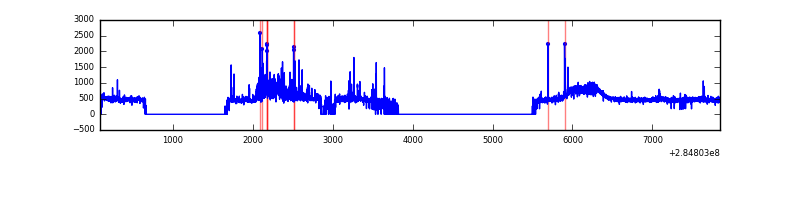 |
| C | 7757 | 4858 | 35 | 35 | 0.45% | 0.72% | 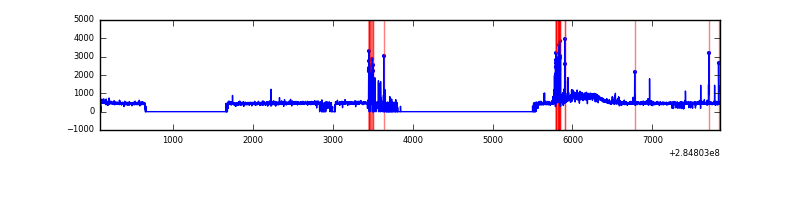 |
| D | 7754 | 4878 | 31 | 31 | 0.40% | 0.64% | 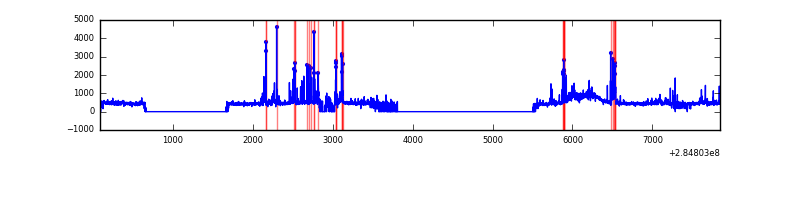 |
Top three noisy pixels from each quadrant. If the there are fewer than three noisy pixels in the level2.evt file, extra rows are filled as -1
| Pixel properties | Quadrant properties | ||||||
|---|---|---|---|---|---|---|---|
| Quadrant | DetID | PixID | Counts | Sigma | Mean | Median | Sigma |
| A | 15 | 174 | 18197 | 144.12 | 592 | 576 | 122.3 |
| A | 0 | 226 | 5084 | 36.87 | 592 | 576 | 122.3 |
| A | 3 | 137 | 4579 | 32.74 | 592 | 576 | 122.3 |
| B | 7 | 220 | 105856 | 904.98 | 588 | 569 | 116.3 |
| B | 15 | 35 | 67248 | 573.13 | 588 | 569 | 116.3 |
| B | 0 | 219 | 24663 | 207.1 | 588 | 569 | 116.3 |
| C | 4 | 254 | 222795 | 1686.56 | 555 | 557 | 131.8 |
| C | 14 | 238 | 83020 | 625.81 | 555 | 557 | 131.8 |
| C | 5 | 218 | 43614 | 326.76 | 555 | 557 | 131.8 |
| D | 1 | 52 | 190979 | 1376.98 | 574 | 558 | 138.3 |
| D | 7 | 238 | 112314 | 808.13 | 574 | 558 | 138.3 |
| D | 2 | 165 | 33400 | 237.49 | 574 | 558 | 138.3 |
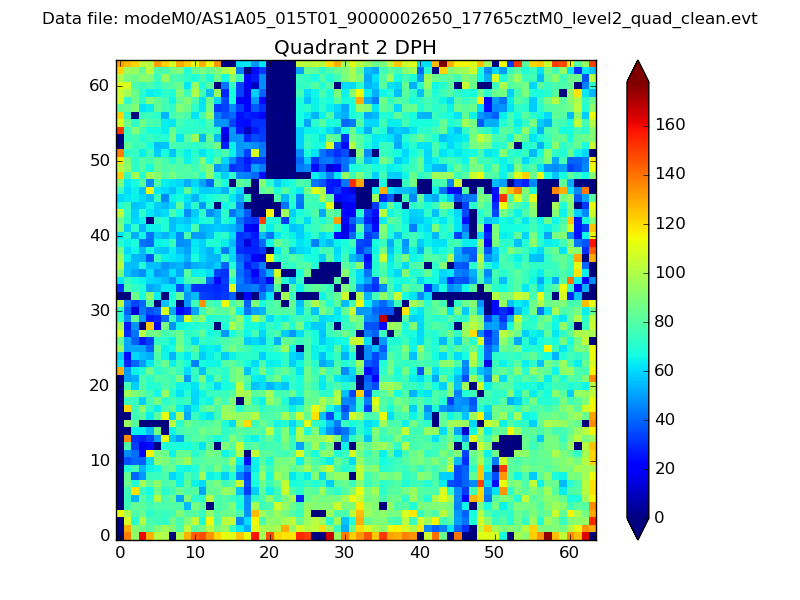
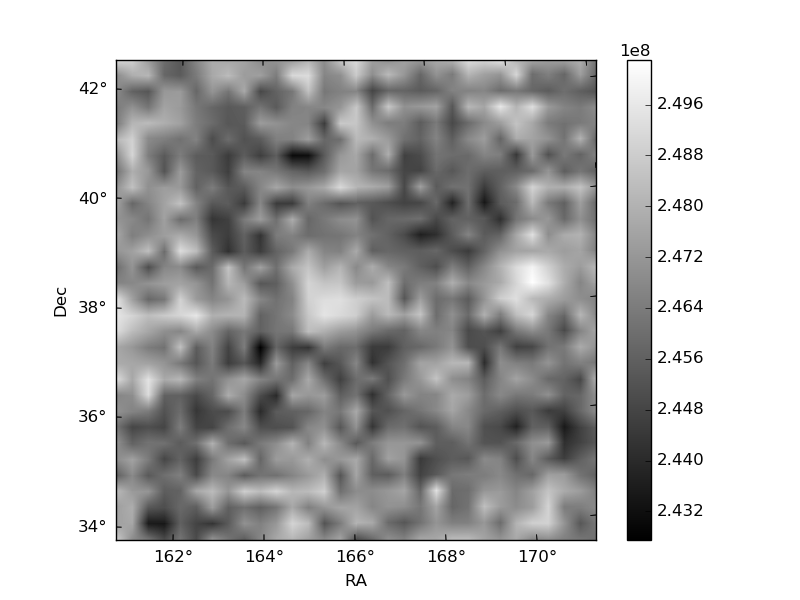
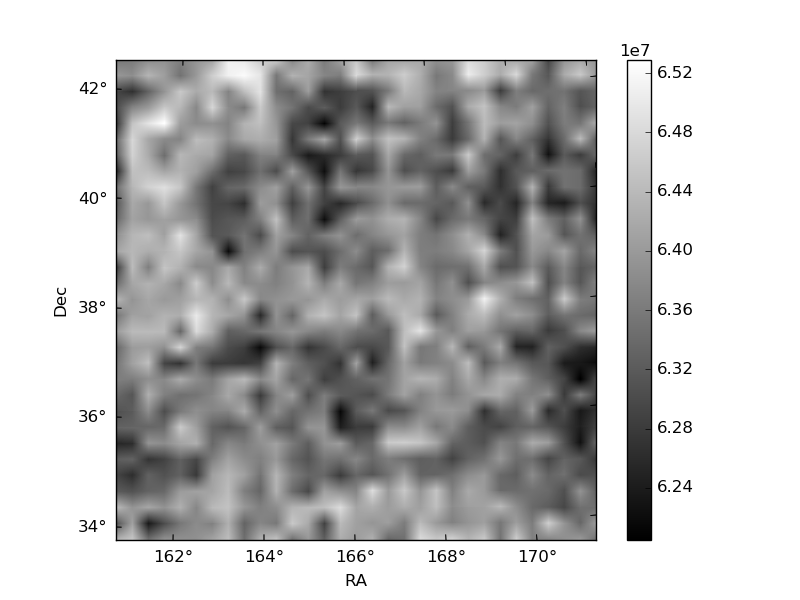
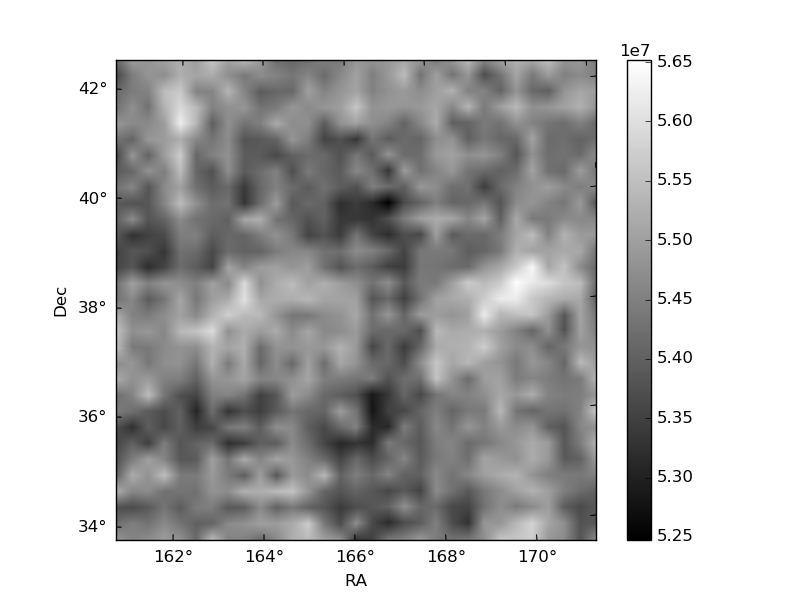
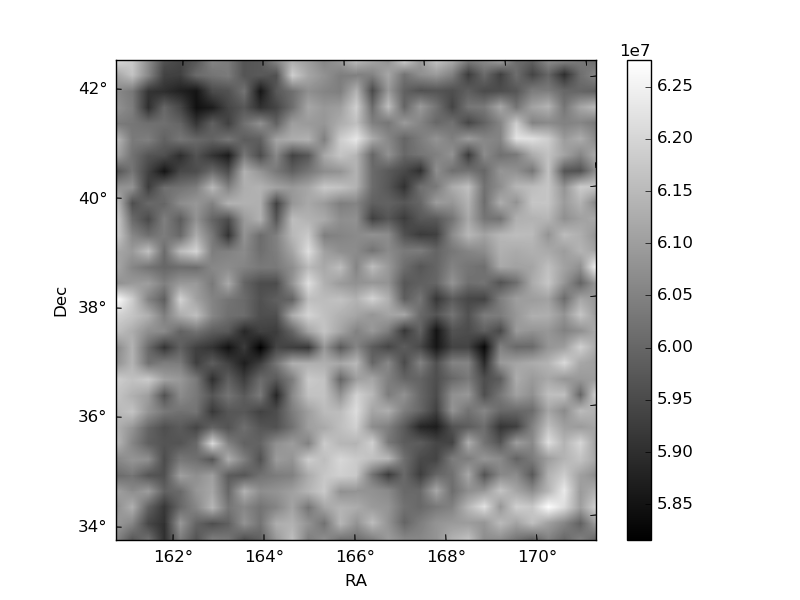
Histogram calculated using DETX and DETY for each event in the final _common_clean file
| Quadrant A | 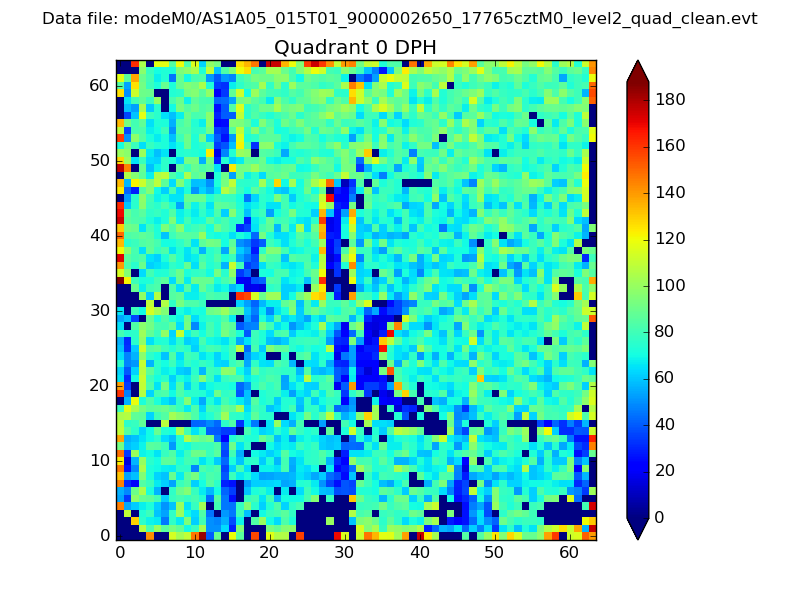 |
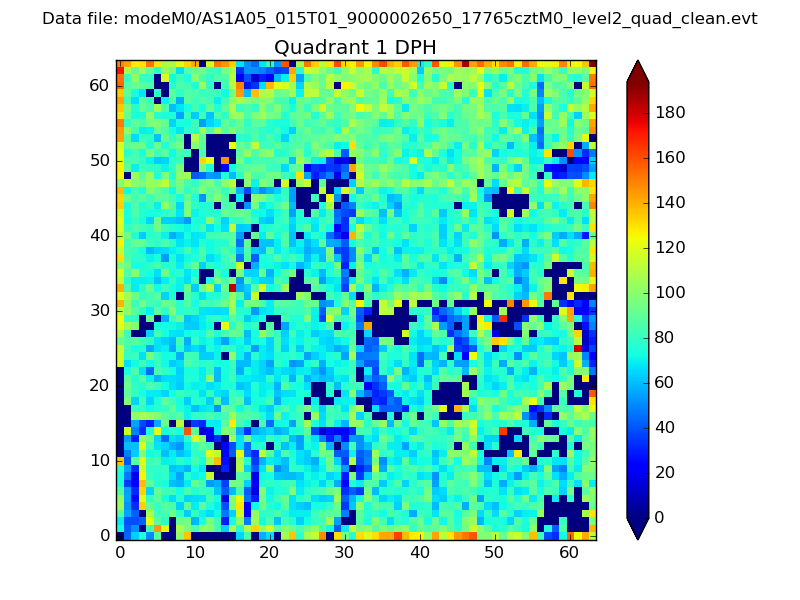 |
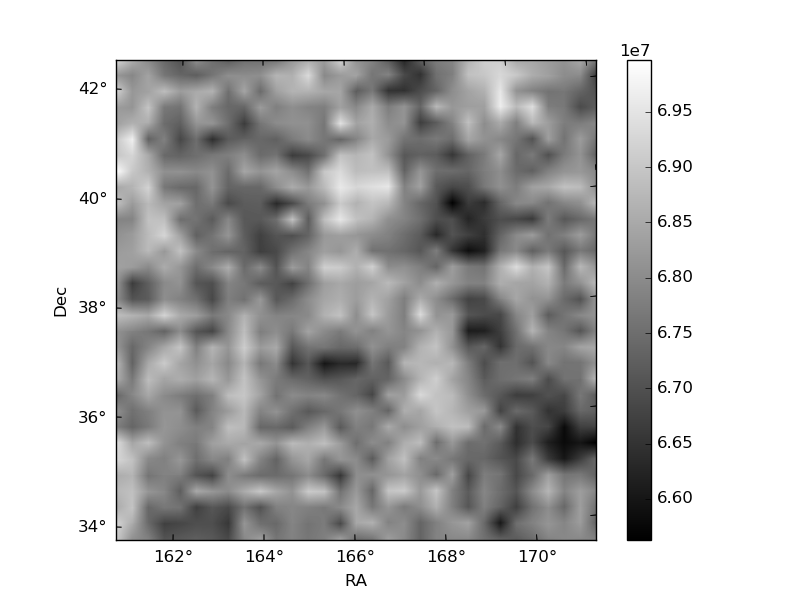
Quadrant B |
|---|---|---|---|
| Quadrant D | 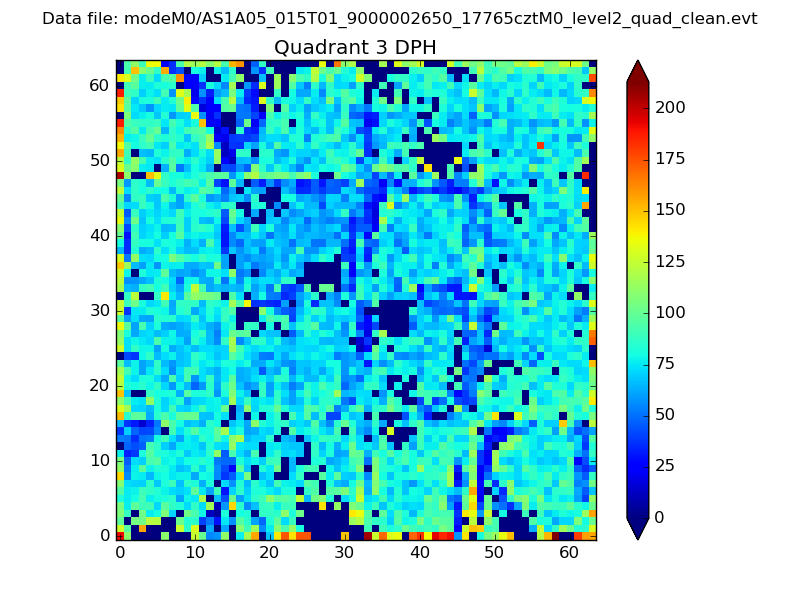 |
 |
Quadrant C |
| Plot type | Count rate plots | Images |
|---|---|---|
| Comparison with Poisson distribution Blue bars denote a histogram of data divided into 1 sec bins. Red curve is a Poisson curve with rate = median count rate of data. |
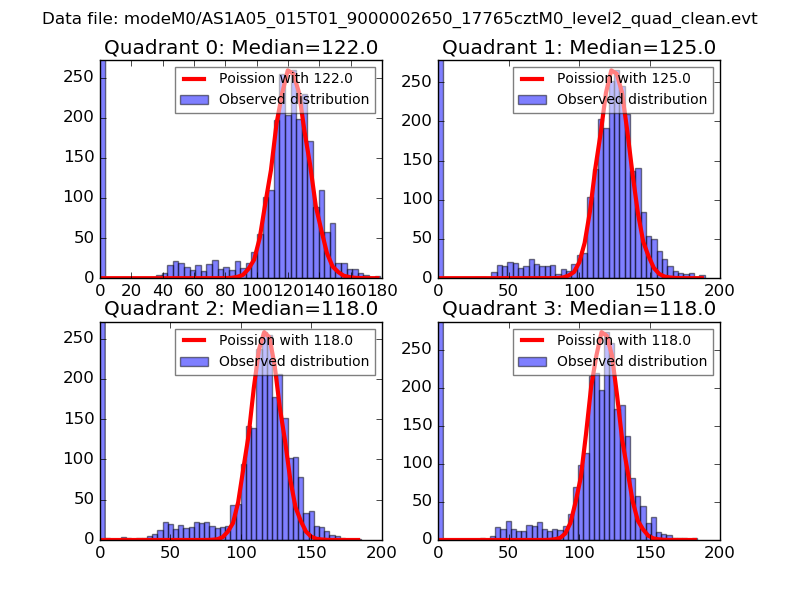 |
 |
| Quadrant-wise count rates Data is divided into 100 sec bins |
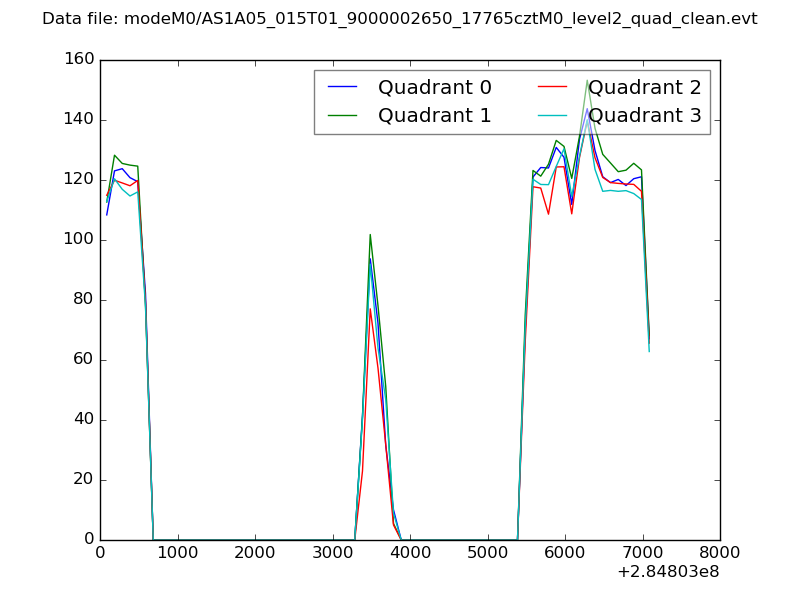 |
|
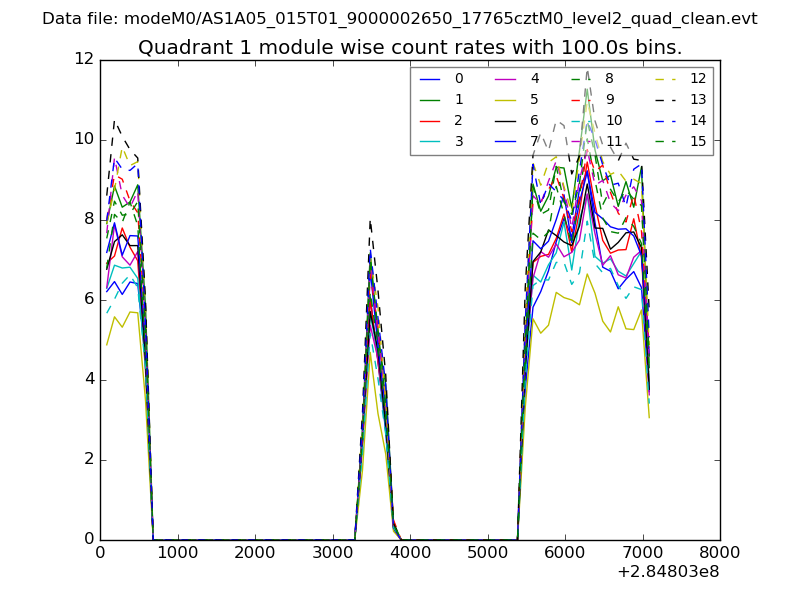
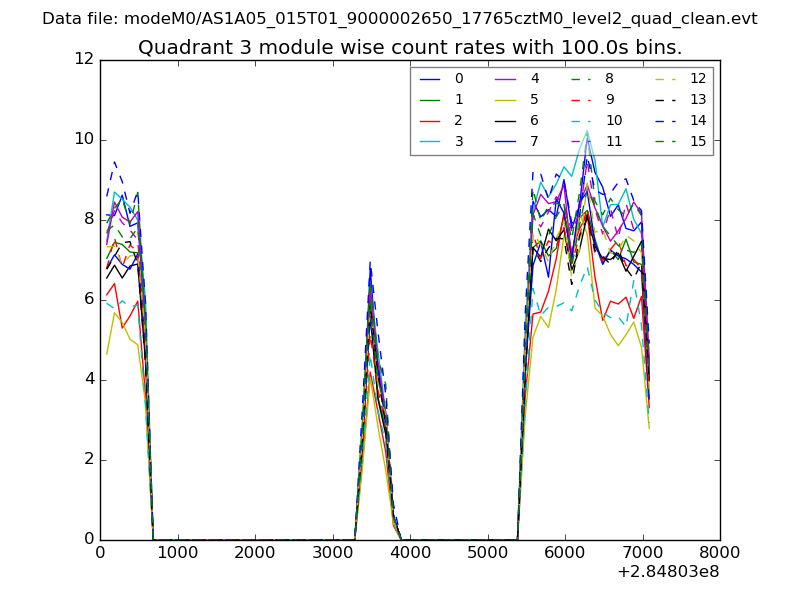
| Module-wise count rates for Quadrant A Data is divided into 100 sec bins |
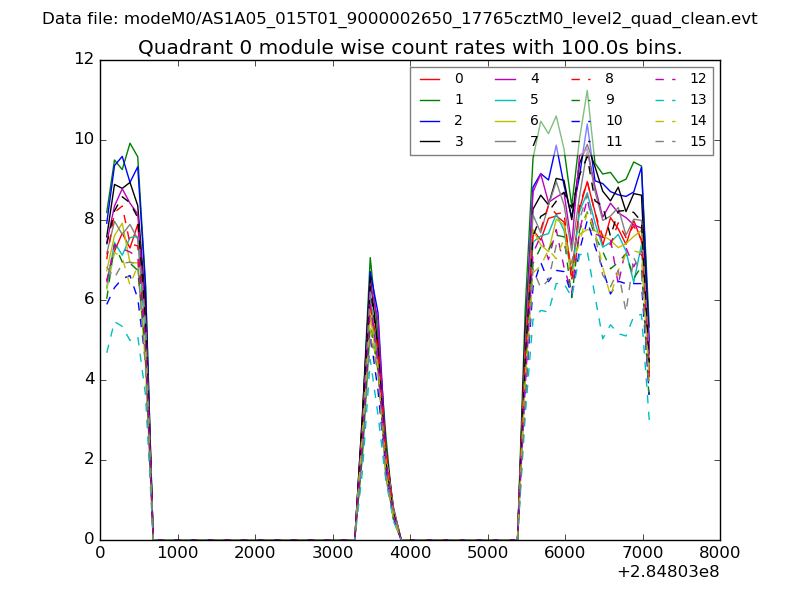 |
 |
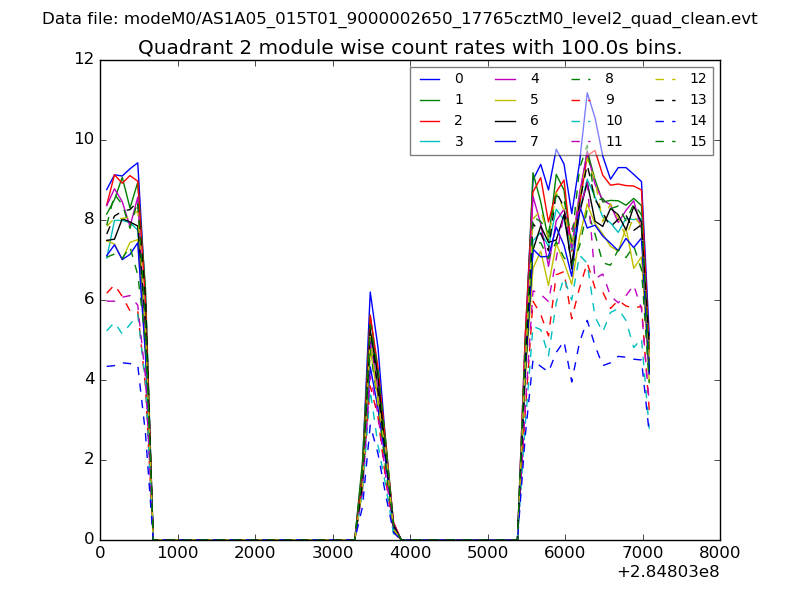
| Module-wise count rates for Quadrant B Data is divided into 100 sec bins |
 |
 |
| Module-wise count rates for Quadrant C Data is divided into 100 sec bins |
 |
 |
| Module-wise count rates for Quadrant D Data is divided into 100 sec bins |
 |
 |
| Parameter | Plot |
|---|---|
| CZT HV Monitor | 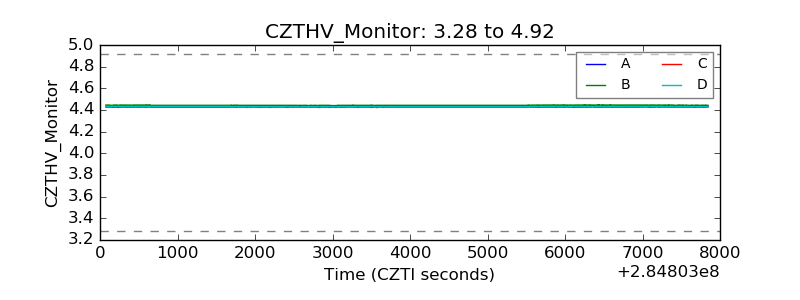 |
| D_VDD | 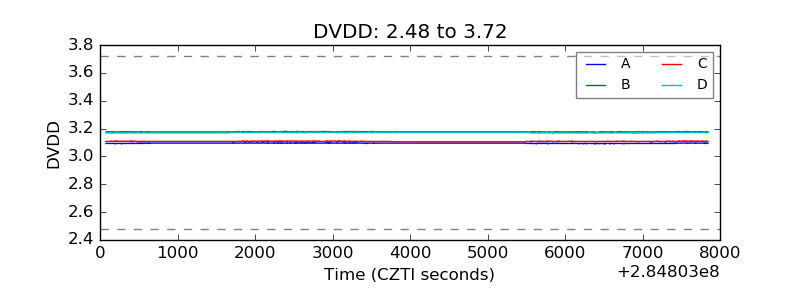 |
| Temperature 1 | 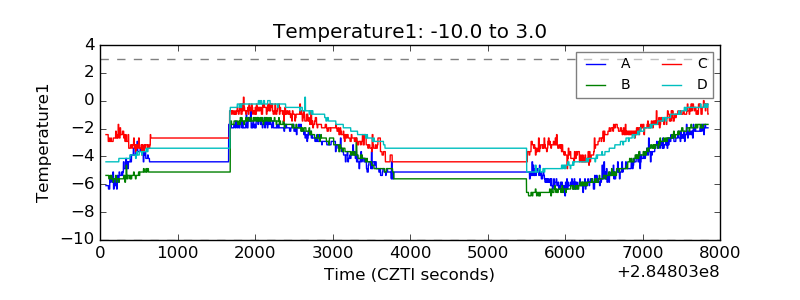 |
| Veto HV Monitor | 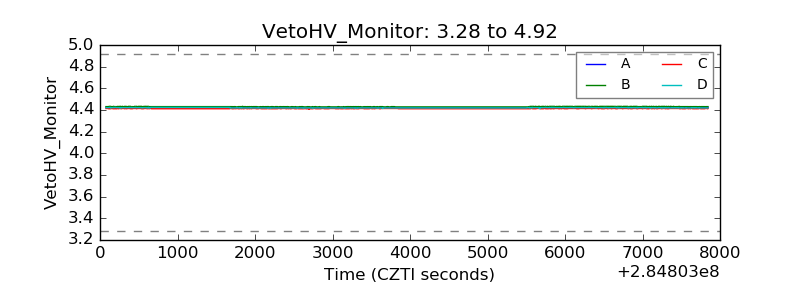 |
| Veto LLD | 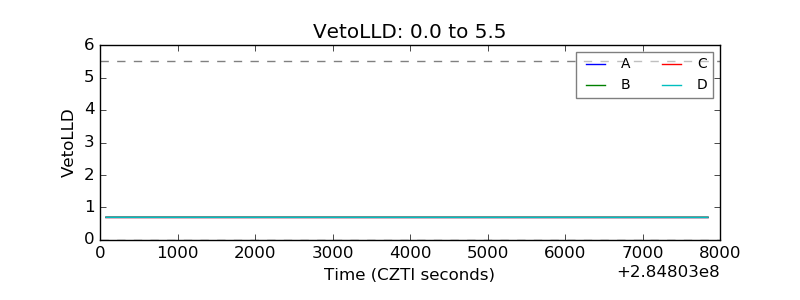 |
| Alpha Counter | 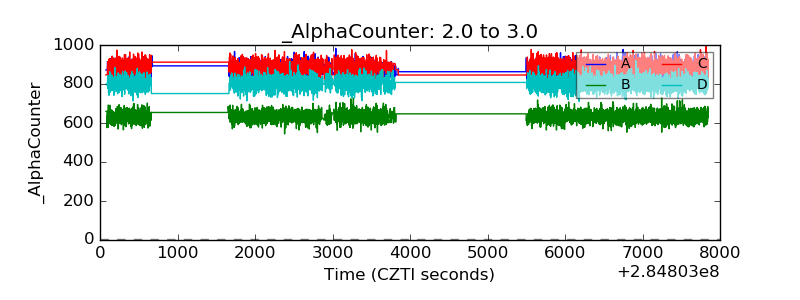 |
| _CPM_Rate | 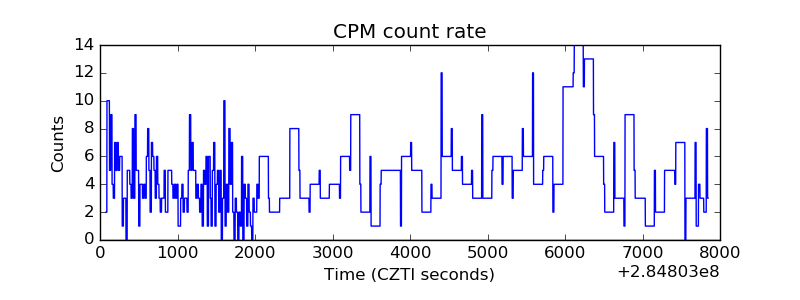 |
| CZT Counter | 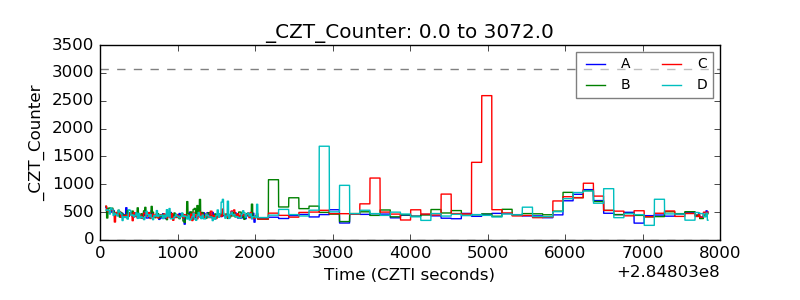 |
| +2.5 Volts monitor |  |
| +5 Volts monitor | 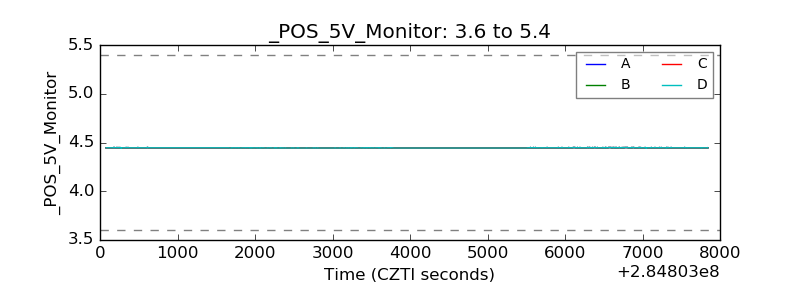 |
| _ROLL_ROT | 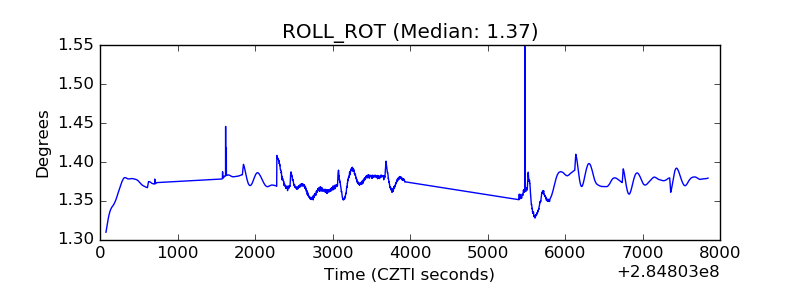 |
| _Roll_DEC | 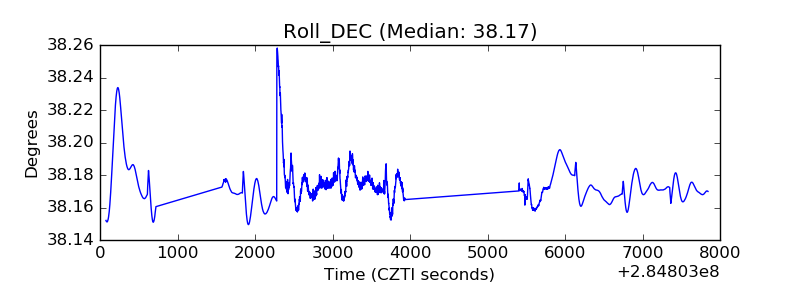 |
| _Roll_RA | 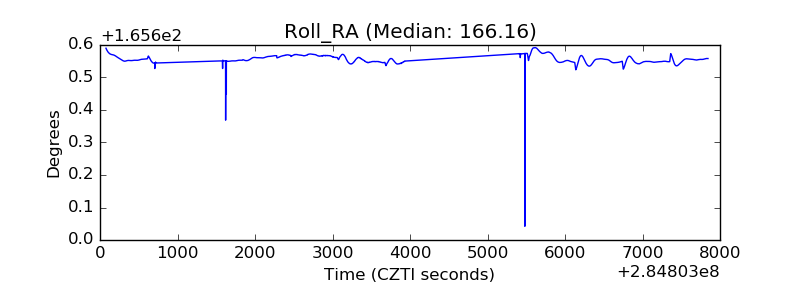 |
| Veto Counter | 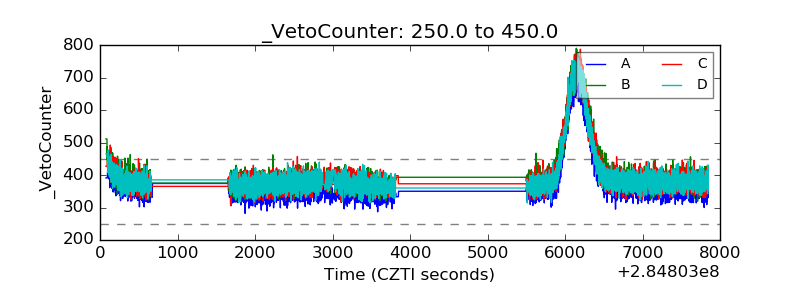 |