| Param | Original file | Final file |
|---|---|---|
| Filename | modeM0/AS1A05_015T01_9000002650_17768cztM0_level2.evt | modeM0/AS1A05_015T01_9000002650_17768cztM0_level2_quad_clean.evt |
| Size (bytes) | 1,968,042,240 | 304,562,880 |
| Size | 1.8 GB | 290.5 MB |
| Events in quadrant A | 12,190,769 | 1,916,321 |
| Events in quadrant B | 12,673,894 | 1,935,463 |
| Events in quadrant C | 14,111,849 | 1,840,714 |
| Events in quadrant D | 18,904,944 | 1,777,877 |
| Mode SS | |||
|---|---|---|---|
| Quadrant | BADHDUFLAG | Total packets | Discarded packets |
| A | 0 | 518 | 0 |
| B | 0 | 518 | 0 |
| C | 0 | 518 | 0 |
| D | 0 | 518 | 0 |
| Mode M9 | |||
|---|---|---|---|
| Quadrant | BADHDUFLAG | Total packets | Discarded packets |
| A | 0 | 18 | 0 |
| B | 0 | 18 | 0 |
| C | 0 | 18 | 0 |
| D | 0 | 18 | 0 |
| Mode M0 | |||
|---|---|---|---|
| Quadrant | BADHDUFLAG | Total packets | Discarded packets |
| A | 0 | 53548 | 4 |
| B | 0 | 54267 | 4 |
| C | 0 | 58365 | 4 |
| D | 0 | 73615 | 4 |
| Quadrant | Total seconds | Saturated seconds | Saturation percentage |
|---|---|---|---|
| A | 25476 | 873 | 3.426755% |
| B | 25476 | 851 | 3.340399% |
| C | 25475 | 1414 | 5.550540% |
| D | 25475 | 2620 | 10.284593% |
Noise dominated data is calculated using 1-second bins in cleaned event files. If a bin has >2000 counts, and if more than 50% of those come from <1% of pixels, then it is considered to be noise-dominated and hence unusable.
| Quadrant | # 1 sec bins | Bins with >0 counts | Bins with >2000 counts | High rate bins dominated by noise | Noise dominated (total time) | Noise dominated (detector-on time) | Marked lightcurve |
|---|---|---|---|---|---|---|---|
| A | 27281 | 25478 | 74 | 74 | 0.27% | 0.29% | 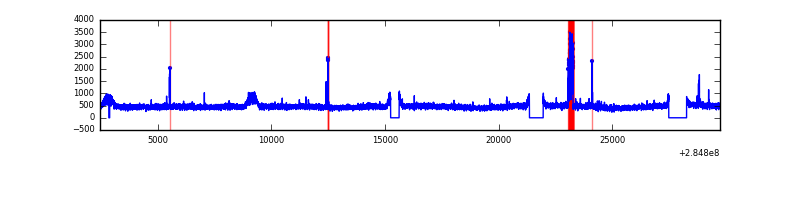 |
| B | 27281 | 25479 | 47 | 47 | 0.17% | 0.18% | 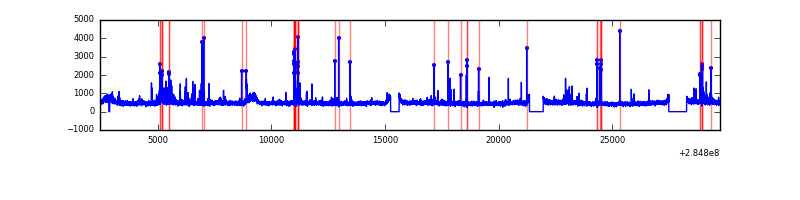 |
| C | 27280 | 25478 | 332 | 332 | 1.22% | 1.30% | 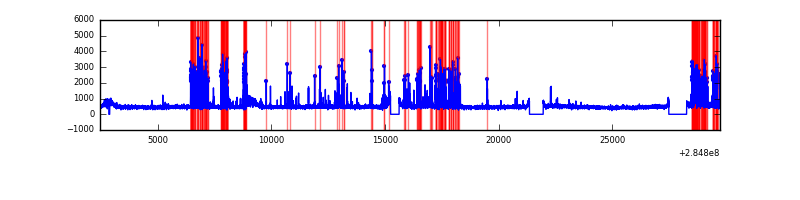 |
| D | 27280 | 25477 | 1632 | 1632 | 5.98% | 6.41% | 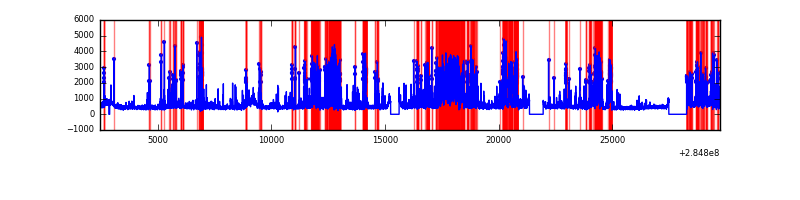 |
Top three noisy pixels from each quadrant. If the there are fewer than three noisy pixels in the level2.evt file, extra rows are filled as -1
| Pixel properties | Quadrant properties | ||||||
|---|---|---|---|---|---|---|---|
| Quadrant | DetID | PixID | Counts | Sigma | Mean | Median | Sigma |
| A | 15 | 174 | 382490 | 610.31 | 3072 | 2997 | 621.8 |
| A | 0 | 226 | 26799 | 38.28 | 3072 | 2997 | 621.8 |
| A | 3 | 137 | 23599 | 33.13 | 3072 | 2997 | 621.8 |
| B | 7 | 220 | 275772 | 463.89 | 3067 | 2980 | 588.1 |
| B | 0 | 219 | 101589 | 167.69 | 3067 | 2980 | 588.1 |
| B | 15 | 35 | 76844 | 125.61 | 3067 | 2980 | 588.1 |
| C | 4 | 254 | 1936356 | 2834.21 | 2915 | 2929 | 682.2 |
| C | 14 | 238 | 442981 | 645.07 | 2915 | 2929 | 682.2 |
| C | 5 | 218 | 213974 | 309.37 | 2915 | 2929 | 682.2 |
| D | 7 | 238 | 5564851 | 8059.32 | 2896 | 2825 | 690.1 |
| D | 1 | 52 | 943704 | 1363.32 | 2896 | 2825 | 690.1 |
| D | 2 | 165 | 478557 | 689.33 | 2896 | 2825 | 690.1 |
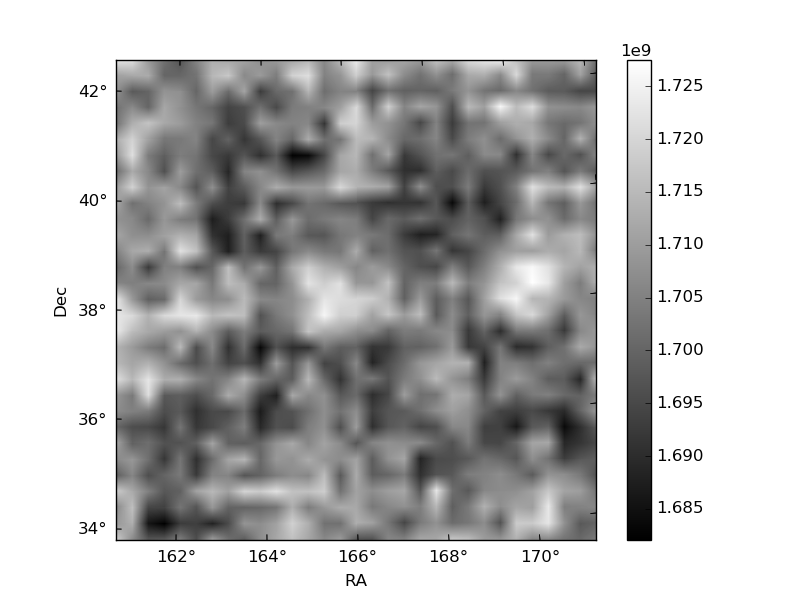
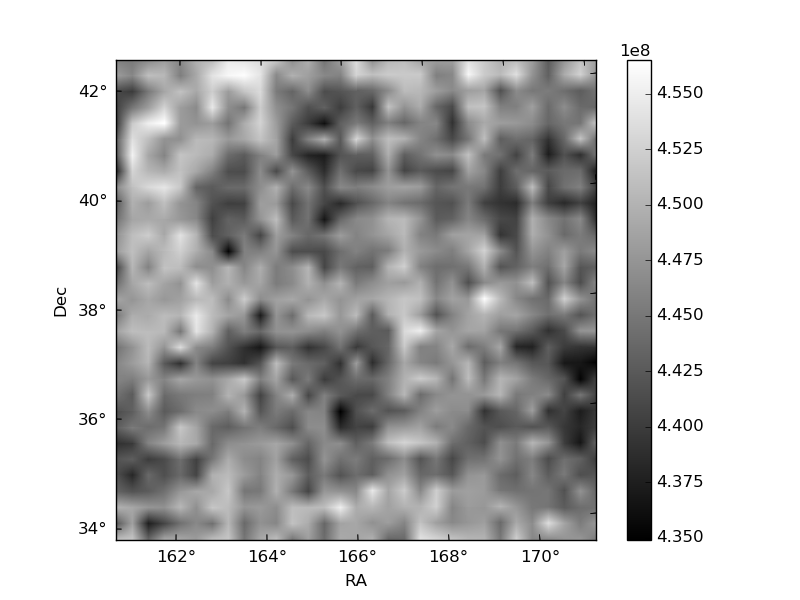
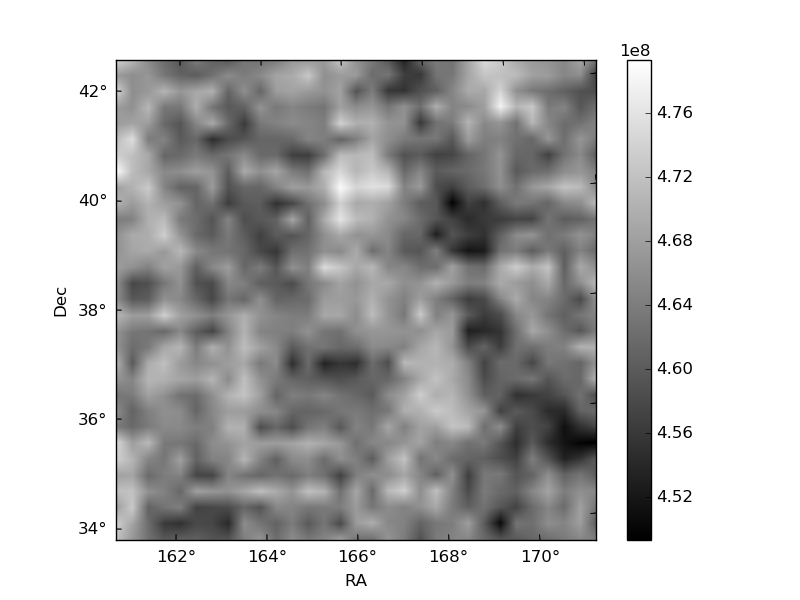
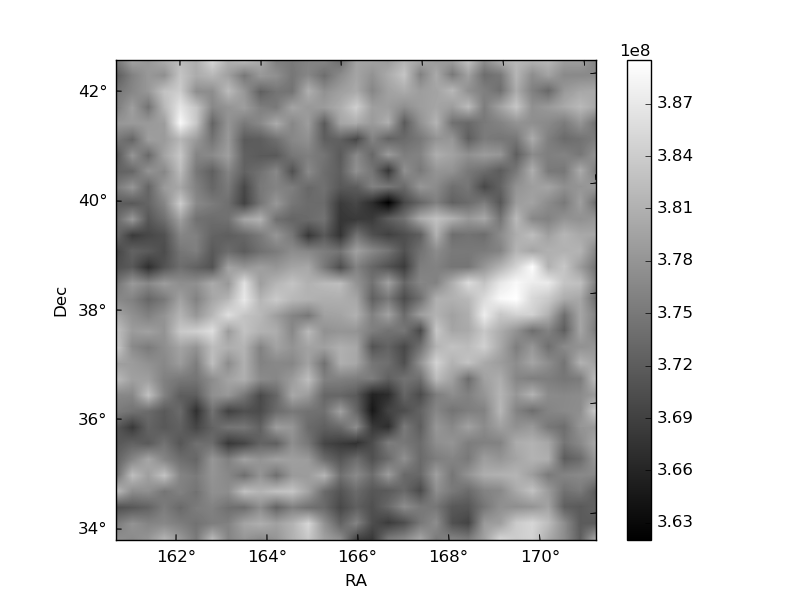
Histogram calculated using DETX and DETY for each event in the final _common_clean file
| Quadrant A | 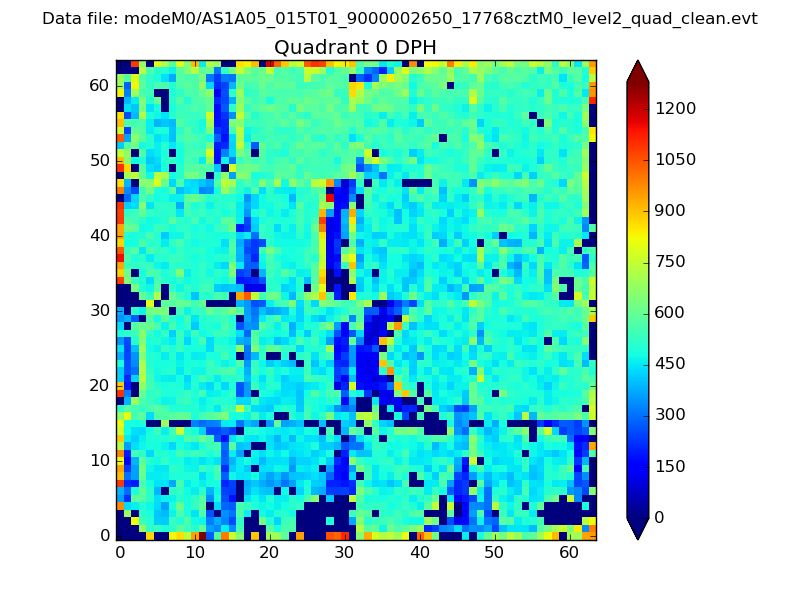 |
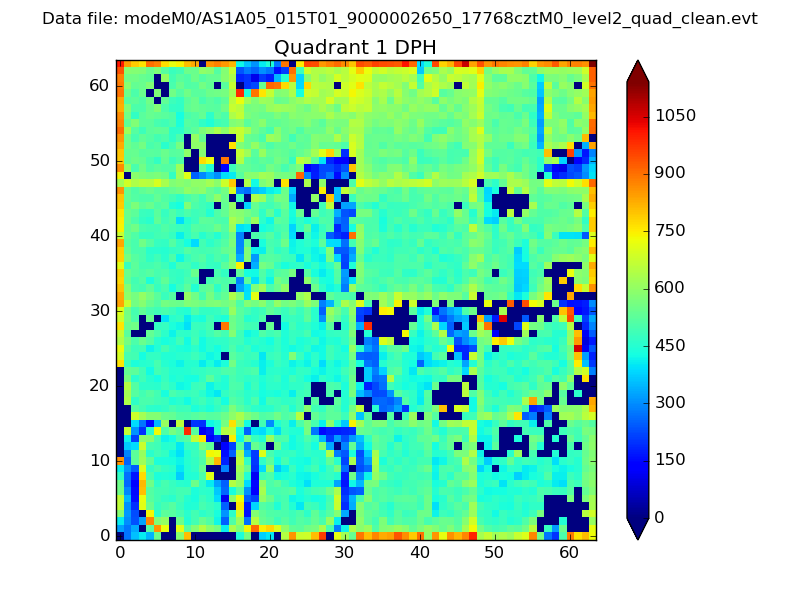 |
Quadrant B |
|---|---|---|---|
| Quadrant D |  |
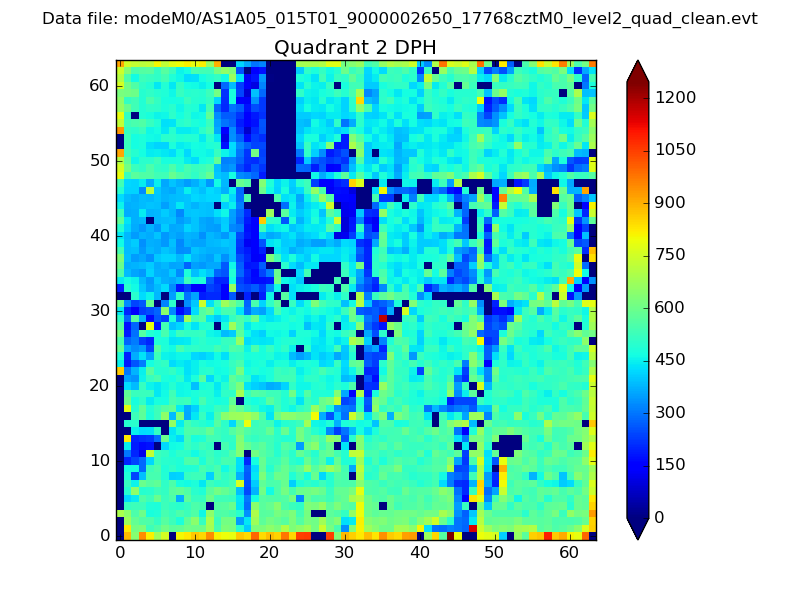 |
Quadrant C |
| Plot type | Count rate plots | Images |
|---|---|---|
| Comparison with Poisson distribution Blue bars denote a histogram of data divided into 1 sec bins. Red curve is a Poisson curve with rate = median count rate of data. |
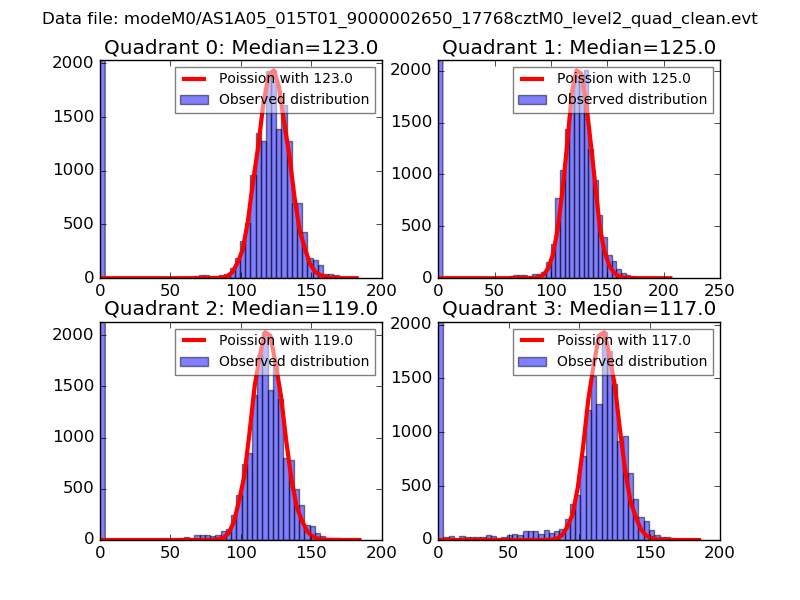 |
 |
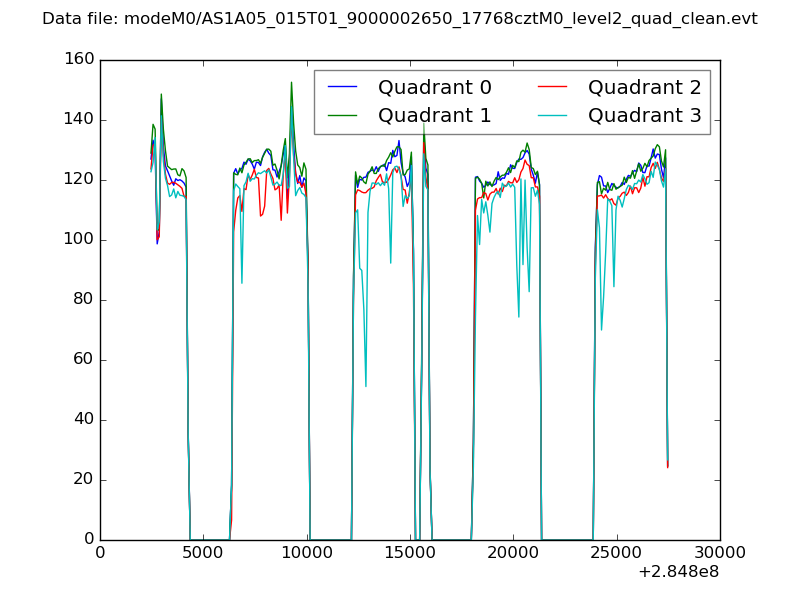
| Quadrant-wise count rates Data is divided into 100 sec bins |
 |
|
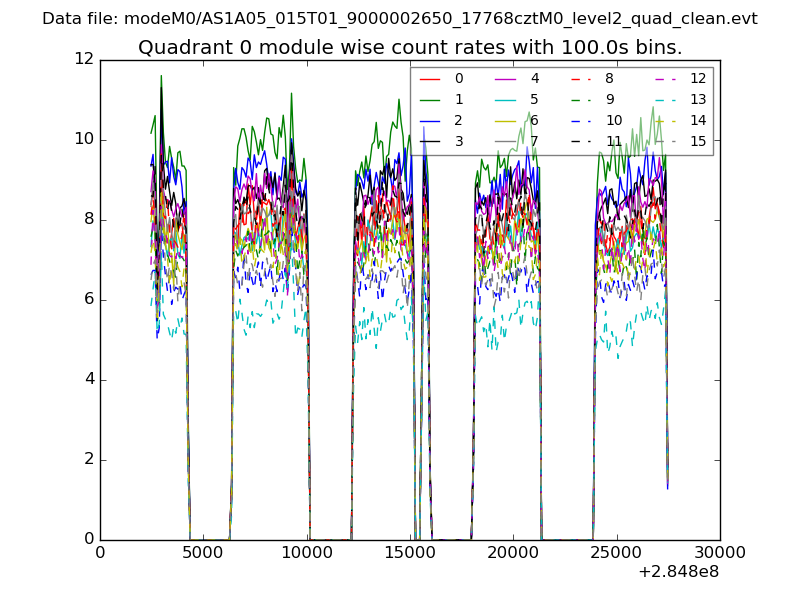
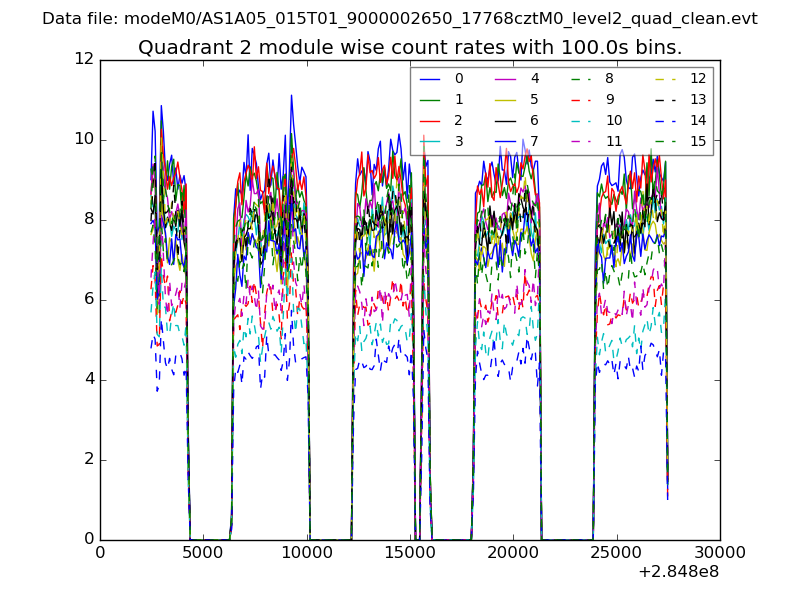
| Module-wise count rates for Quadrant A Data is divided into 100 sec bins |
 |
 |
| Module-wise count rates for Quadrant B Data is divided into 100 sec bins |
 |
 |
| Module-wise count rates for Quadrant C Data is divided into 100 sec bins |
 |
 |
| Module-wise count rates for Quadrant D Data is divided into 100 sec bins |
 |
 |
| Parameter | Plot |
|---|---|
| CZT HV Monitor | 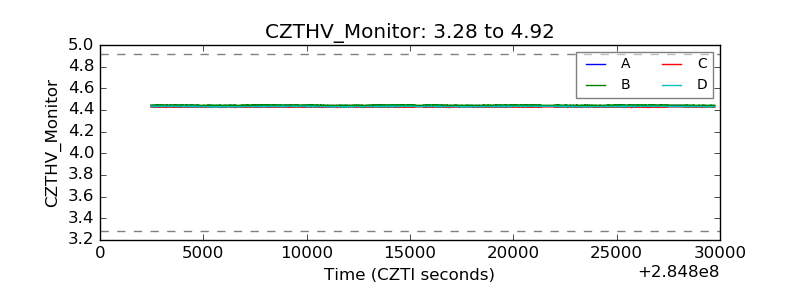 |
| D_VDD | 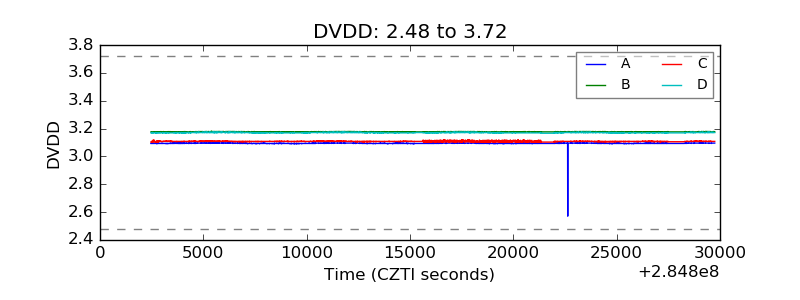 |
| Temperature 1 | 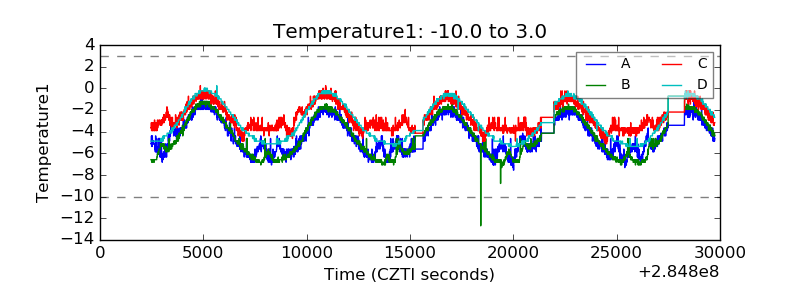 |
| Veto HV Monitor | 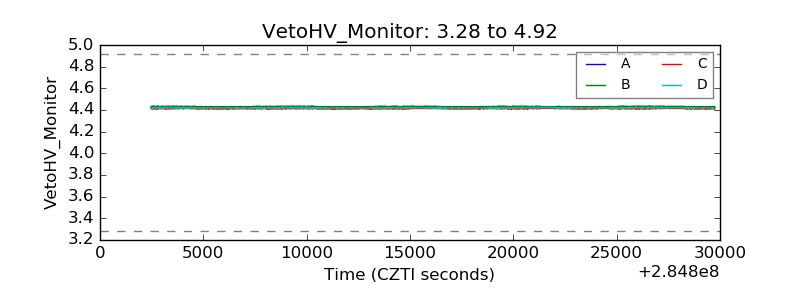 |
| Veto LLD | 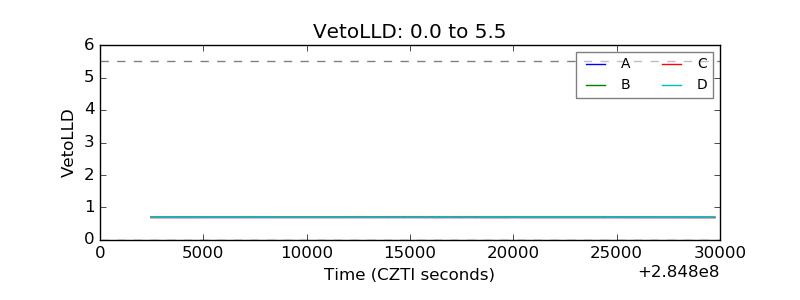 |
| Alpha Counter | 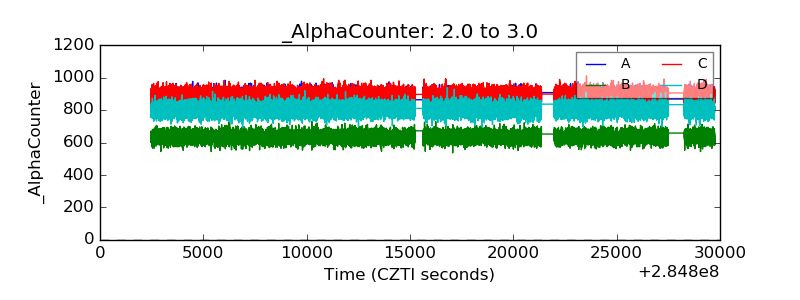 |
| _CPM_Rate | 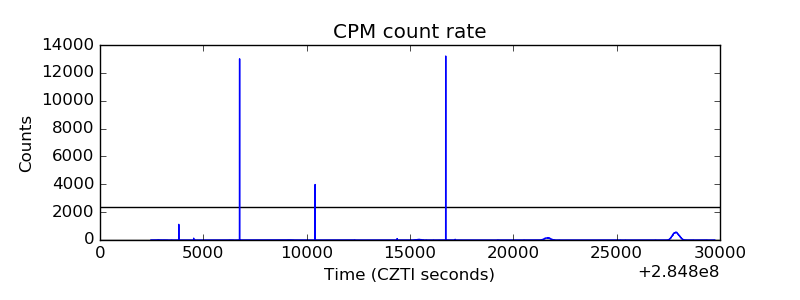 |
| CZT Counter | 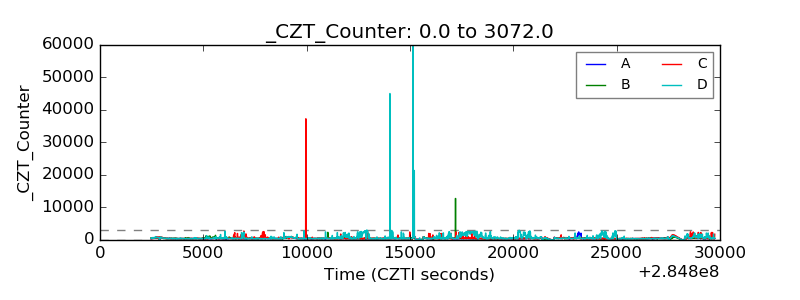 |
| +2.5 Volts monitor | 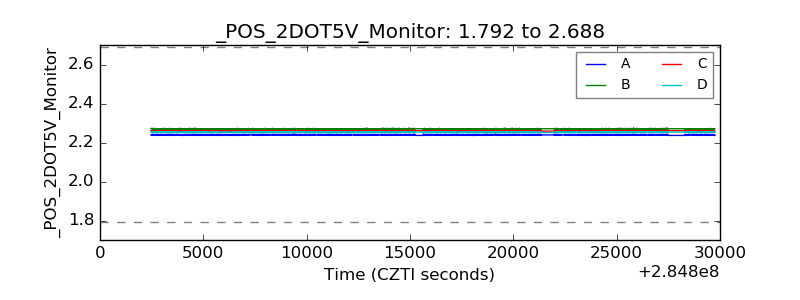 |
| +5 Volts monitor | 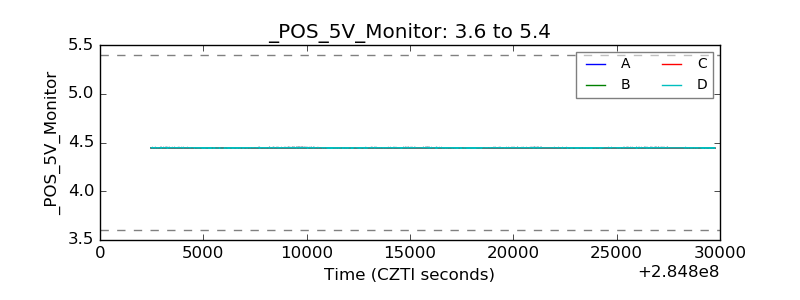 |
| _ROLL_ROT | 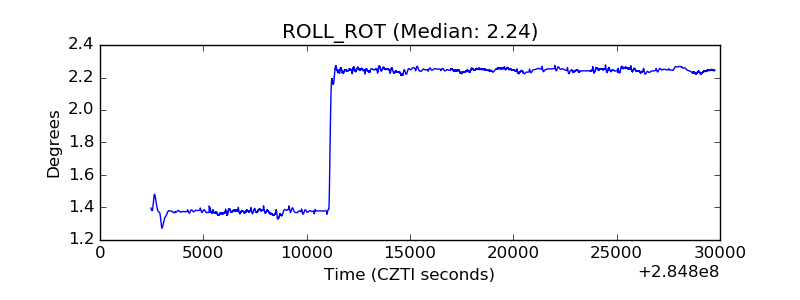 |
| _Roll_DEC | 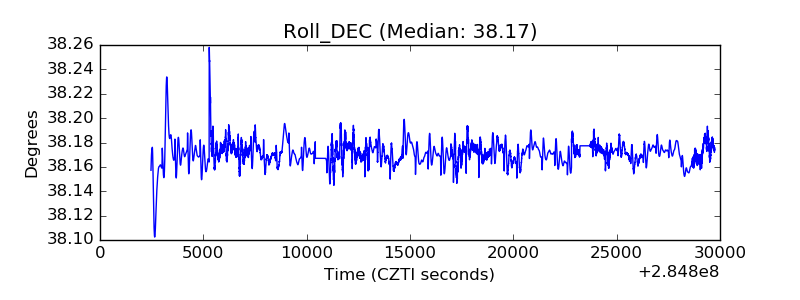 |
| _Roll_RA | 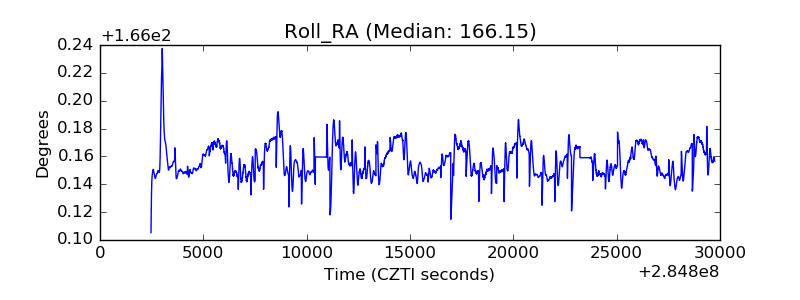 |
| Veto Counter | 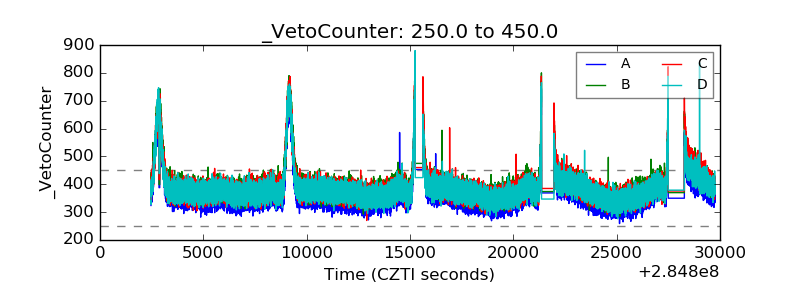 |