| Param | Original file | Final file |
|---|---|---|
| Filename | modeM0/AS1A05_015T01_9000002650_17769cztM0_level2.evt | modeM0/AS1A05_015T01_9000002650_17769cztM0_level2_quad_clean.evt |
| Size (bytes) | 578,949,120 | 76,314,240 |
| Size | 552.1 MB | 72.8 MB |
| Events in quadrant A | 3,182,389 | 475,874 |
| Events in quadrant B | 3,335,895 | 480,188 |
| Events in quadrant C | 5,198,961 | 450,234 |
| Events in quadrant D | 5,363,930 | 439,254 |
| Mode SS | |||
|---|---|---|---|
| Quadrant | BADHDUFLAG | Total packets | Discarded packets |
| A | 0 | 138 | 0 |
| B | 0 | 138 | 0 |
| C | 0 | 138 | 0 |
| D | 0 | 138 | 0 |
| Mode M9 | |||
|---|---|---|---|
| Quadrant | BADHDUFLAG | Total packets | Discarded packets |
| A | 0 | 15 | 0 |
| B | 0 | 16 | 0 |
| C | 0 | 16 | 0 |
| D | 0 | 16 | 0 |
| Mode M0 | |||
|---|---|---|---|
| Quadrant | BADHDUFLAG | Total packets | Discarded packets |
| A | 0 | 13942 | 2 |
| B | 0 | 14310 | 2 |
| C | 0 | 19811 | 2 |
| D | 0 | 20582 | 2 |
| Quadrant | Total seconds | Saturated seconds | Saturation percentage |
|---|---|---|---|
| A | 6669 | 48 | 0.719748% |
| B | 6669 | 76 | 1.139601% |
| C | 6669 | 925 | 13.870145% |
| D | 6669 | 590 | 8.846904% |
Noise dominated data is calculated using 1-second bins in cleaned event files. If a bin has >2000 counts, and if more than 50% of those come from <1% of pixels, then it is considered to be noise-dominated and hence unusable.
| Quadrant | # 1 sec bins | Bins with >0 counts | Bins with >2000 counts | High rate bins dominated by noise | Noise dominated (total time) | Noise dominated (detector-on time) | Marked lightcurve |
|---|---|---|---|---|---|---|---|
| A | 7604 | 6670 | 0 | 0 | 0.00% | 0.00% | 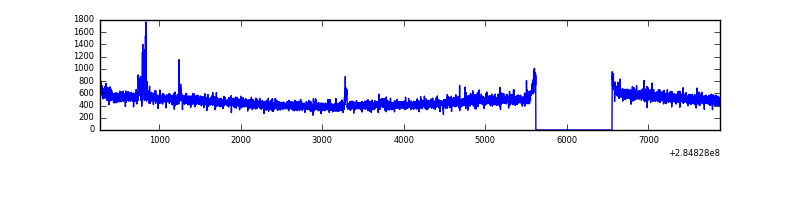 |
| B | 7604 | 6669 | 11 | 11 | 0.14% | 0.16% | 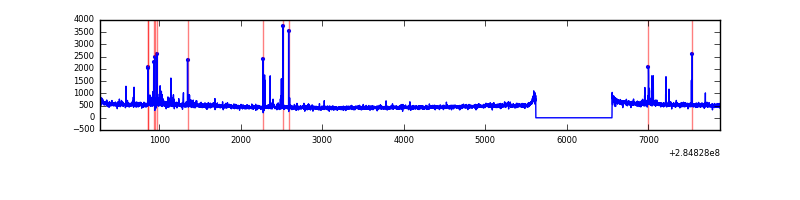 |
| C | 7604 | 6670 | 472 | 472 | 6.21% | 7.08% | 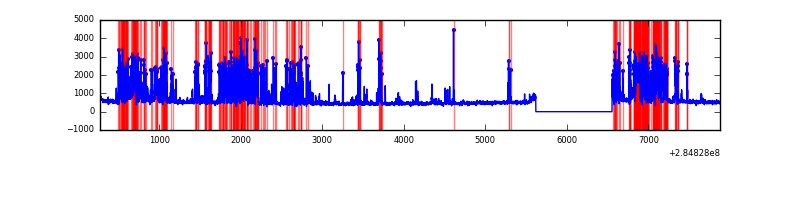 |
| D | 7604 | 6670 | 431 | 431 | 5.67% | 6.46% |  |
Top three noisy pixels from each quadrant. If the there are fewer than three noisy pixels in the level2.evt file, extra rows are filled as -1
| Pixel properties | Quadrant properties | ||||||
|---|---|---|---|---|---|---|---|
| Quadrant | DetID | PixID | Counts | Sigma | Mean | Median | Sigma |
| A | 15 | 174 | 39660 | 233.93 | 816 | 796 | 166.1 |
| A | 0 | 226 | 7053 | 37.66 | 816 | 796 | 166.1 |
| A | 12 | 194 | 6231 | 32.71 | 816 | 796 | 166.1 |
| B | 7 | 220 | 56761 | 355.57 | 815 | 794 | 157.4 |
| B | 0 | 219 | 26178 | 161.27 | 815 | 794 | 157.4 |
| B | 12 | 111 | 18379 | 111.72 | 815 | 794 | 157.4 |
| C | 4 | 254 | 2111111 | 12187.97 | 739 | 744 | 173.2 |
| C | 14 | 238 | 115110 | 660.5 | 739 | 744 | 173.2 |
| C | 5 | 218 | 45365 | 257.7 | 739 | 744 | 173.2 |
| D | 7 | 238 | 1641556 | 8885.14 | 769 | 749 | 184.7 |
| D | 1 | 52 | 294596 | 1591.21 | 769 | 749 | 184.7 |
| D | 10 | 70 | 197340 | 1064.56 | 769 | 749 | 184.7 |
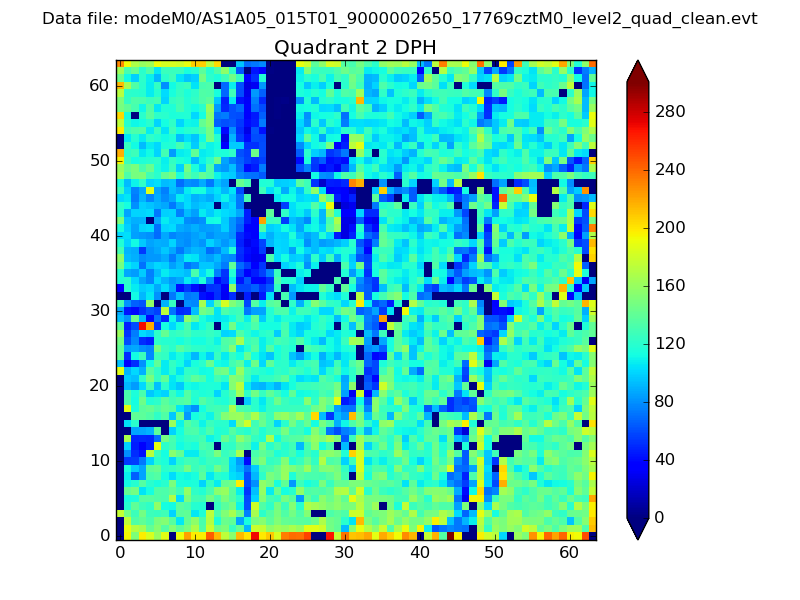
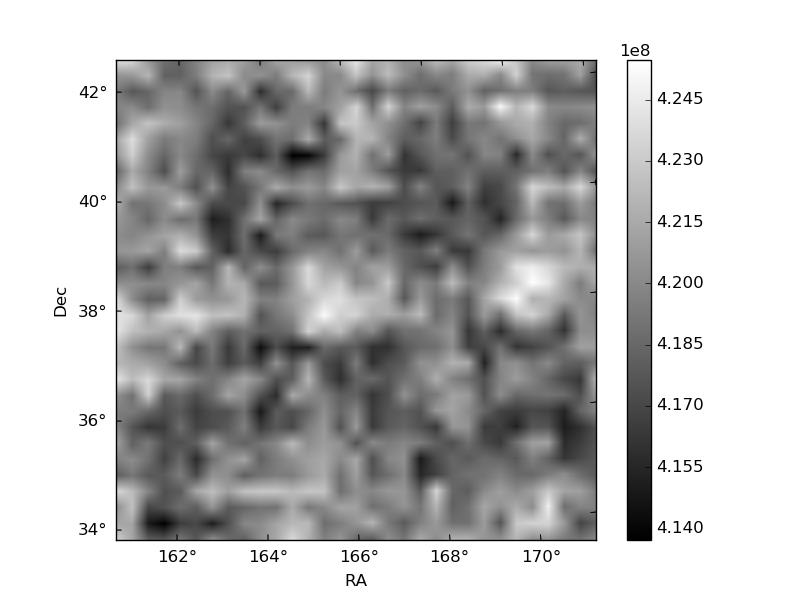
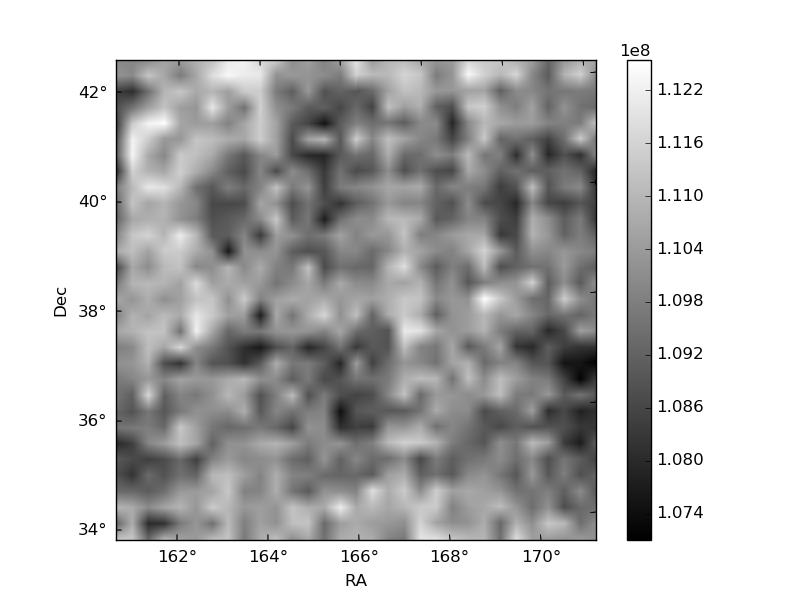
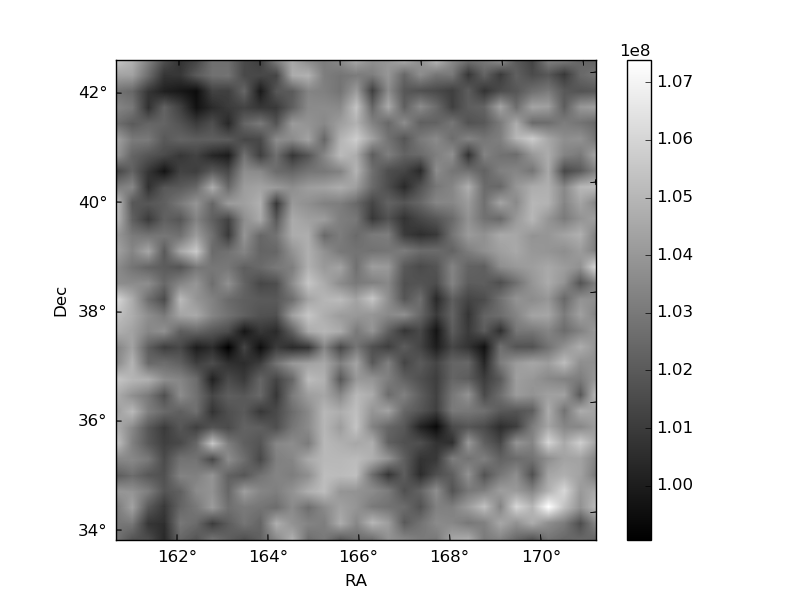
Histogram calculated using DETX and DETY for each event in the final _common_clean file
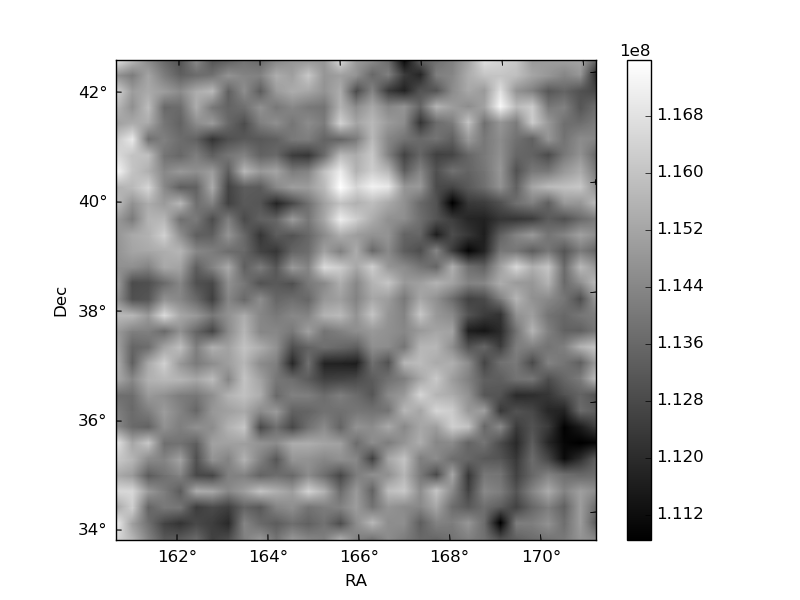
| Quadrant A | 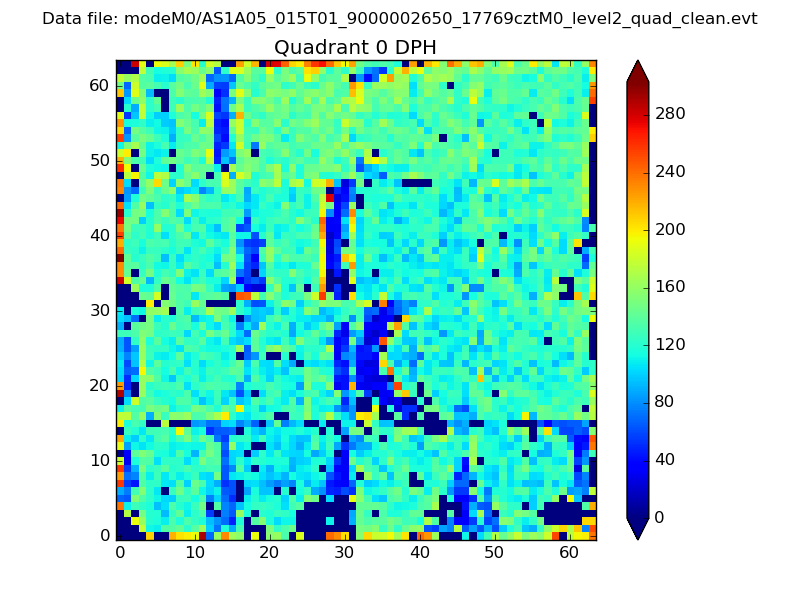 |
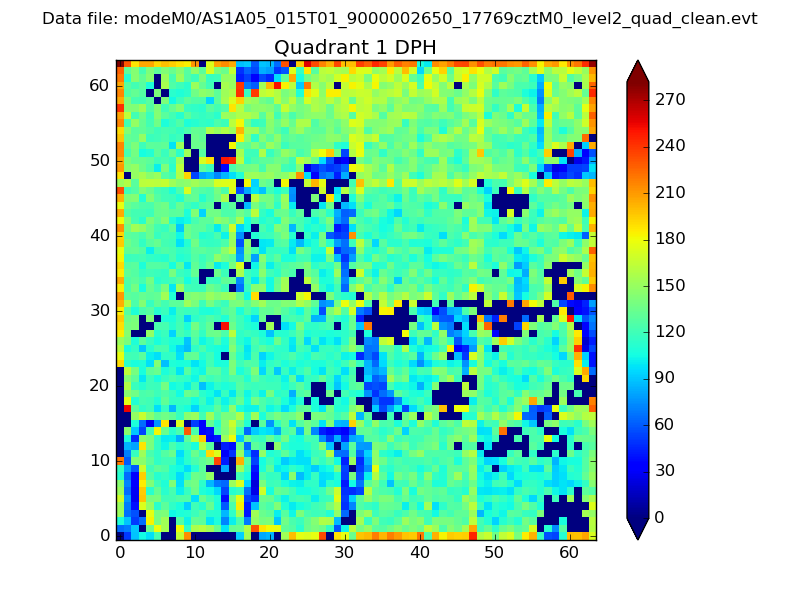 |
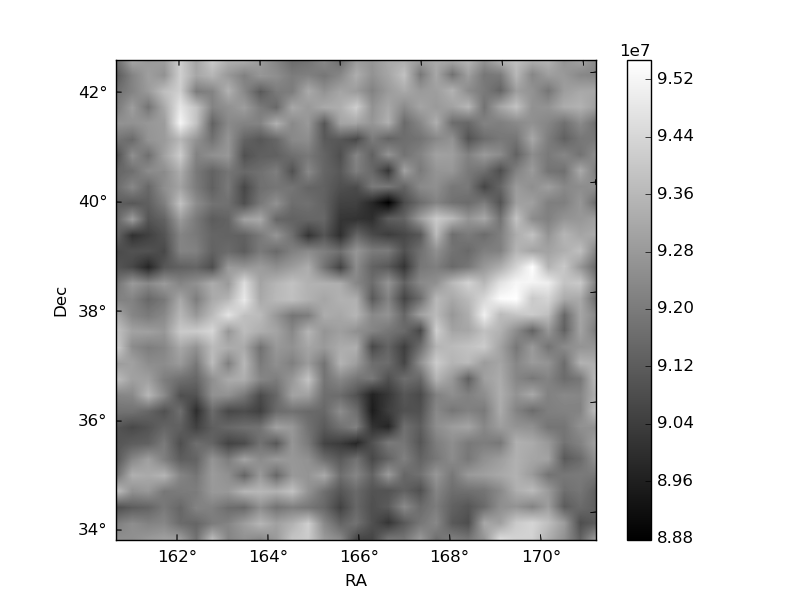
Quadrant B |
|---|---|---|---|
| Quadrant D | 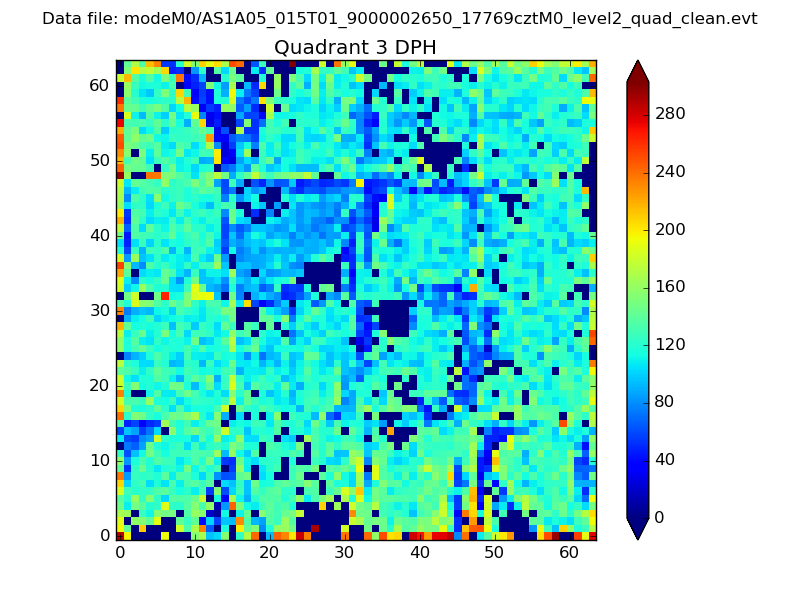 |
 |
Quadrant C |
| Plot type | Count rate plots | Images |
|---|---|---|
| Comparison with Poisson distribution Blue bars denote a histogram of data divided into 1 sec bins. Red curve is a Poisson curve with rate = median count rate of data. |
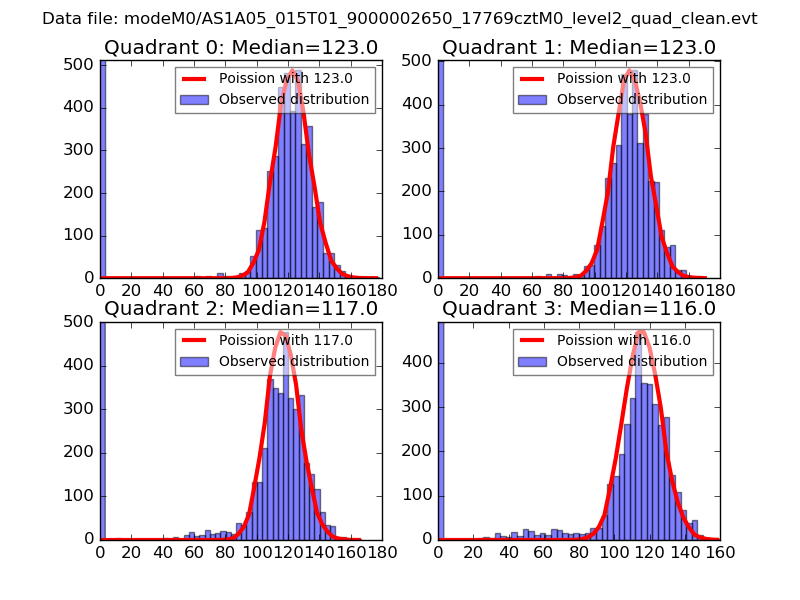 |
 |
| Quadrant-wise count rates Data is divided into 100 sec bins |
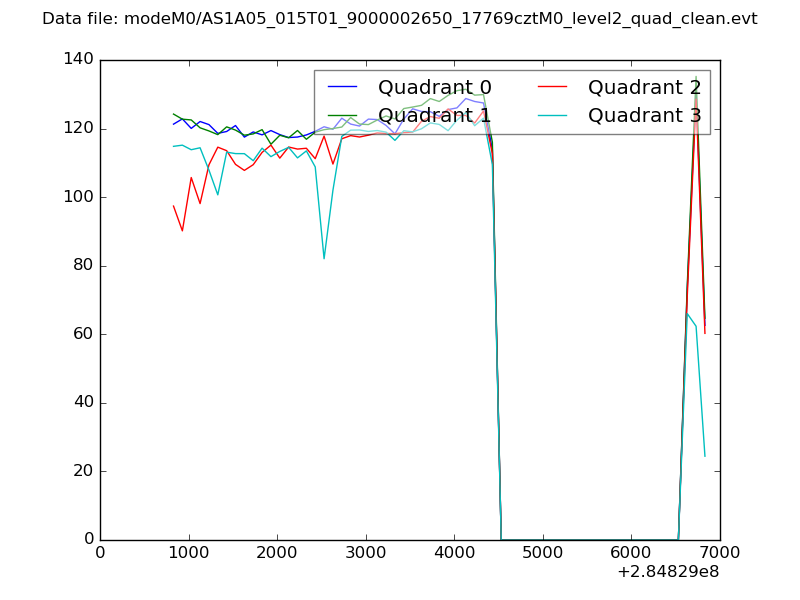 |
|
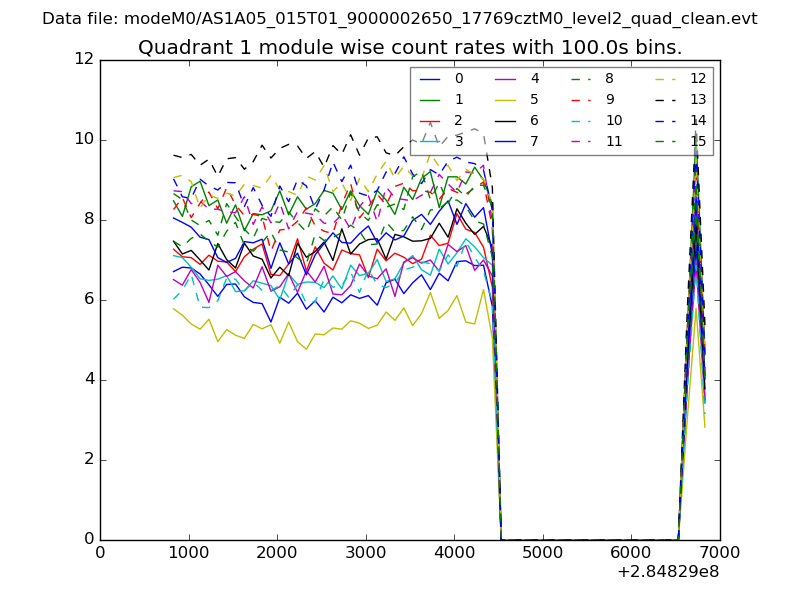
| Module-wise count rates for Quadrant A Data is divided into 100 sec bins |
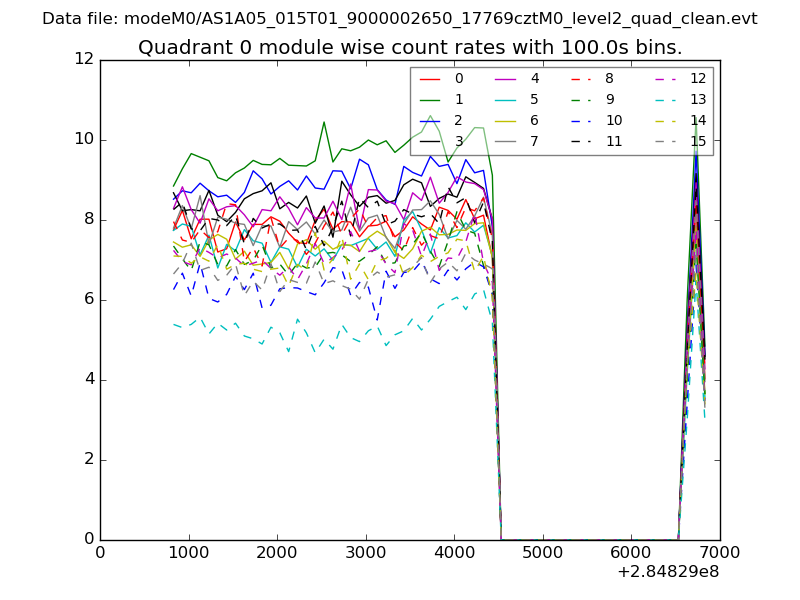 |
 |
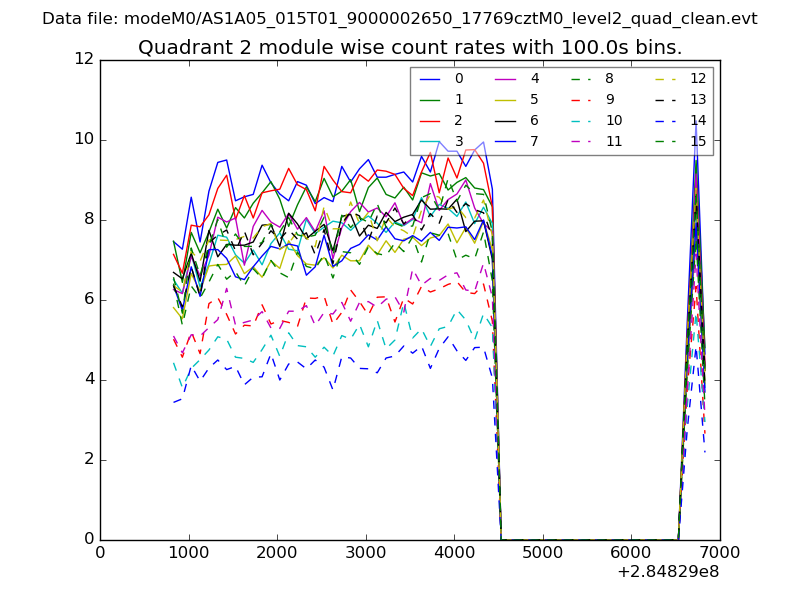
| Module-wise count rates for Quadrant B Data is divided into 100 sec bins |
 |
 |
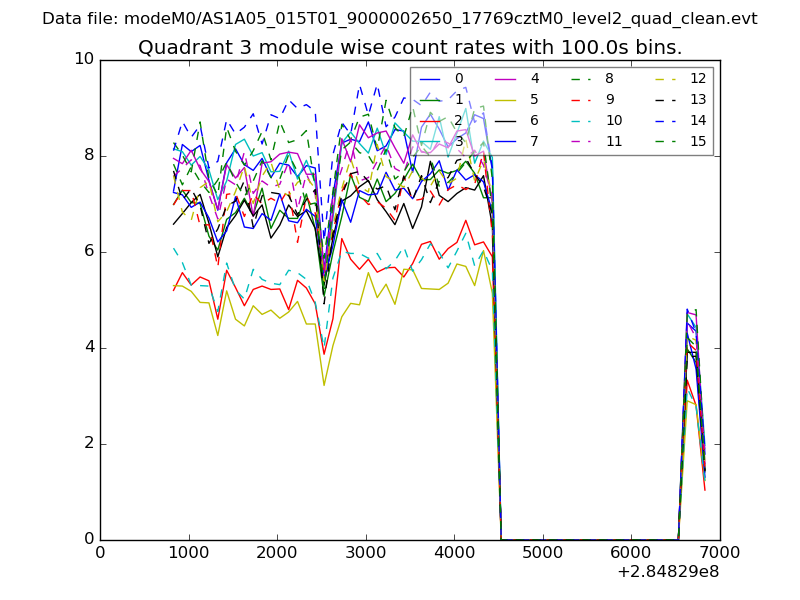
| Module-wise count rates for Quadrant C Data is divided into 100 sec bins |
 |
 |
| Module-wise count rates for Quadrant D Data is divided into 100 sec bins |
 |
 |
| Parameter | Plot |
|---|---|
| CZT HV Monitor | 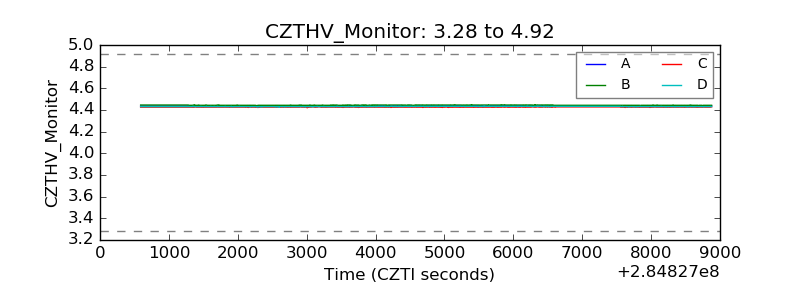 |
| D_VDD | 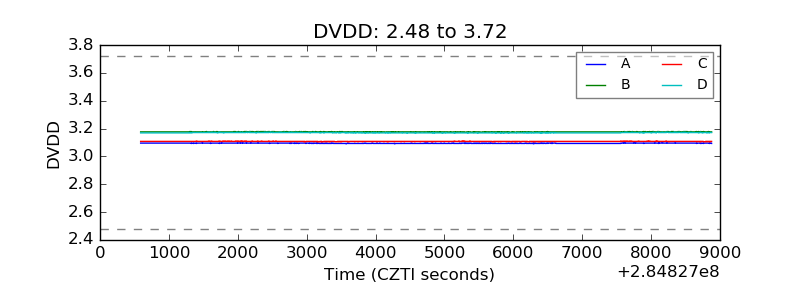 |
| Temperature 1 | 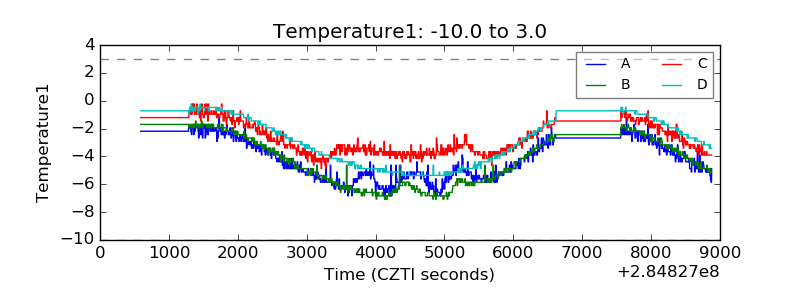 |
| Veto HV Monitor | 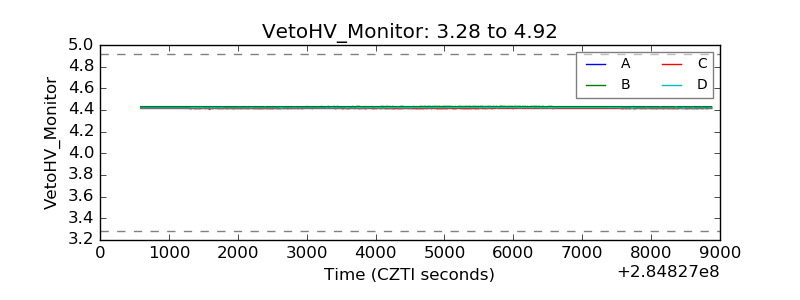 |
| Veto LLD | 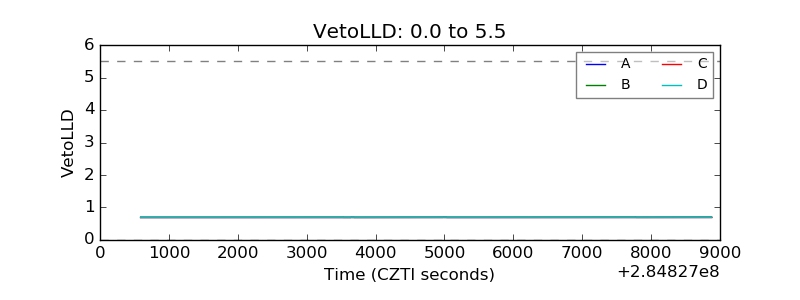 |
| Alpha Counter | 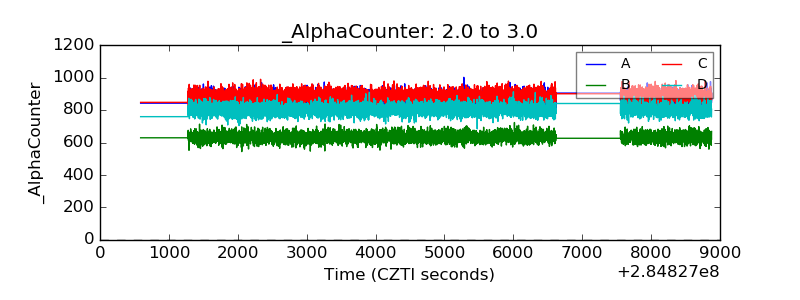 |
| _CPM_Rate | 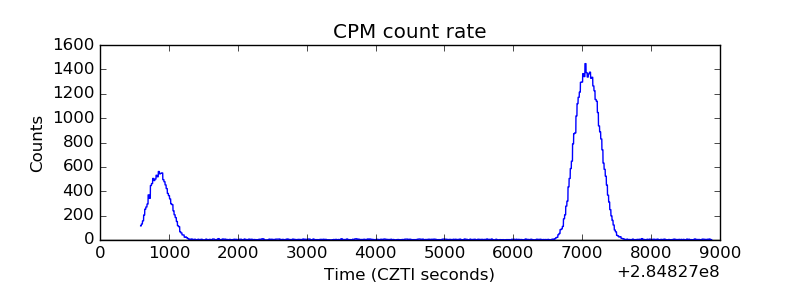 |
| CZT Counter | 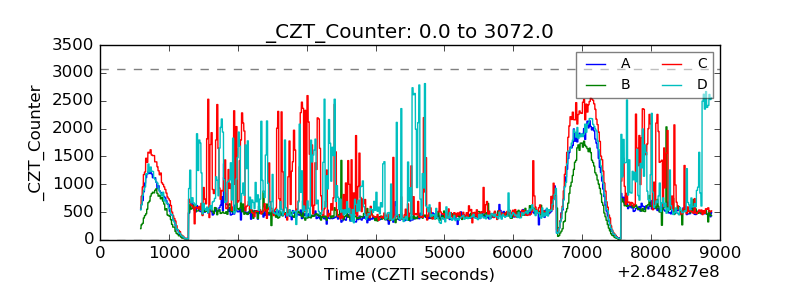 |
| +2.5 Volts monitor |  |
| +5 Volts monitor | 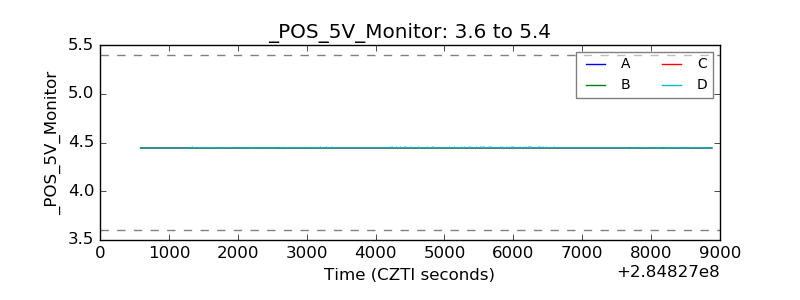 |
| _ROLL_ROT | 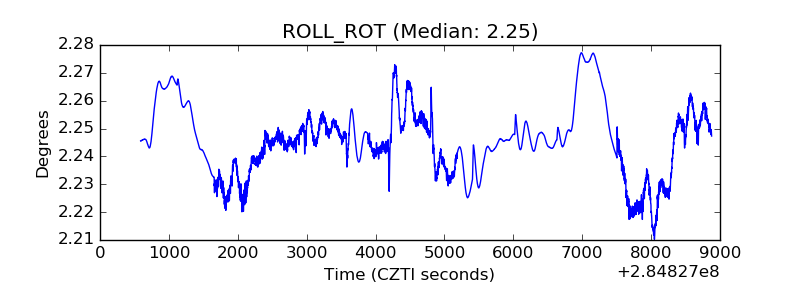 |
| _Roll_DEC | 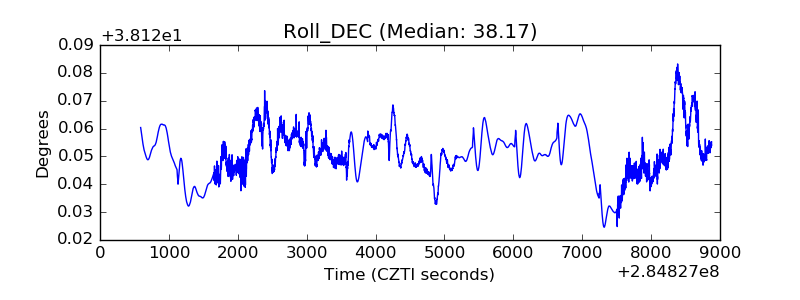 |
| _Roll_RA | 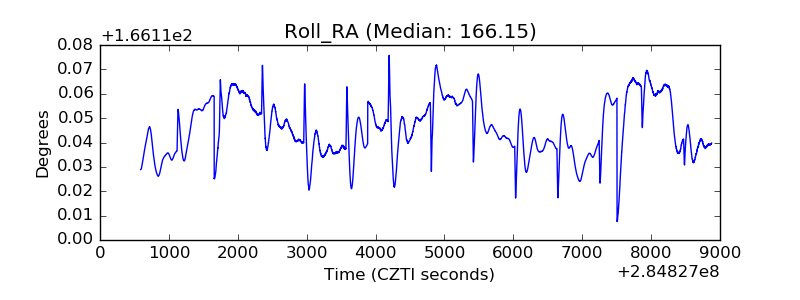 |
| Veto Counter | 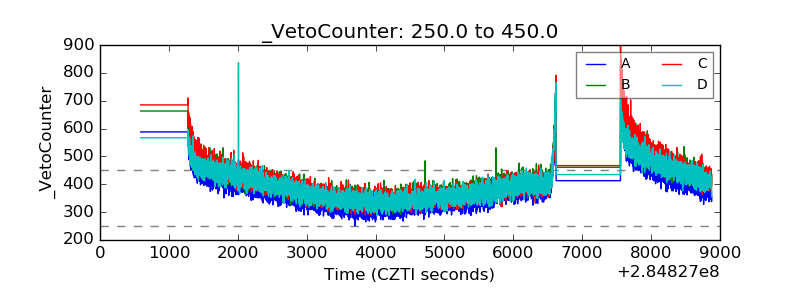 |