| Param | Original file | Final file |
|---|---|---|
| Filename | modeM0/AS1A05_015T01_9000002650_17772cztM0_level2.evt | modeM0/AS1A05_015T01_9000002650_17772cztM0_level2_quad_clean.evt |
| Size (bytes) | 591,108,480 | 93,746,880 |
| Size | 563.7 MB | 89.4 MB |
| Events in quadrant A | 2,926,407 | 625,530 |
| Events in quadrant B | 3,112,677 | 642,862 |
| Events in quadrant C | 4,927,917 | 577,585 |
| Events in quadrant D | 6,522,314 | 567,363 |
| Mode SS | |||
|---|---|---|---|
| Quadrant | BADHDUFLAG | Total packets | Discarded packets |
| A | 0 | 124 | 0 |
| B | 0 | 124 | 0 |
| C | 0 | 124 | 0 |
| D | 0 | 124 | 0 |
| Mode M9 | |||
|---|---|---|---|
| Quadrant | BADHDUFLAG | Total packets | Discarded packets |
| A | 0 | 12 | 0 |
| B | 0 | 12 | 0 |
| C | 0 | 12 | 0 |
| D | 0 | 12 | 0 |
| Mode M0 | |||
|---|---|---|---|
| Quadrant | BADHDUFLAG | Total packets | Discarded packets |
| A | 0 | 12838 | 1 |
| B | 0 | 13307 | 1 |
| C | 0 | 18739 | 1 |
| D | 0 | 23685 | 1 |
| Quadrant | Total seconds | Saturated seconds | Saturation percentage |
|---|---|---|---|
| A | 6088 | 21 | 0.344941% |
| B | 6088 | 50 | 0.821288% |
| C | 6088 | 897 | 14.733903% |
| D | 6088 | 954 | 15.670171% |
Noise dominated data is calculated using 1-second bins in cleaned event files. If a bin has >2000 counts, and if more than 50% of those come from <1% of pixels, then it is considered to be noise-dominated and hence unusable.
| Quadrant | # 1 sec bins | Bins with >0 counts | Bins with >2000 counts | High rate bins dominated by noise | Noise dominated (total time) | Noise dominated (detector-on time) | Marked lightcurve |
|---|---|---|---|---|---|---|---|
| A | 7318 | 6089 | 0 | 0 | 0.00% | 0.00% | 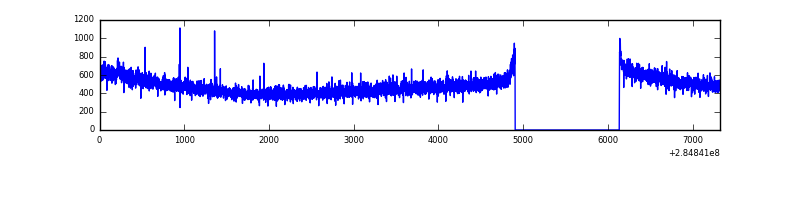 |
| B | 7318 | 6089 | 10 | 10 | 0.14% | 0.16% | 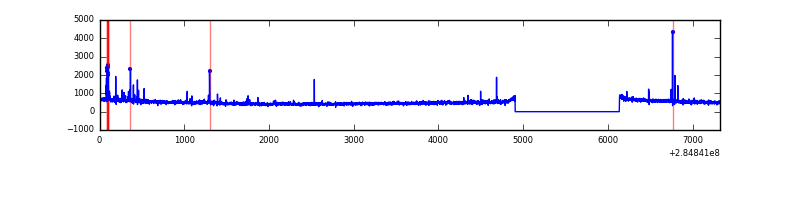 |
| C | 7318 | 6088 | 471 | 471 | 6.44% | 7.74% | 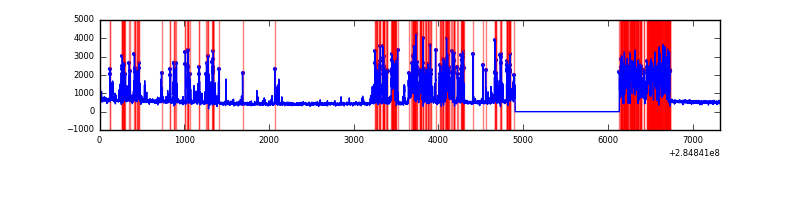 |
| D | 7318 | 6088 | 929 | 929 | 12.69% | 15.26% | 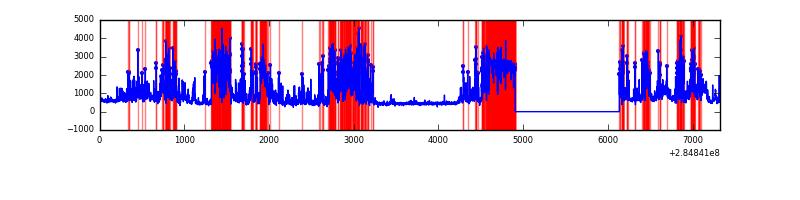 |
Top three noisy pixels from each quadrant. If the there are fewer than three noisy pixels in the level2.evt file, extra rows are filled as -1
| Pixel properties | Quadrant properties | ||||||
|---|---|---|---|---|---|---|---|
| Quadrant | DetID | PixID | Counts | Sigma | Mean | Median | Sigma |
| A | 15 | 174 | 9113 | 54.79 | 758 | 744 | 152.8 |
| A | 0 | 226 | 6504 | 37.71 | 758 | 744 | 152.8 |
| A | 12 | 194 | 5654 | 32.14 | 758 | 744 | 152.8 |
| B | 0 | 244 | 36458 | 249.27 | 764 | 748 | 143.3 |
| B | 0 | 219 | 33795 | 230.68 | 764 | 748 | 143.3 |
| B | 12 | 111 | 16540 | 110.24 | 764 | 748 | 143.3 |
| C | 4 | 254 | 2121392 | 13367.44 | 679 | 684 | 158.6 |
| C | 14 | 238 | 104224 | 652.64 | 679 | 684 | 158.6 |
| C | 5 | 218 | 36439 | 225.37 | 679 | 684 | 158.6 |
| D | 7 | 238 | 3741618 | 23377.99 | 675 | 661 | 160.0 |
| D | 10 | 70 | 122276 | 760.0 | 675 | 661 | 160.0 |
| D | 1 | 52 | 54529 | 336.63 | 675 | 661 | 160.0 |
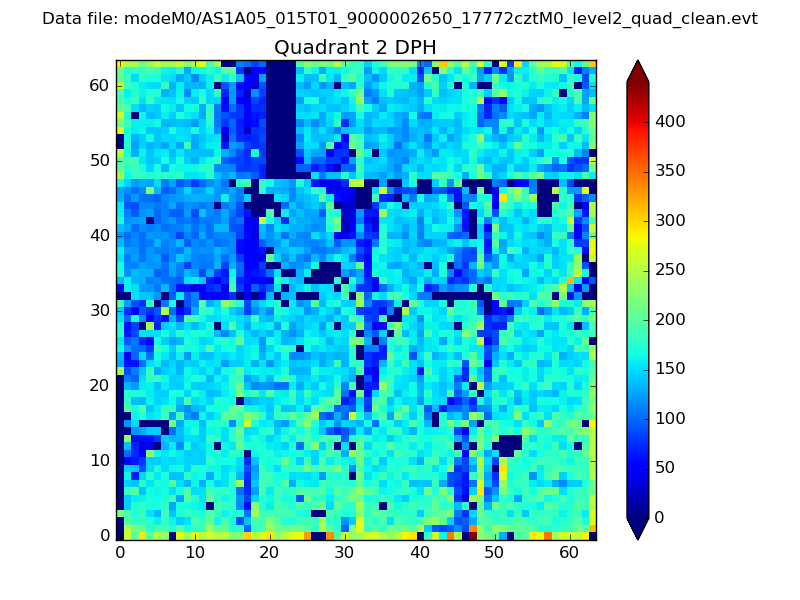
Histogram calculated using DETX and DETY for each event in the final _common_clean file
| Quadrant A | 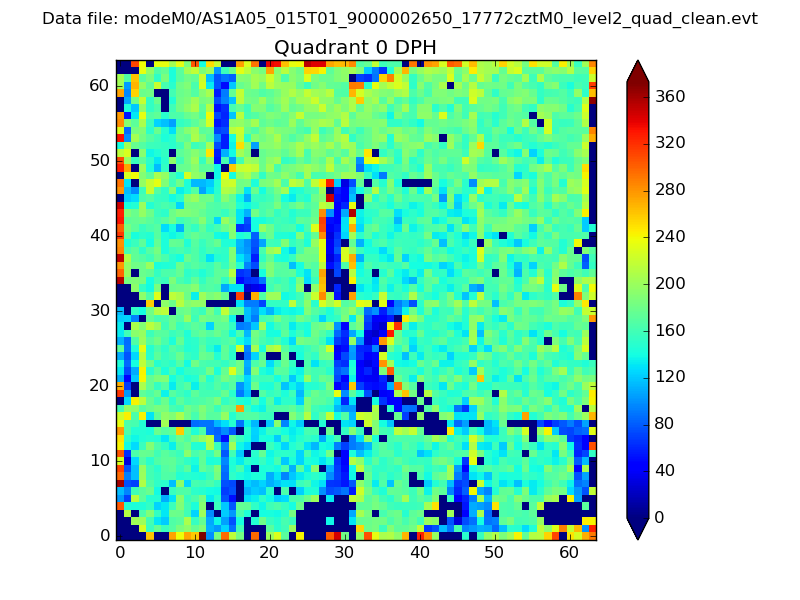 |
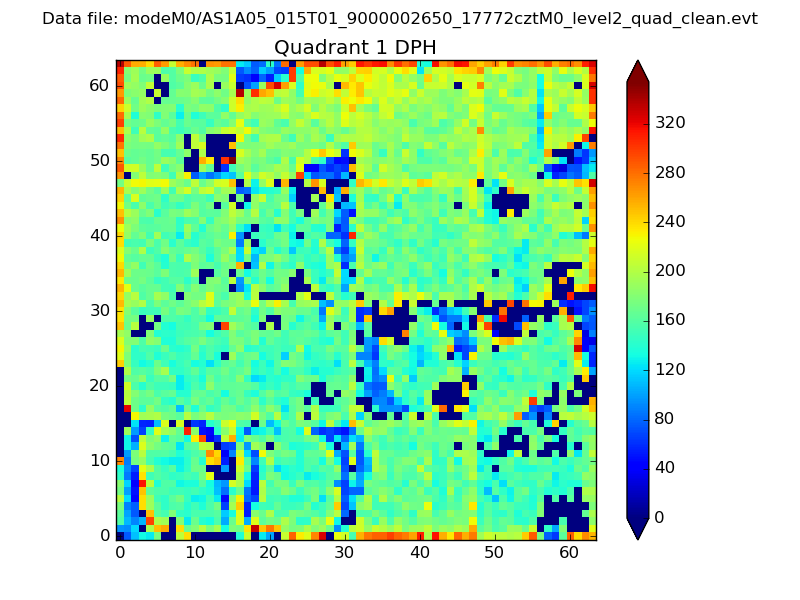 |
Quadrant B |
|---|---|---|---|
| Quadrant D | 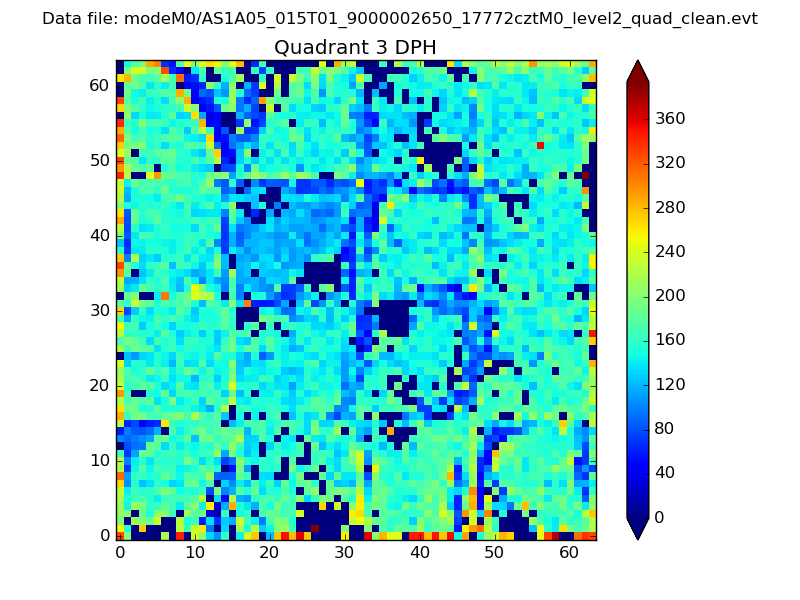 |
 |
Quadrant C |
| Plot type | Count rate plots | Images |
|---|---|---|
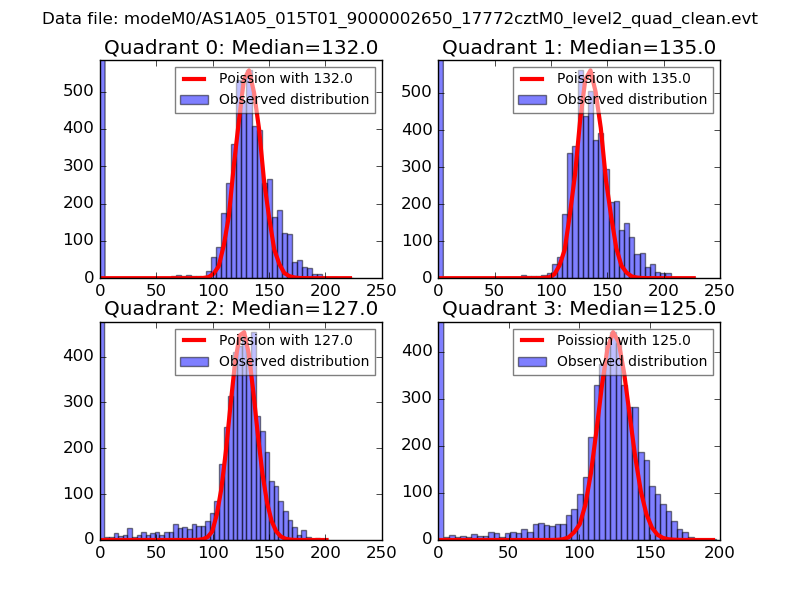
| Comparison with Poisson distribution Blue bars denote a histogram of data divided into 1 sec bins. Red curve is a Poisson curve with rate = median count rate of data. |
 |
 |
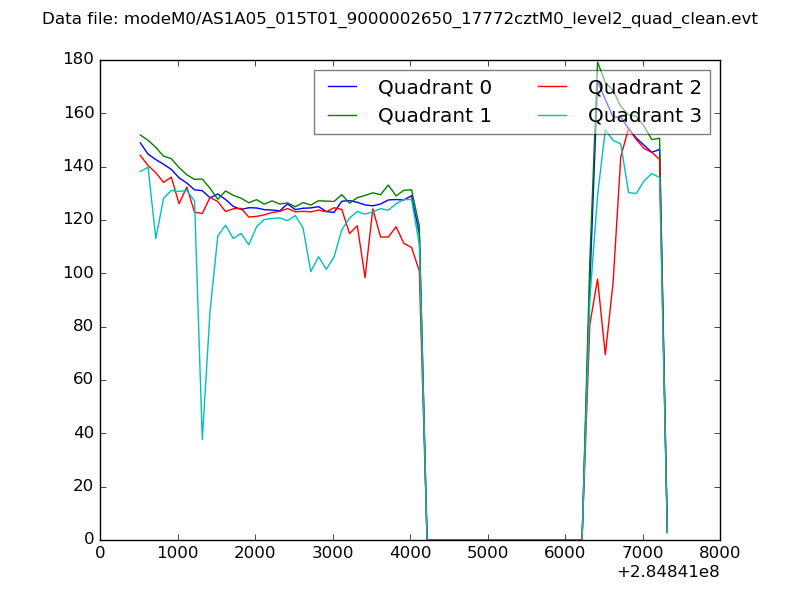
| Quadrant-wise count rates Data is divided into 100 sec bins |
 |
|
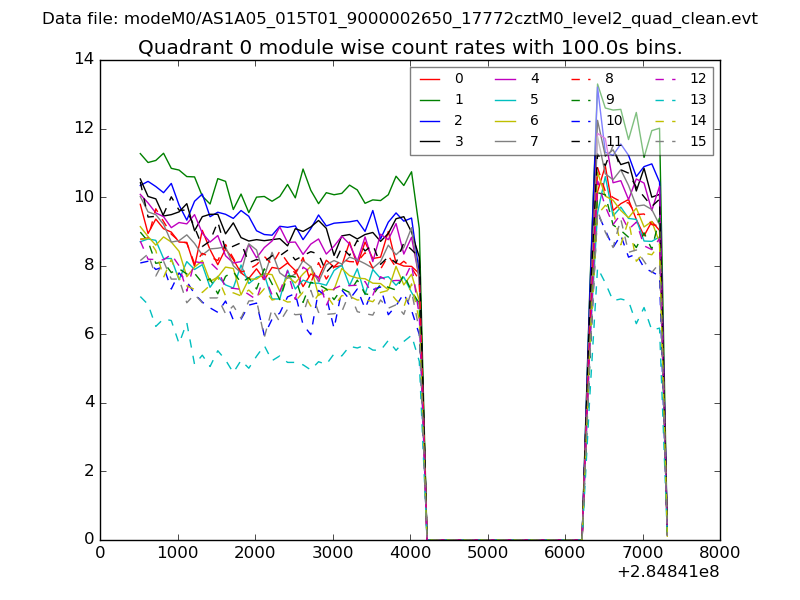
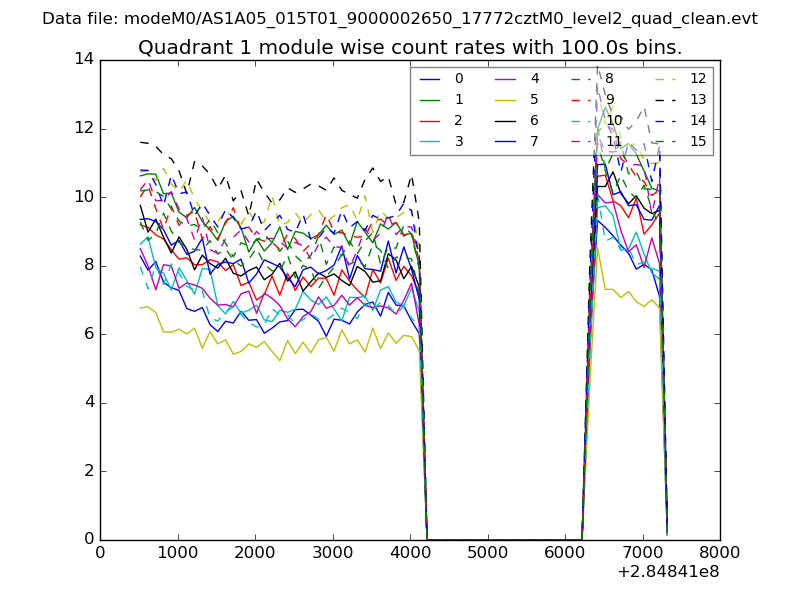
| Module-wise count rates for Quadrant A Data is divided into 100 sec bins |
 |
 |
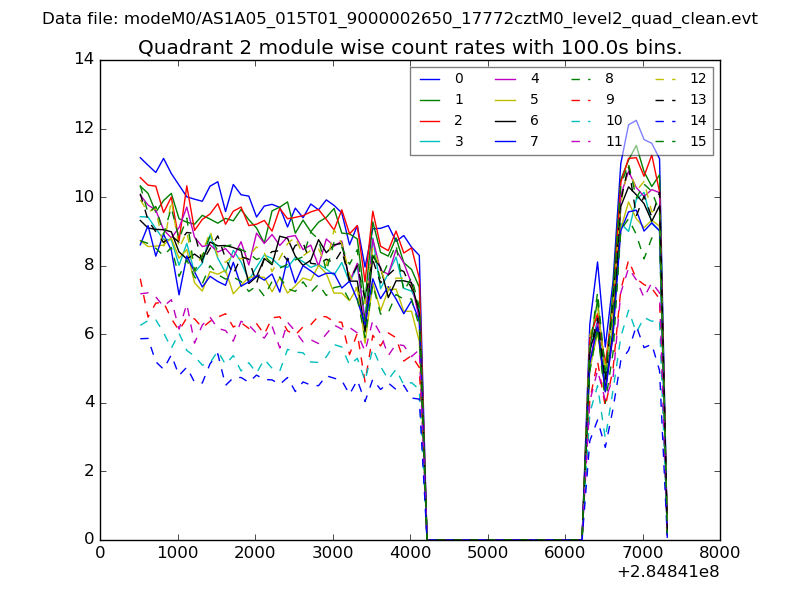
| Module-wise count rates for Quadrant B Data is divided into 100 sec bins |
 |
 |
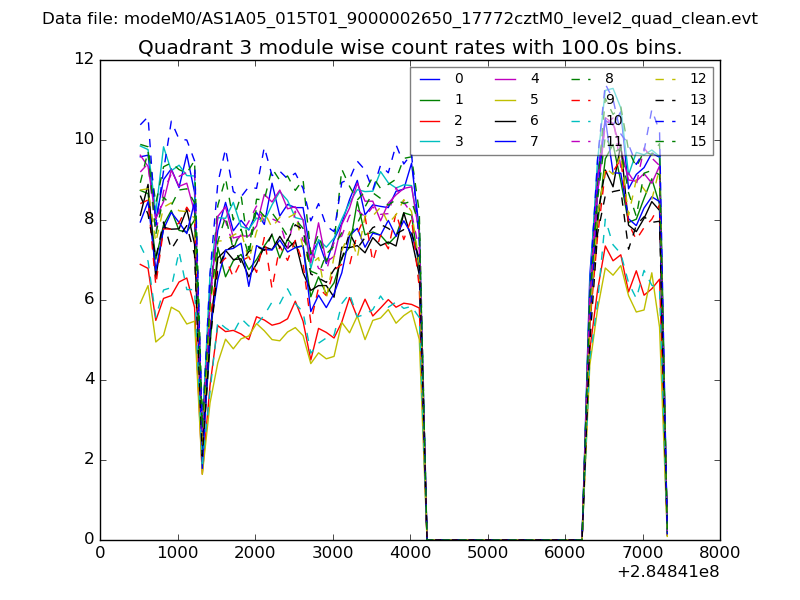
| Module-wise count rates for Quadrant C Data is divided into 100 sec bins |
 |
 |
| Module-wise count rates for Quadrant D Data is divided into 100 sec bins |
 |
 |
| Parameter | Plot |
|---|---|
| CZT HV Monitor | 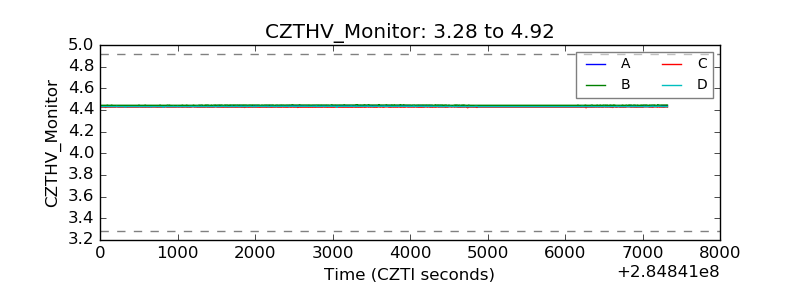 |
| D_VDD | 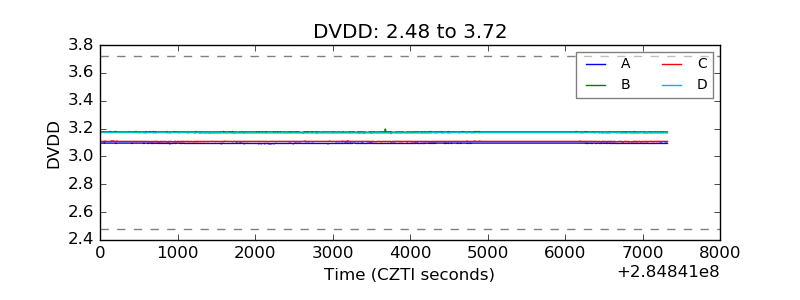 |
| Temperature 1 | 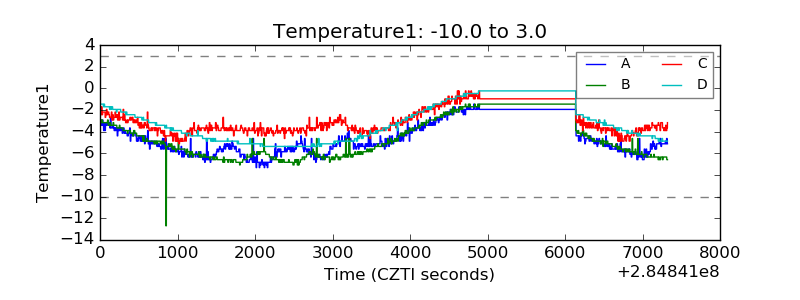 |
| Veto HV Monitor | 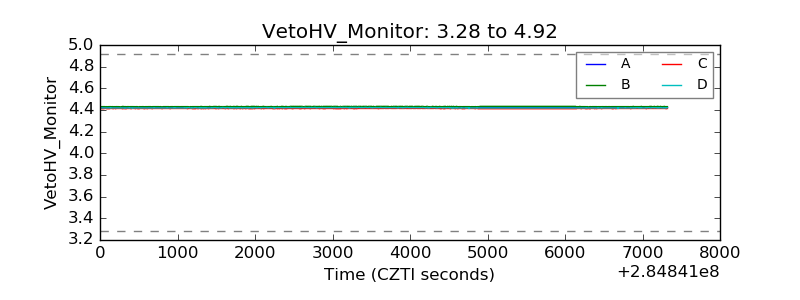 |
| Veto LLD | 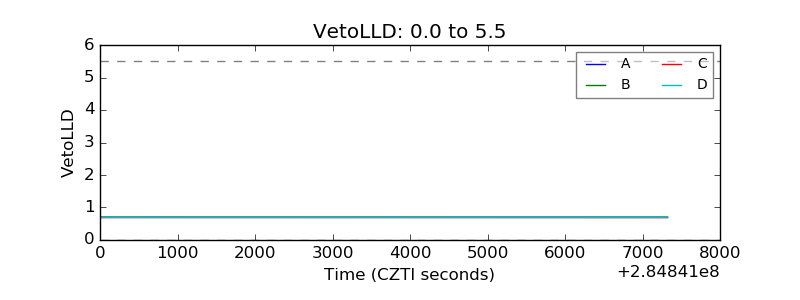 |
| Alpha Counter | 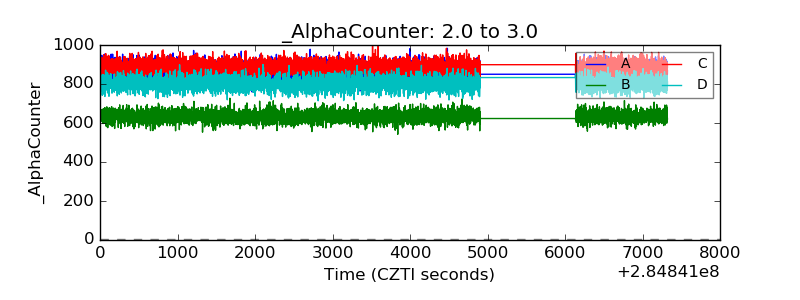 |
| _CPM_Rate | 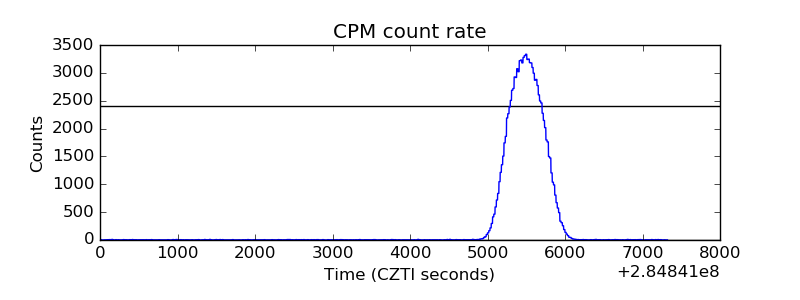 |
| CZT Counter | 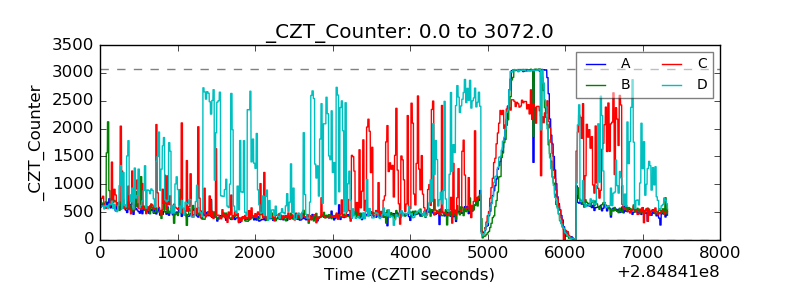 |
| +2.5 Volts monitor |  |
| +5 Volts monitor |  |
| _ROLL_ROT |  |
| _Roll_DEC |  |
| _Roll_RA | 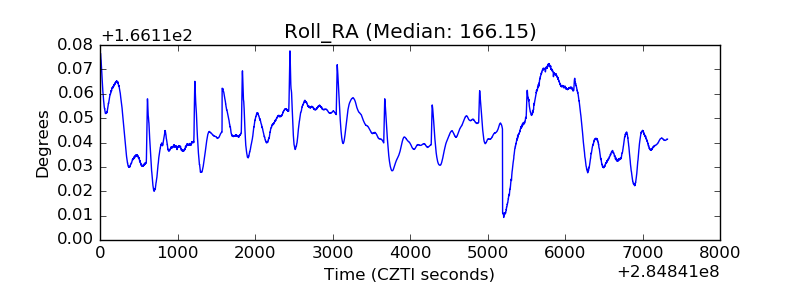 |
| Veto Counter | 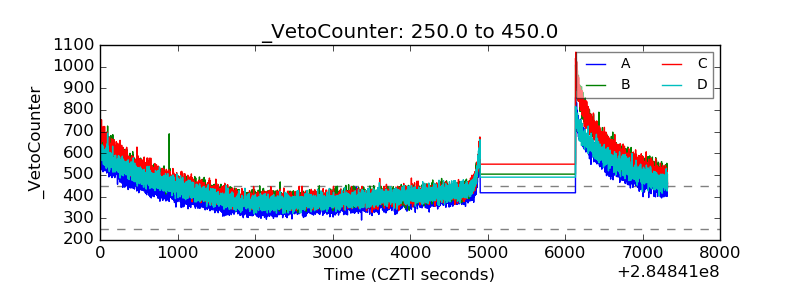 |