| Param | Original file | Final file |
|---|---|---|
| Filename | modeM0/AS1A05_015T01_9000002650_17773cztM0_level2.evt | modeM0/AS1A05_015T01_9000002650_17773cztM0_level2_quad_clean.evt |
| Size (bytes) | 611,012,160 | 103,403,520 |
| Size | 582.7 MB | 98.6 MB |
| Events in quadrant A | 3,266,132 | 693,476 |
| Events in quadrant B | 3,408,782 | 718,133 |
| Events in quadrant C | 5,579,214 | 631,355 |
| Events in quadrant D | 5,803,685 | 628,461 |
| Mode SS | |||
|---|---|---|---|
| Quadrant | BADHDUFLAG | Total packets | Discarded packets |
| A | 0 | 138 | 0 |
| B | 0 | 138 | 0 |
| C | 0 | 138 | 0 |
| D | 0 | 138 | 0 |
| Mode M9 | |||
|---|---|---|---|
| Quadrant | BADHDUFLAG | Total packets | Discarded packets |
| A | 0 | 25 | 0 |
| B | 0 | 25 | 0 |
| C | 0 | 25 | 0 |
| D | 0 | 25 | 0 |
| Mode M0 | |||
|---|---|---|---|
| Quadrant | BADHDUFLAG | Total packets | Discarded packets |
| A | 0 | 13950 | 3 |
| B | 0 | 14402 | 2 |
| C | 0 | 20750 | 2 |
| D | 0 | 21918 | 2 |
| Quadrant | Total seconds | Saturated seconds | Saturation percentage |
|---|---|---|---|
| A | 6584 | 32 | 0.486027% |
| B | 6585 | 55 | 0.835232% |
| C | 6585 | 1040 | 15.793470% |
| D | 6585 | 856 | 12.999241% |
Noise dominated data is calculated using 1-second bins in cleaned event files. If a bin has >2000 counts, and if more than 50% of those come from <1% of pixels, then it is considered to be noise-dominated and hence unusable.
| Quadrant | # 1 sec bins | Bins with >0 counts | Bins with >2000 counts | High rate bins dominated by noise | Noise dominated (total time) | Noise dominated (detector-on time) | Marked lightcurve |
|---|---|---|---|---|---|---|---|
| A | 9149 | 6586 | 0 | 0 | 0.00% | 0.00% | 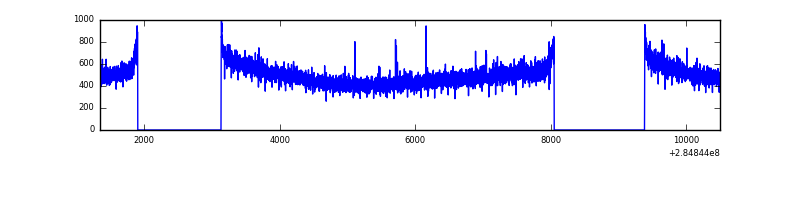 |
| B | 9150 | 6587 | 2 | 2 | 0.02% | 0.03% | 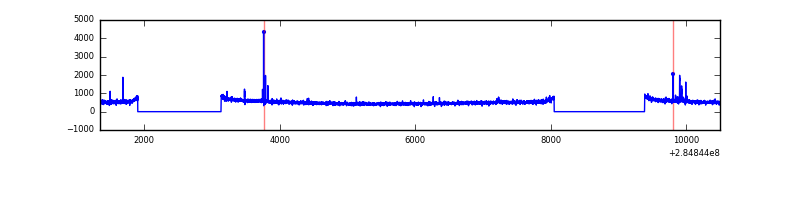 |
| C | 9150 | 6586 | 597 | 597 | 6.52% | 9.06% | 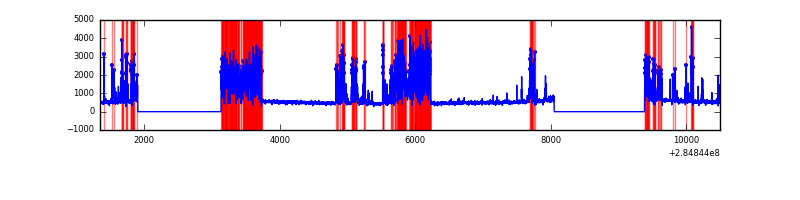 |
| D | 9150 | 6586 | 740 | 740 | 8.09% | 11.24% | 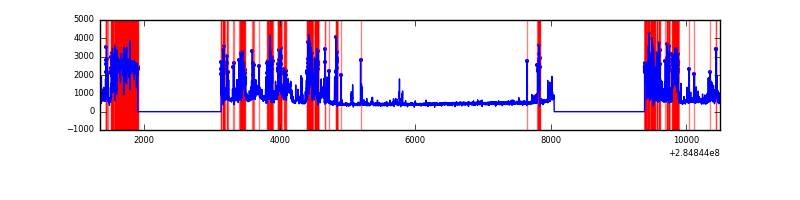 |
Top three noisy pixels from each quadrant. If the there are fewer than three noisy pixels in the level2.evt file, extra rows are filled as -1
| Pixel properties | Quadrant properties | ||||||
|---|---|---|---|---|---|---|---|
| Quadrant | DetID | PixID | Counts | Sigma | Mean | Median | Sigma |
| A | 12 | 16 | 12990 | 71.69 | 845 | 828 | 169.6 |
| A | 12 | 194 | 8225 | 43.6 | 845 | 828 | 169.6 |
| A | 0 | 226 | 7373 | 38.58 | 845 | 828 | 169.6 |
| B | 0 | 219 | 36042 | 221.4 | 853 | 833 | 159.0 |
| B | 12 | 111 | 18311 | 109.91 | 853 | 833 | 159.0 |
| B | 11 | 111 | 15855 | 94.46 | 853 | 833 | 159.0 |
| C | 4 | 254 | 2439015 | 14025.45 | 754 | 763 | 173.8 |
| C | 14 | 238 | 117927 | 673.96 | 754 | 763 | 173.8 |
| C | 5 | 218 | 46695 | 264.21 | 754 | 763 | 173.8 |
| D | 7 | 238 | 2789966 | 15688.94 | 752 | 736 | 177.8 |
| D | 10 | 70 | 92486 | 516.08 | 752 | 736 | 177.8 |
| D | 2 | 234 | 27443 | 150.22 | 752 | 736 | 177.8 |
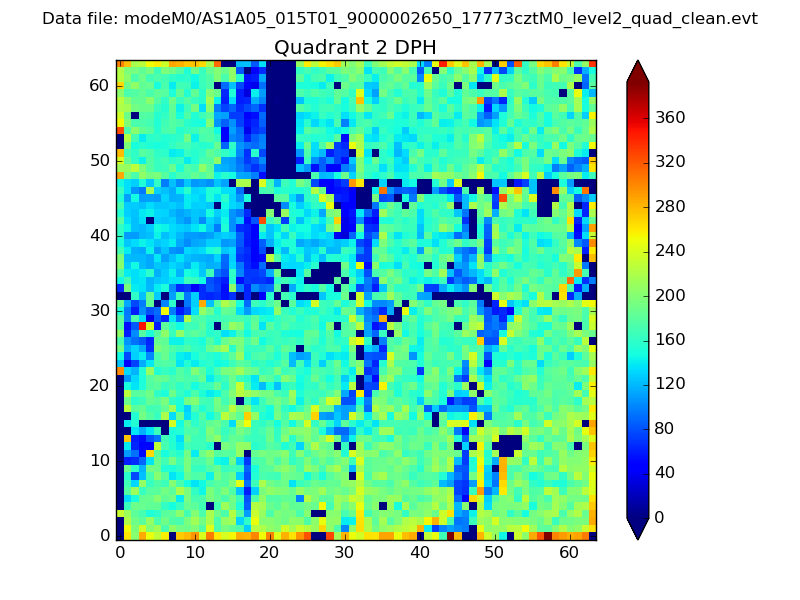
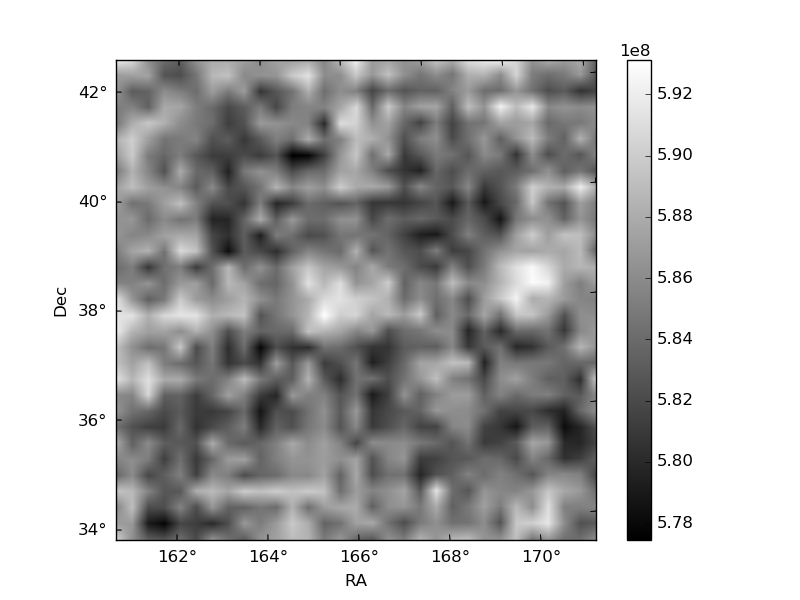
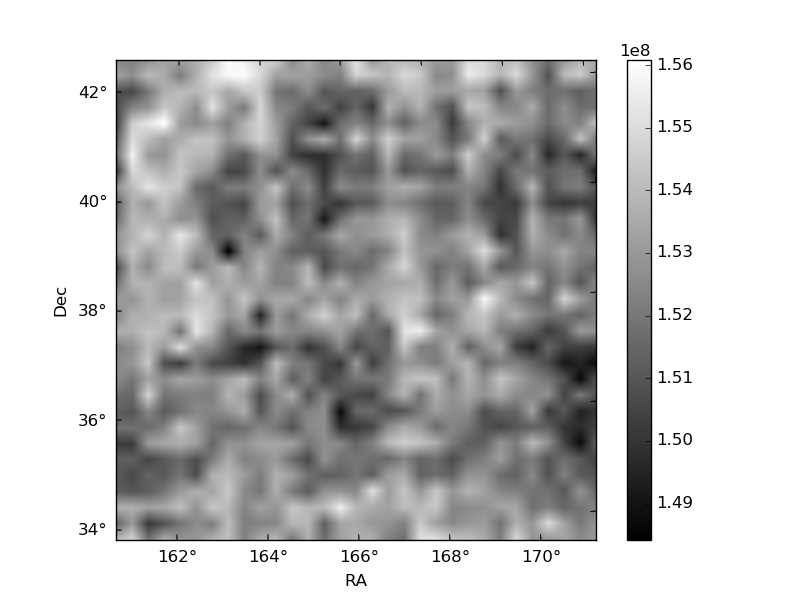
Histogram calculated using DETX and DETY for each event in the final _common_clean file
| Quadrant A | 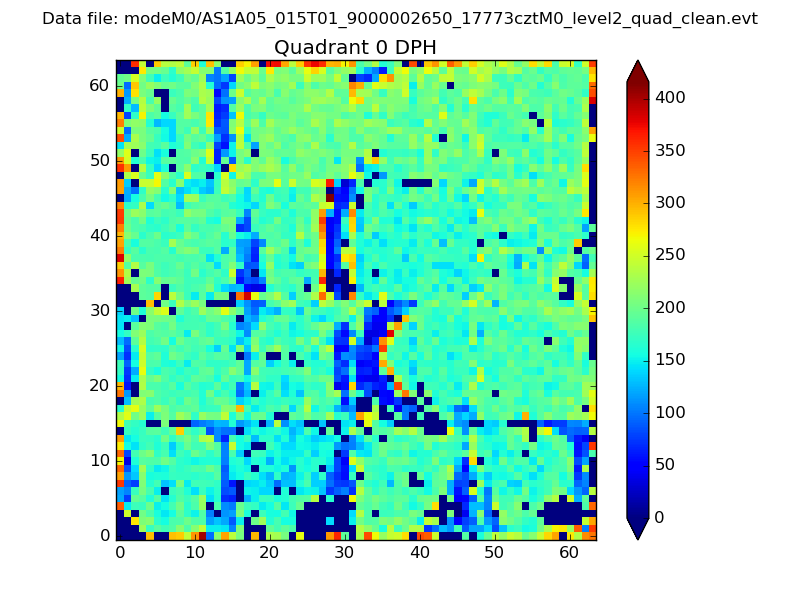 |
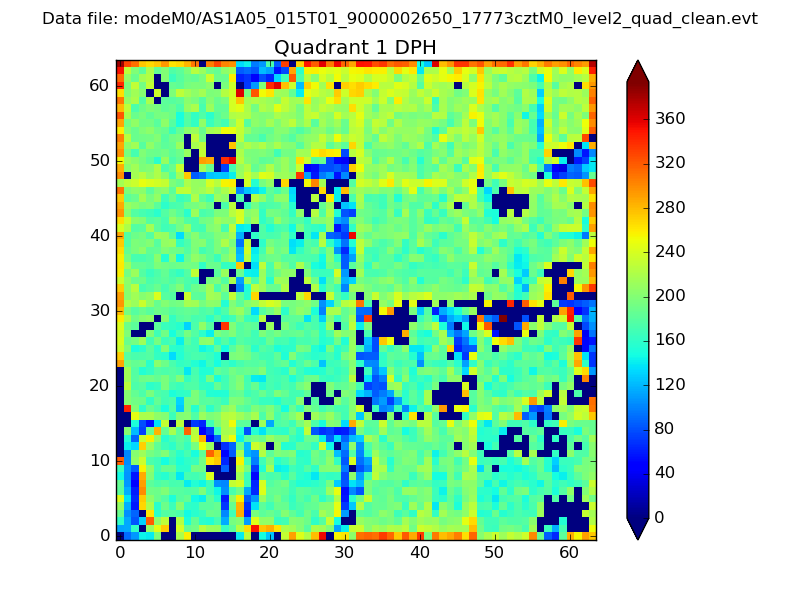 |
Quadrant B |
|---|---|---|---|
| Quadrant D | 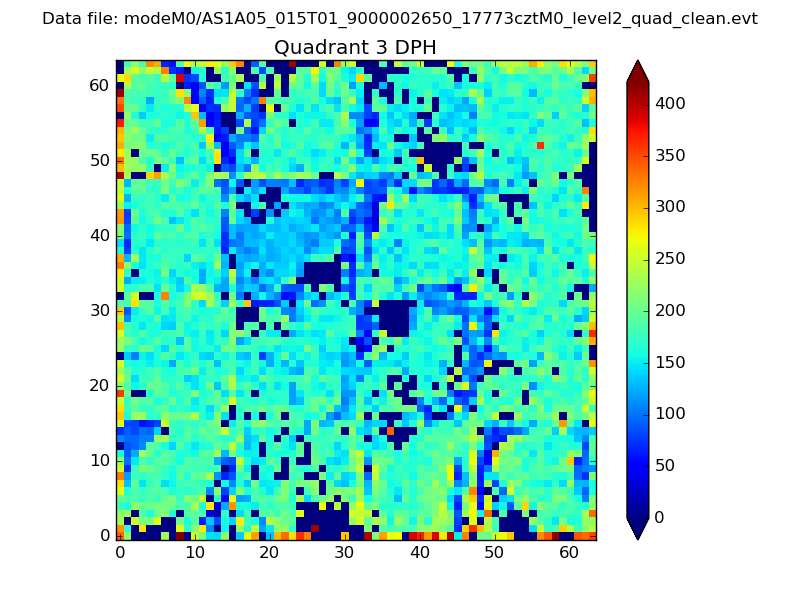 |
 |
Quadrant C |
| Plot type | Count rate plots | Images |
|---|---|---|
| Comparison with Poisson distribution Blue bars denote a histogram of data divided into 1 sec bins. Red curve is a Poisson curve with rate = median count rate of data. |
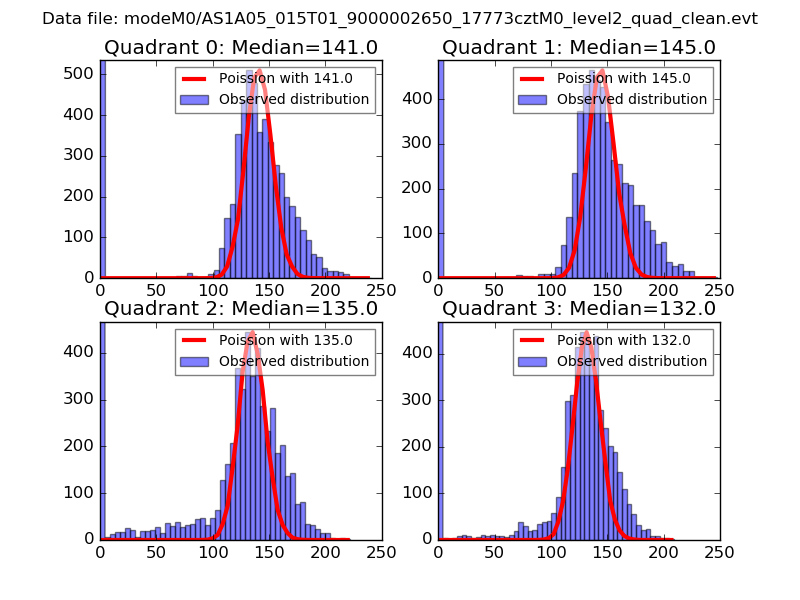 |
 |
| Quadrant-wise count rates Data is divided into 100 sec bins |
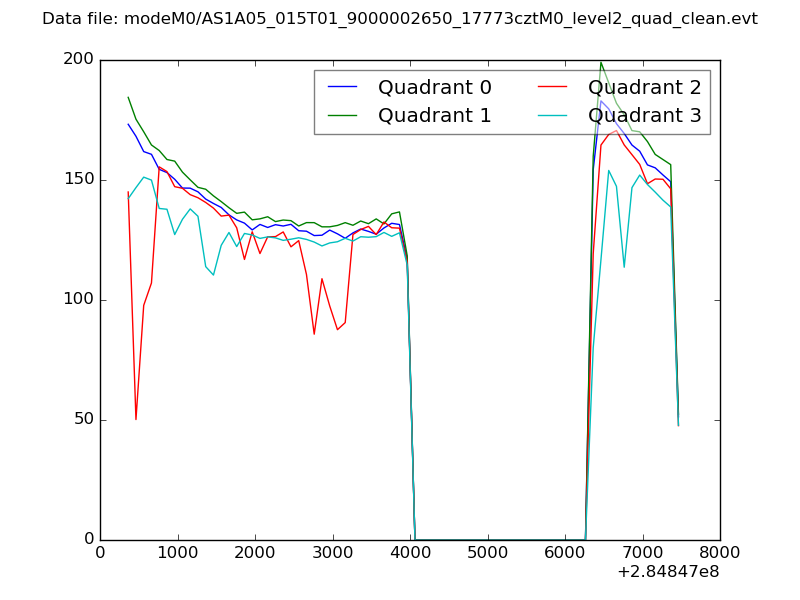 |
|
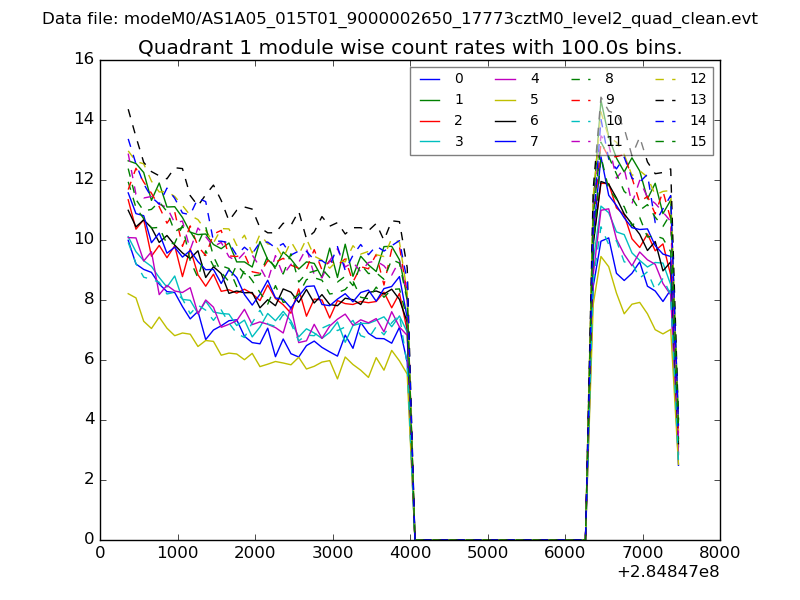
| Module-wise count rates for Quadrant A Data is divided into 100 sec bins |
 |
 |
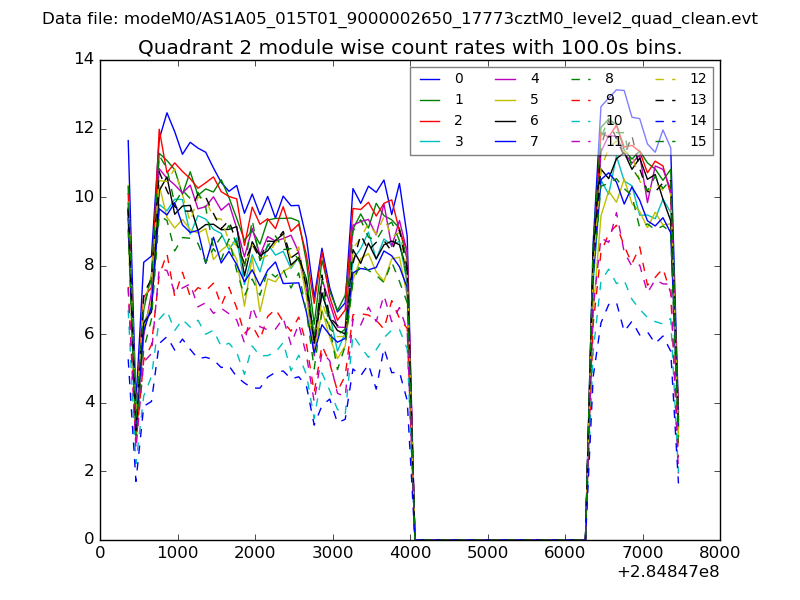
| Module-wise count rates for Quadrant B Data is divided into 100 sec bins |
 |
 |
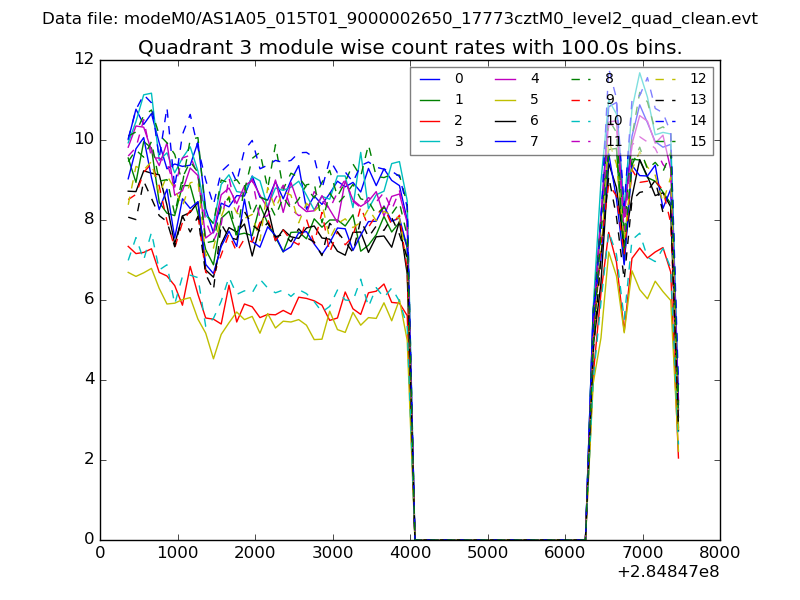
| Module-wise count rates for Quadrant C Data is divided into 100 sec bins |
 |
 |
| Module-wise count rates for Quadrant D Data is divided into 100 sec bins |
 |
 |
| Parameter | Plot |
|---|---|
| CZT HV Monitor | 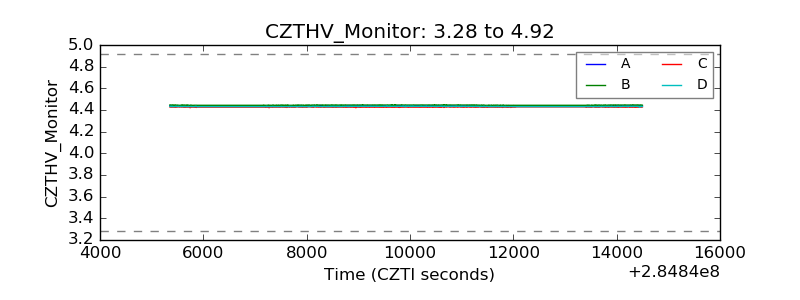 |
| D_VDD | 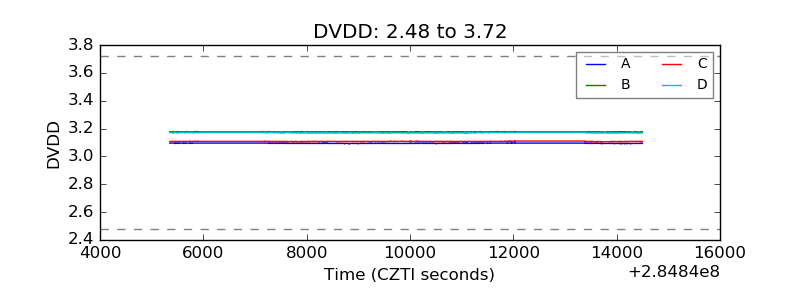 |
| Temperature 1 |  |
| Veto HV Monitor | 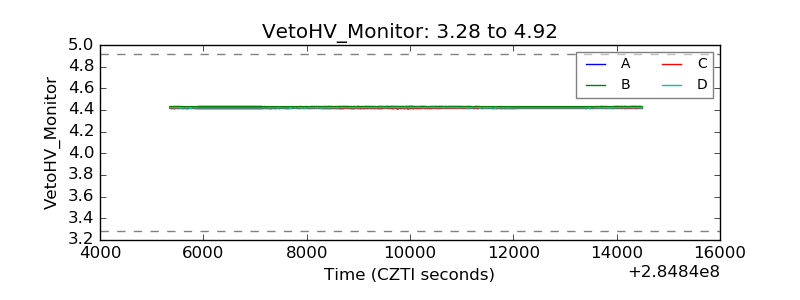 |
| Veto LLD | 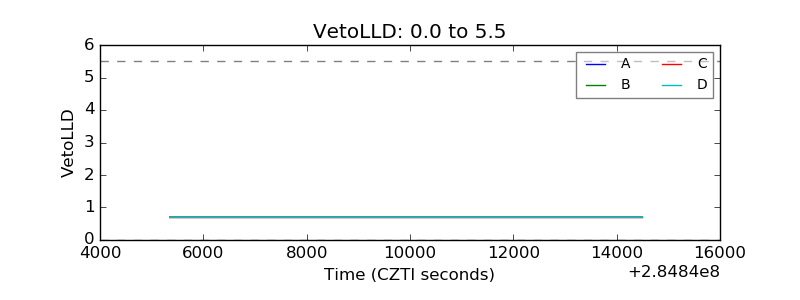 |
| Alpha Counter | 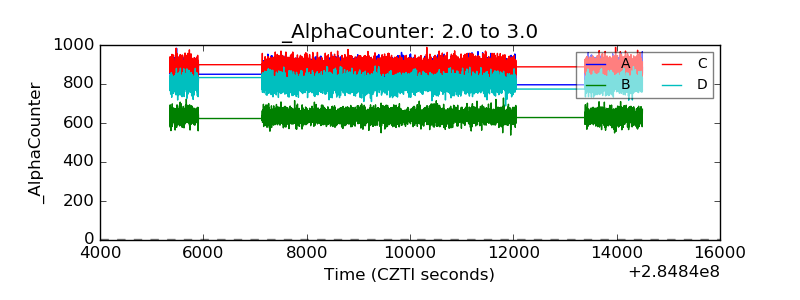 |
| _CPM_Rate | 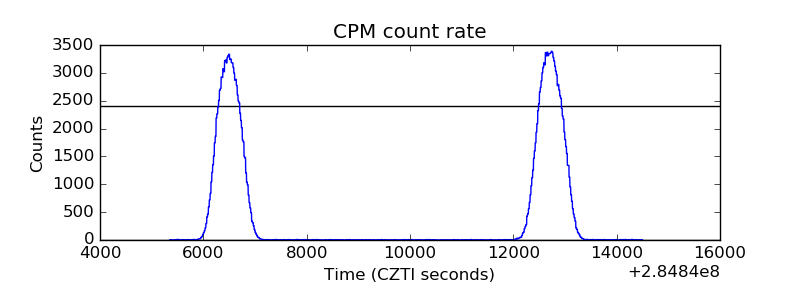 |
| CZT Counter | 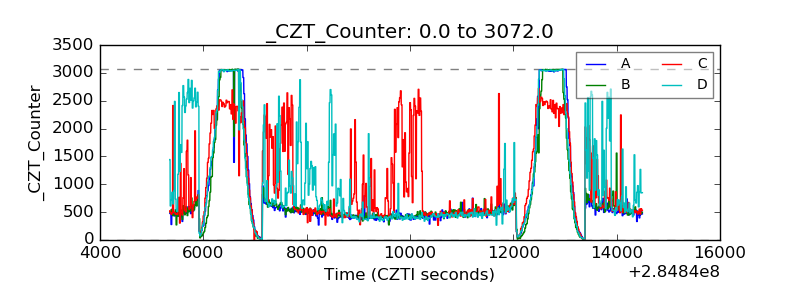 |
| +2.5 Volts monitor |  |
| +5 Volts monitor |  |
| _ROLL_ROT | 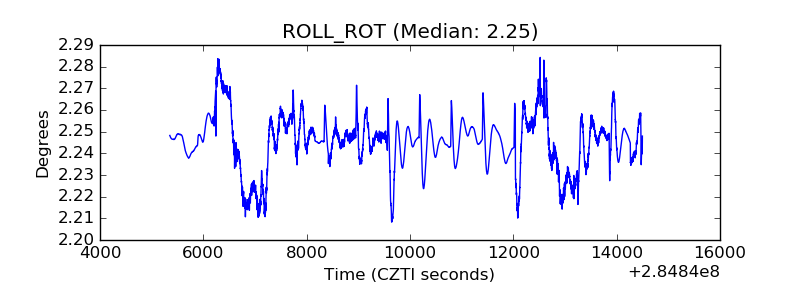 |
| _Roll_DEC | 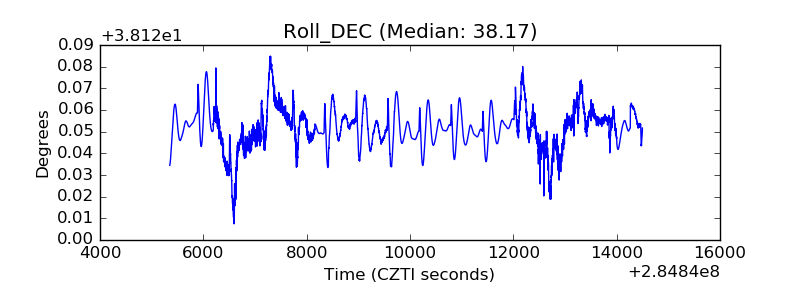 |
| _Roll_RA | 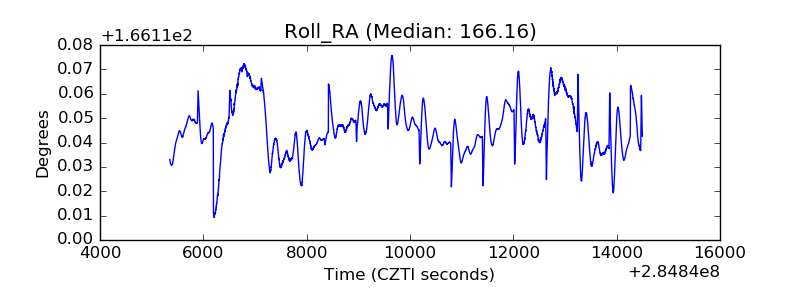 |
| Veto Counter | 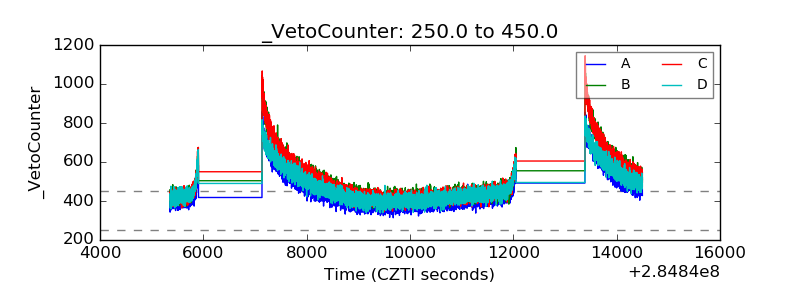 |