| Param | Original file | Final file |
|---|---|---|
| Filename | modeM0/AS1A05_015T01_9000002650_17775cztM0_level2.evt | modeM0/AS1A05_015T01_9000002650_17775cztM0_level2_quad_clean.evt |
| Size (bytes) | 524,540,160 | 102,496,320 |
| Size | 500.2 MB | 97.7 MB |
| Events in quadrant A | 3,145,764 | 681,720 |
| Events in quadrant B | 3,280,022 | 705,882 |
| Events in quadrant C | 3,828,247 | 661,009 |
| Events in quadrant D | 5,189,337 | 600,690 |
| Mode SS | |||
|---|---|---|---|
| Quadrant | BADHDUFLAG | Total packets | Discarded packets |
| A | 0 | 134 | 0 |
| B | 0 | 134 | 0 |
| C | 0 | 134 | 0 |
| D | 0 | 134 | 0 |
| Mode M9 | |||
|---|---|---|---|
| Quadrant | BADHDUFLAG | Total packets | Discarded packets |
| A | 0 | 27 | 0 |
| B | 0 | 27 | 0 |
| C | 0 | 27 | 0 |
| D | 0 | 27 | 0 |
| Mode M0 | |||
|---|---|---|---|
| Quadrant | BADHDUFLAG | Total packets | Discarded packets |
| A | 0 | 13546 | 2 |
| B | 0 | 13842 | 2 |
| C | 0 | 15437 | 3 |
| D | 0 | 19833 | 2 |
| Quadrant | Total seconds | Saturated seconds | Saturation percentage |
|---|---|---|---|
| A | 6520 | 30 | 0.460123% |
| B | 6521 | 56 | 0.858764% |
| C | 6520 | 221 | 3.389571% |
| D | 6520 | 543 | 8.328221% |
Noise dominated data is calculated using 1-second bins in cleaned event files. If a bin has >2000 counts, and if more than 50% of those come from <1% of pixels, then it is considered to be noise-dominated and hence unusable.
| Quadrant | # 1 sec bins | Bins with >0 counts | Bins with >2000 counts | High rate bins dominated by noise | Noise dominated (total time) | Noise dominated (detector-on time) | Marked lightcurve |
|---|---|---|---|---|---|---|---|
| A | 7865 | 6521 | 0 | 0 | 0.00% | 0.00% | 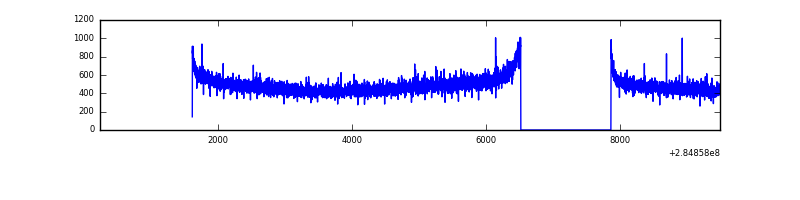 |
| B | 9241 | 6523 | 4 | 4 | 0.04% | 0.06% | 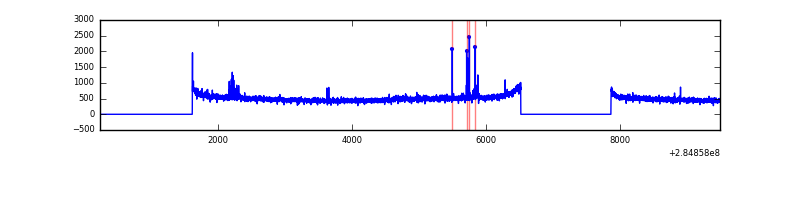 |
| C | 9240 | 6522 | 83 | 83 | 0.90% | 1.27% | 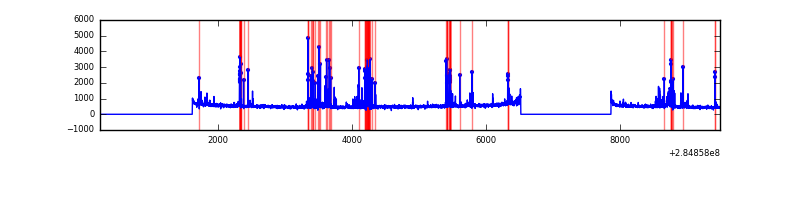 |
| D | 9240 | 6522 | 450 | 450 | 4.87% | 6.90% | 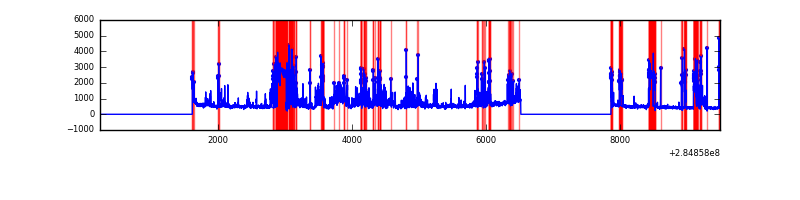 |
Top three noisy pixels from each quadrant. If the there are fewer than three noisy pixels in the level2.evt file, extra rows are filled as -1
| Pixel properties | Quadrant properties | ||||||
|---|---|---|---|---|---|---|---|
| Quadrant | DetID | PixID | Counts | Sigma | Mean | Median | Sigma |
| A | 0 | 226 | 7164 | 39.13 | 817 | 804 | 162.5 |
| A | 12 | 194 | 6275 | 33.66 | 817 | 804 | 162.5 |
| A | 3 | 137 | 5783 | 30.64 | 817 | 804 | 162.5 |
| B | 4 | 80 | 29322 | 183.98 | 825 | 807 | 155.0 |
| B | 12 | 111 | 17786 | 109.55 | 825 | 807 | 155.0 |
| B | 11 | 111 | 15369 | 93.96 | 825 | 807 | 155.0 |
| C | 4 | 254 | 543433 | 2995.57 | 781 | 785 | 181.1 |
| C | 14 | 238 | 125205 | 686.83 | 781 | 785 | 181.1 |
| C | 3 | 233 | 65524 | 357.38 | 781 | 785 | 181.1 |
| D | 7 | 238 | 2242582 | 12607.9 | 748 | 731 | 177.8 |
| D | 12 | 110 | 41682 | 230.3 | 748 | 731 | 177.8 |
| D | 2 | 234 | 29855 | 163.79 | 748 | 731 | 177.8 |
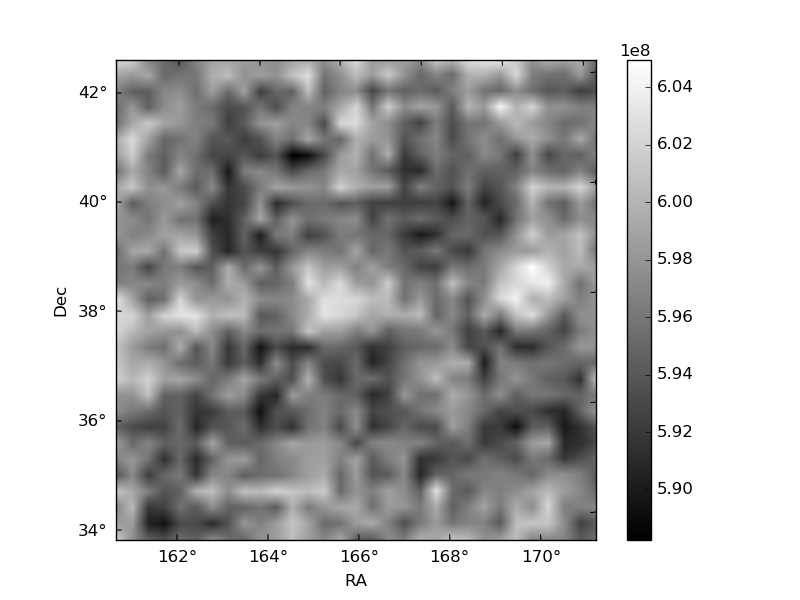
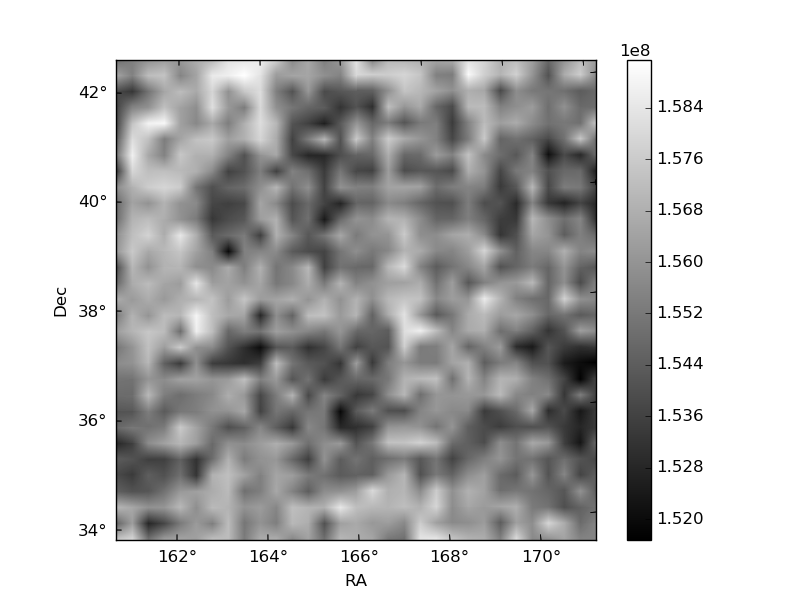
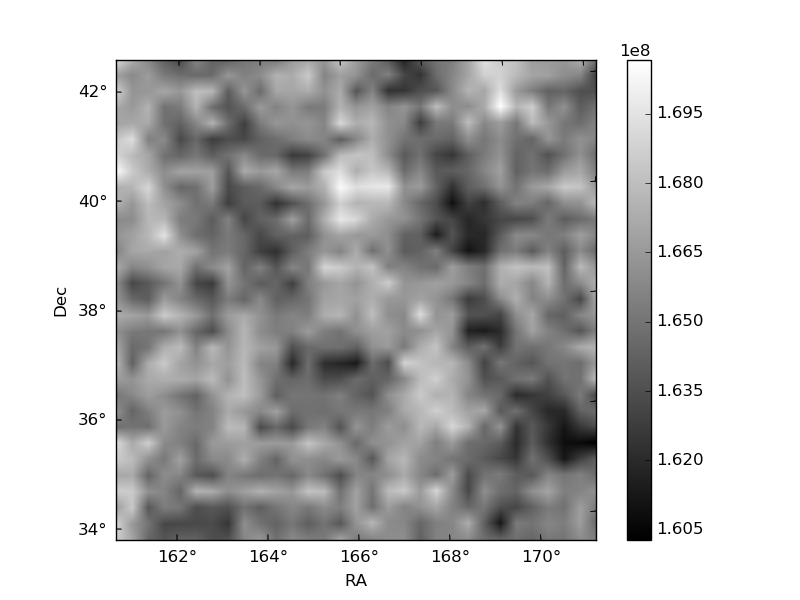
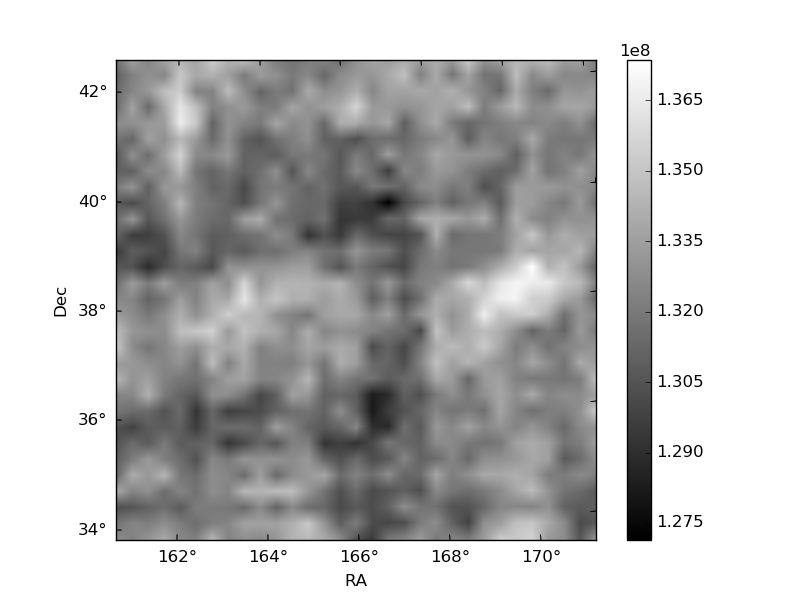
Histogram calculated using DETX and DETY for each event in the final _common_clean file
| Quadrant A | 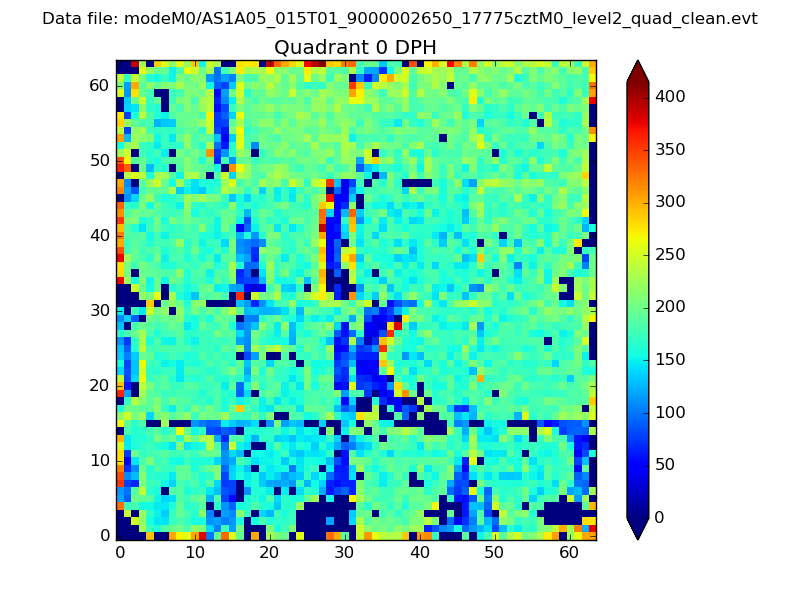 |
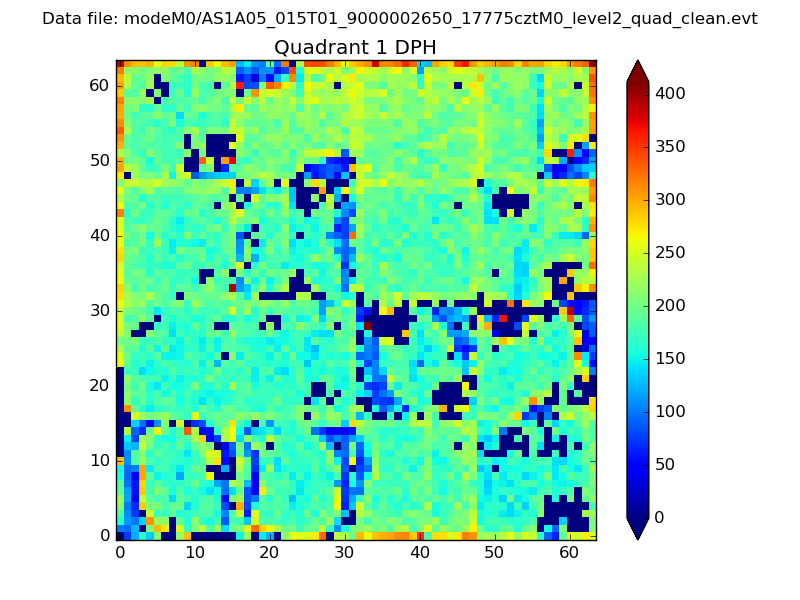 |
Quadrant B |
|---|---|---|---|
| Quadrant D |  |
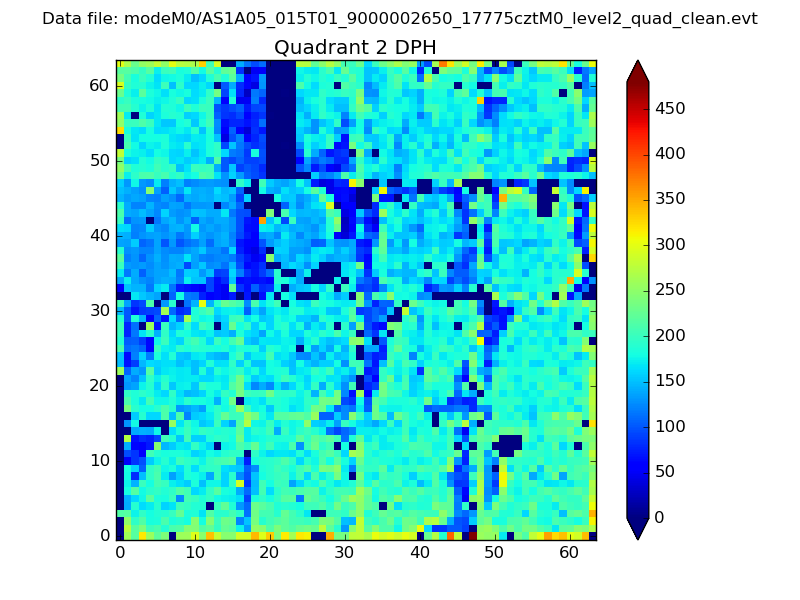 |
Quadrant C |
| Plot type | Count rate plots | Images |
|---|---|---|
| Comparison with Poisson distribution Blue bars denote a histogram of data divided into 1 sec bins. Red curve is a Poisson curve with rate = median count rate of data. |
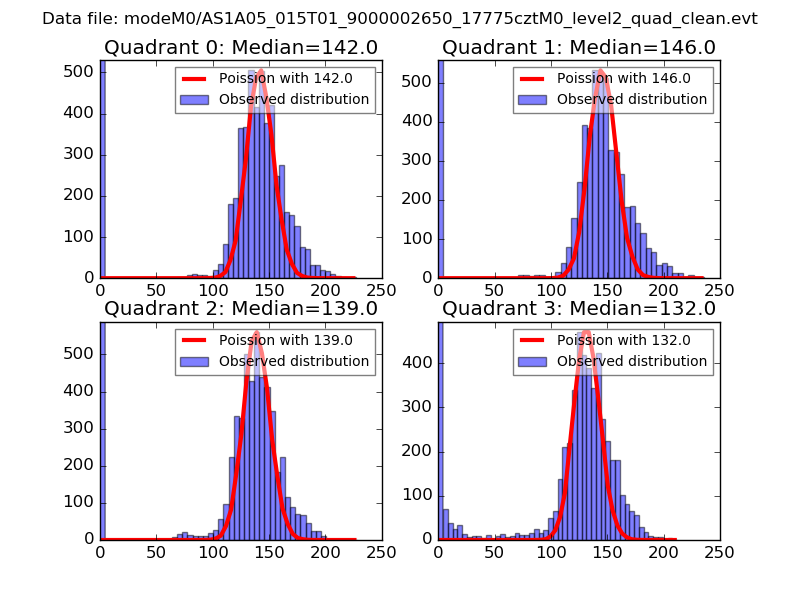 |
 |
| Quadrant-wise count rates Data is divided into 100 sec bins |
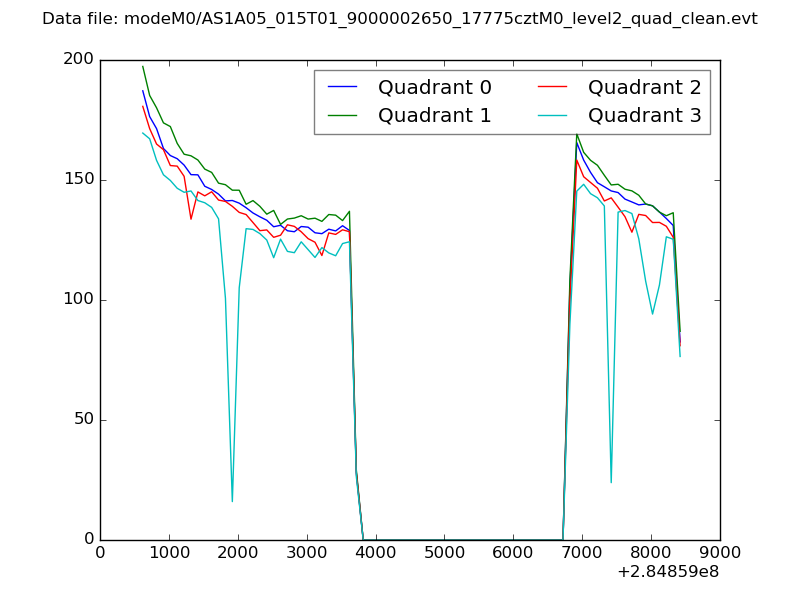 |
|
| Module-wise count rates for Quadrant A Data is divided into 100 sec bins |
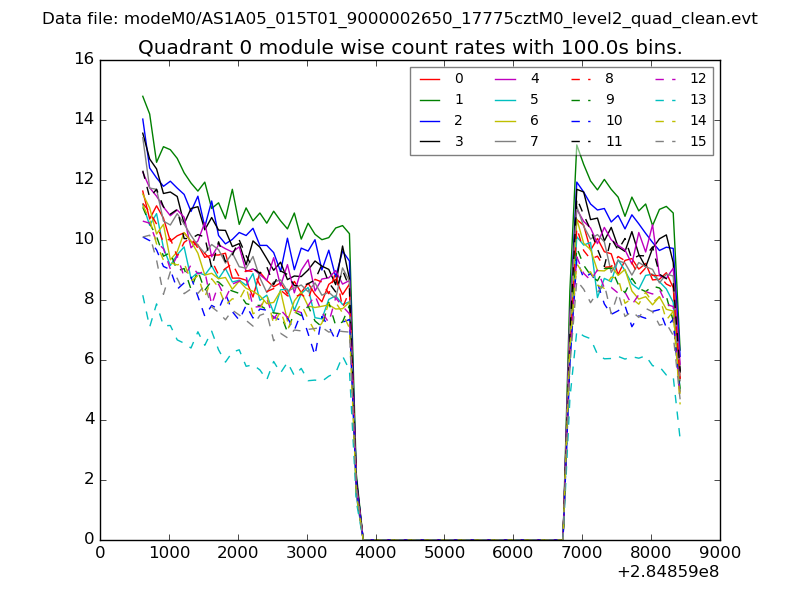 |
 |
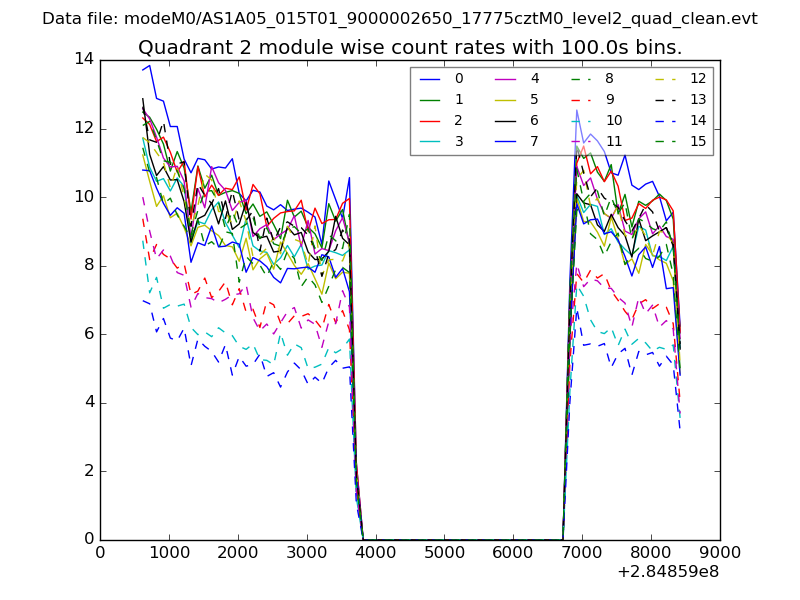
| Module-wise count rates for Quadrant B Data is divided into 100 sec bins |
 |
 |
| Module-wise count rates for Quadrant C Data is divided into 100 sec bins |
 |
 |
| Module-wise count rates for Quadrant D Data is divided into 100 sec bins |
 |
 |
| Parameter | Plot |
|---|---|
| CZT HV Monitor | 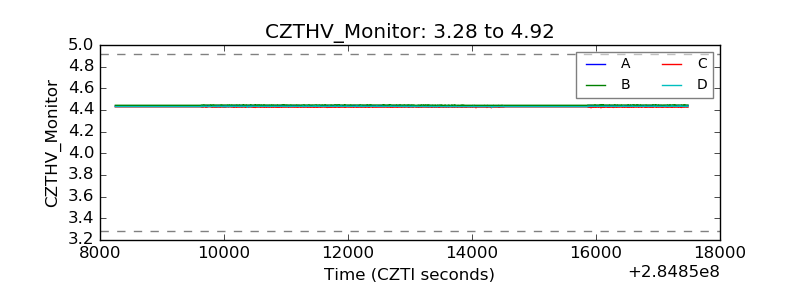 |
| D_VDD | 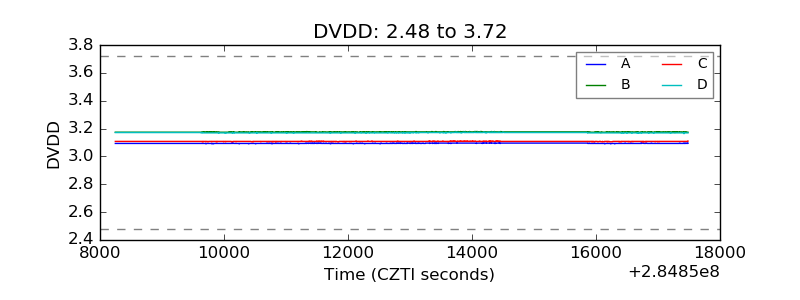 |
| Temperature 1 | 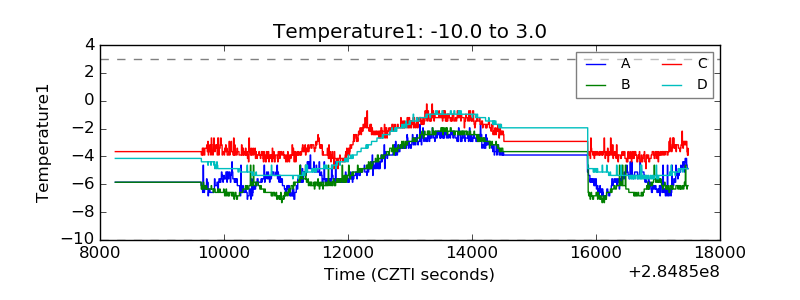 |
| Veto HV Monitor | 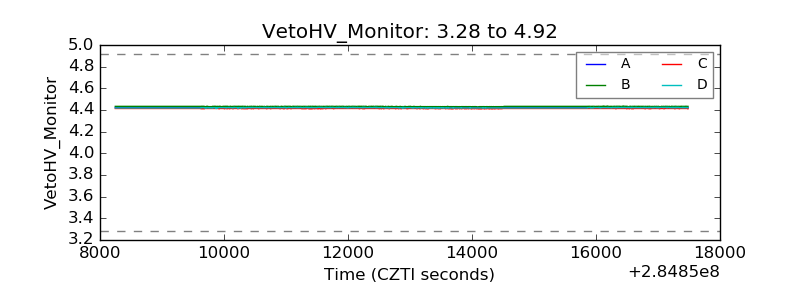 |
| Veto LLD | 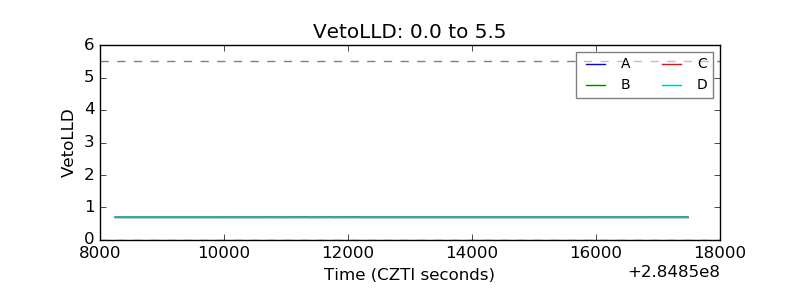 |
| Alpha Counter | 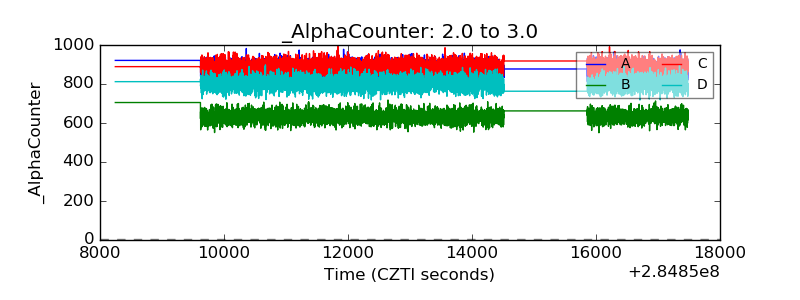 |
| _CPM_Rate | 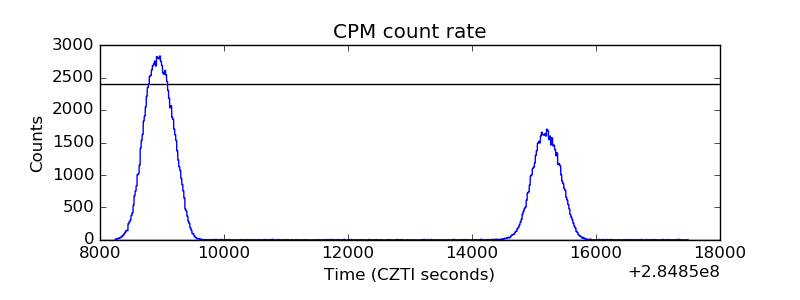 |
| CZT Counter | 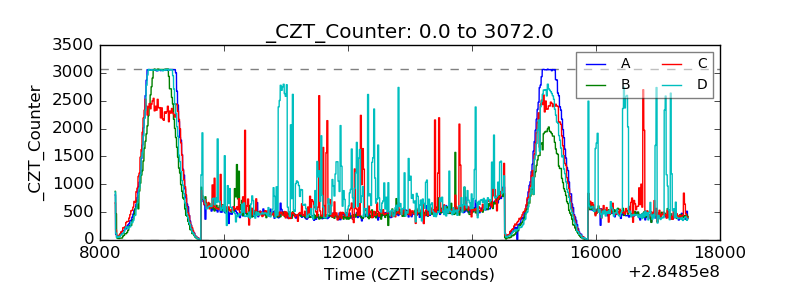 |
| +2.5 Volts monitor | 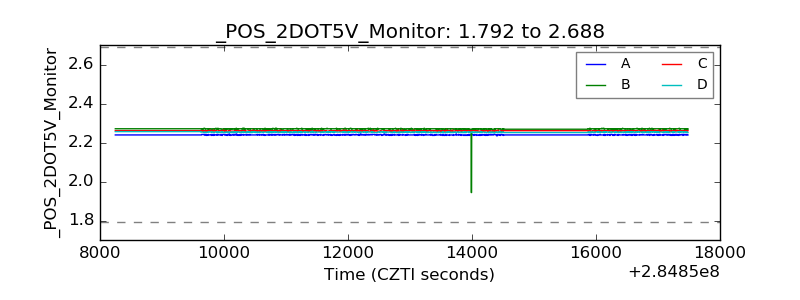 |
| +5 Volts monitor | 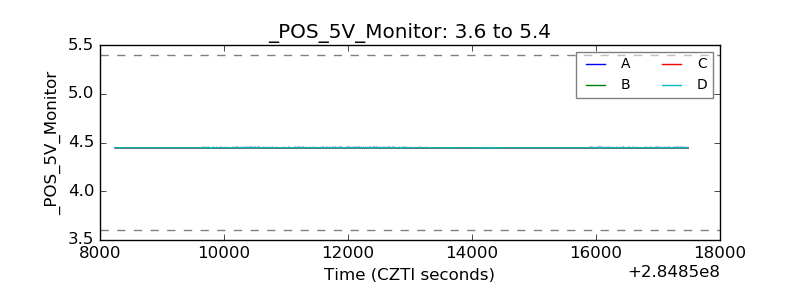 |
| _ROLL_ROT | 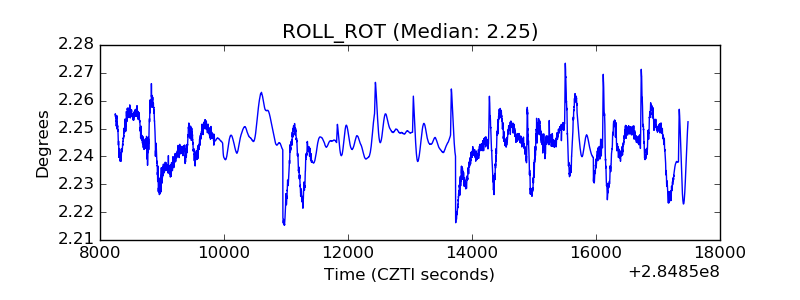 |
| _Roll_DEC | 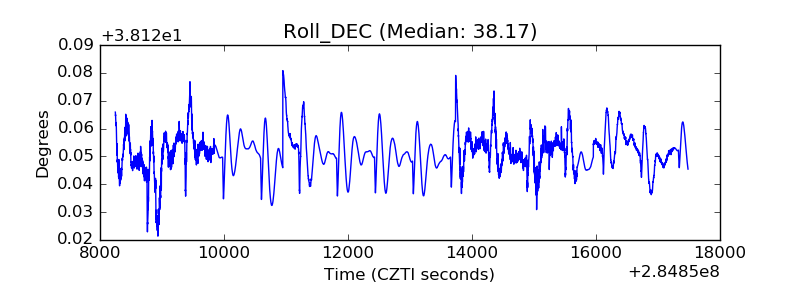 |
| _Roll_RA | 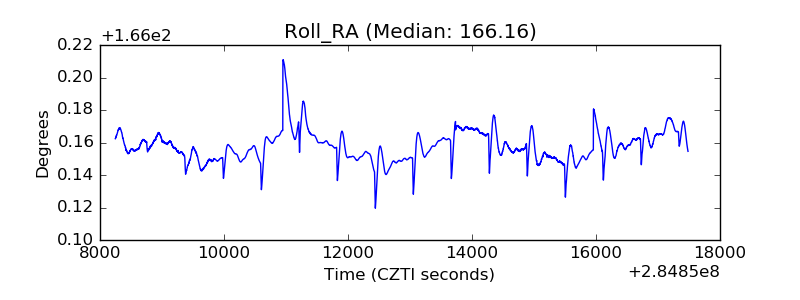 |
| Veto Counter | 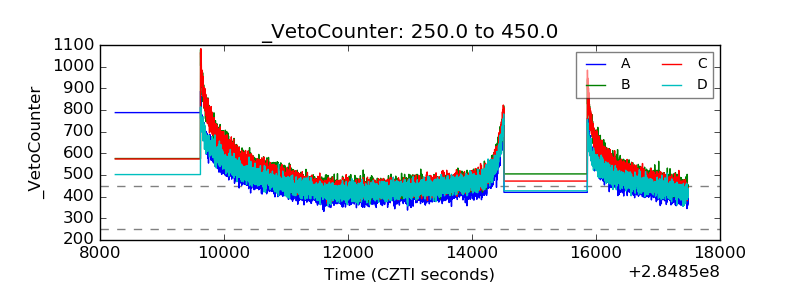 |