| Param | Original file | Final file |
|---|---|---|
| Filename | modeM0/AS1A05_015T01_9000002650_17776cztM0_level2.evt | modeM0/AS1A05_015T01_9000002650_17776cztM0_level2_quad_clean.evt |
| Size (bytes) | 498,024,000 | 93,790,080 |
| Size | 475.0 MB | 89.4 MB |
| Events in quadrant A | 3,120,665 | 612,876 |
| Events in quadrant B | 3,229,163 | 628,228 |
| Events in quadrant C | 4,459,431 | 575,067 |
| Events in quadrant D | 3,821,506 | 560,125 |
| Mode SS | |||
|---|---|---|---|
| Quadrant | BADHDUFLAG | Total packets | Discarded packets |
| A | 0 | 136 | 0 |
| B | 0 | 136 | 0 |
| C | 0 | 136 | 0 |
| D | 0 | 136 | 0 |
| Mode M9 | |||
|---|---|---|---|
| Quadrant | BADHDUFLAG | Total packets | Discarded packets |
| A | 0 | 14 | 0 |
| B | 0 | 15 | 0 |
| C | 0 | 15 | 0 |
| D | 0 | 15 | 0 |
| Mode M0 | |||
|---|---|---|---|
| Quadrant | BADHDUFLAG | Total packets | Discarded packets |
| A | 0 | 13694 | 2 |
| B | 0 | 13911 | 3 |
| C | 0 | 17552 | 2 |
| D | 0 | 16041 | 2 |
| Quadrant | Total seconds | Saturated seconds | Saturation percentage |
|---|---|---|---|
| A | 6650 | 12 | 0.180451% |
| B | 6649 | 24 | 0.360957% |
| C | 6649 | 480 | 7.219131% |
| D | 6649 | 234 | 3.519326% |
Noise dominated data is calculated using 1-second bins in cleaned event files. If a bin has >2000 counts, and if more than 50% of those come from <1% of pixels, then it is considered to be noise-dominated and hence unusable.
| Quadrant | # 1 sec bins | Bins with >0 counts | Bins with >2000 counts | High rate bins dominated by noise | Noise dominated (total time) | Noise dominated (detector-on time) | Marked lightcurve |
|---|---|---|---|---|---|---|---|
| A | 7885 | 6651 | 0 | 0 | 0.00% | 0.00% | 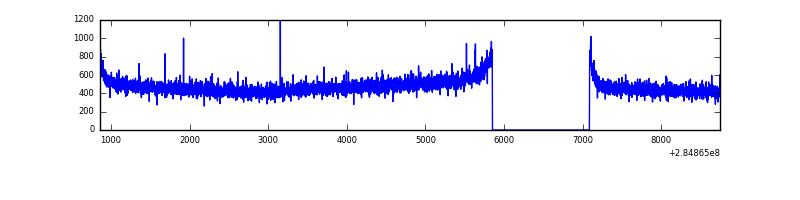 |
| B | 7884 | 6650 | 5 | 5 | 0.06% | 0.08% | 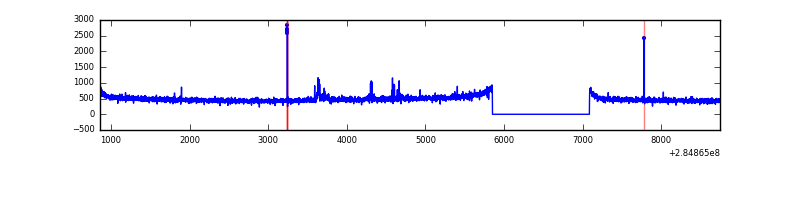 |
| C | 7884 | 6650 | 296 | 296 | 3.75% | 4.45% | 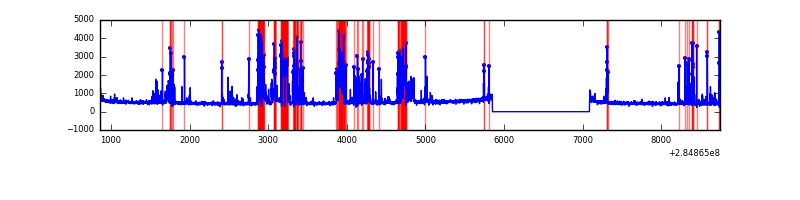 |
| D | 7884 | 6650 | 197 | 197 | 2.50% | 2.96% |  |
Top three noisy pixels from each quadrant. If the there are fewer than three noisy pixels in the level2.evt file, extra rows are filled as -1
| Pixel properties | Quadrant properties | ||||||
|---|---|---|---|---|---|---|---|
| Quadrant | DetID | PixID | Counts | Sigma | Mean | Median | Sigma |
| A | 0 | 226 | 7153 | 39.02 | 810 | 795 | 162.9 |
| A | 12 | 194 | 5796 | 30.7 | 810 | 795 | 162.9 |
| A | 3 | 137 | 5709 | 30.16 | 810 | 795 | 162.9 |
| B | 0 | 230 | 24259 | 153.09 | 812 | 791 | 153.3 |
| B | 12 | 111 | 18040 | 112.52 | 812 | 791 | 153.3 |
| B | 11 | 111 | 15320 | 94.78 | 812 | 791 | 153.3 |
| C | 4 | 254 | 1346138 | 7673.81 | 751 | 756 | 175.3 |
| C | 14 | 238 | 118950 | 674.16 | 751 | 756 | 175.3 |
| C | 5 | 218 | 37535 | 209.78 | 751 | 756 | 175.3 |
| D | 7 | 238 | 844687 | 4650.6 | 759 | 741 | 181.5 |
| D | 2 | 234 | 31025 | 166.88 | 759 | 741 | 181.5 |
| D | 10 | 70 | 30156 | 162.09 | 759 | 741 | 181.5 |
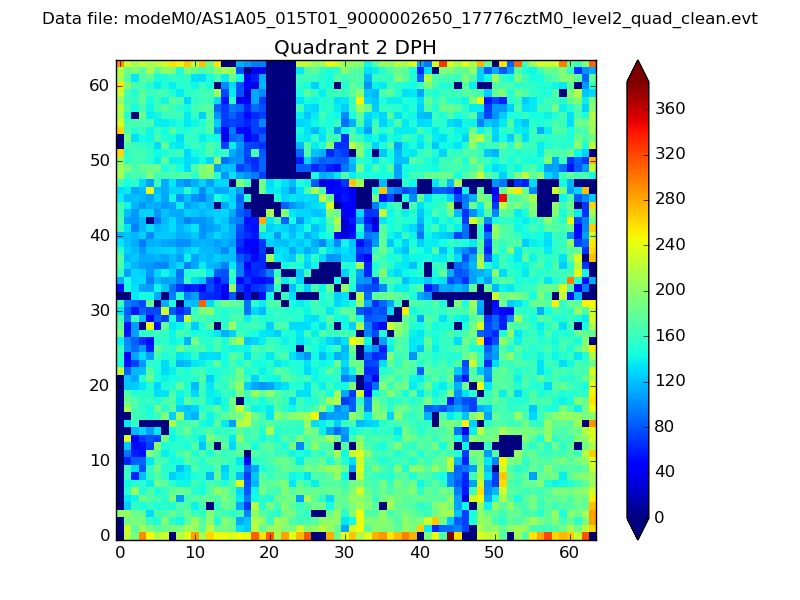
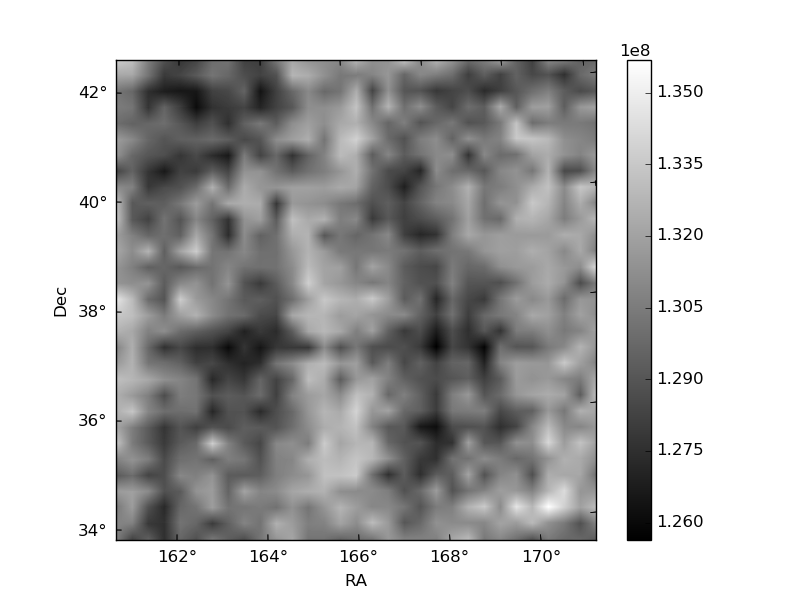
Histogram calculated using DETX and DETY for each event in the final _common_clean file
| Quadrant A | 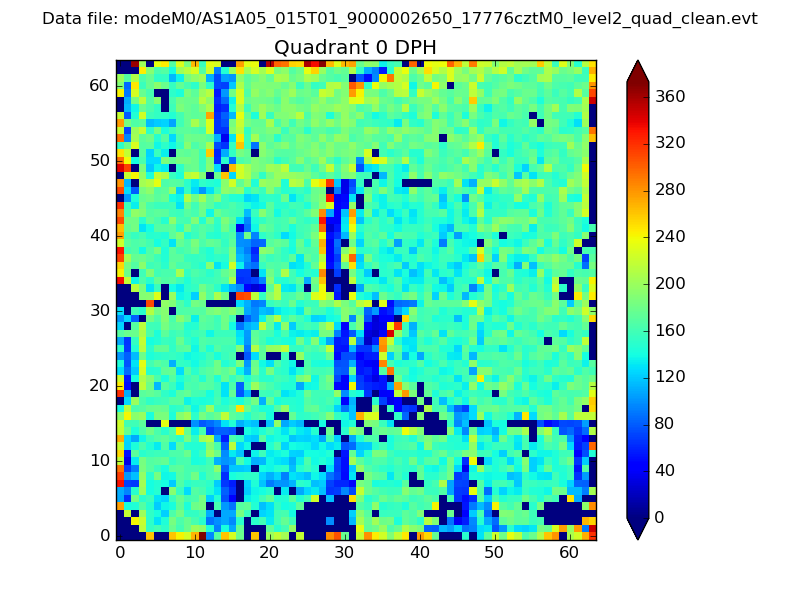 |
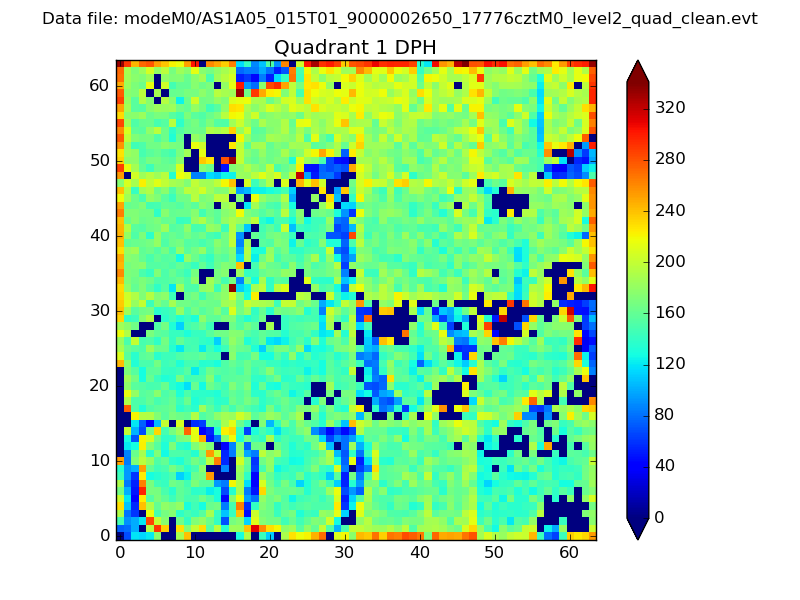 |
Quadrant B |
|---|---|---|---|
| Quadrant D | 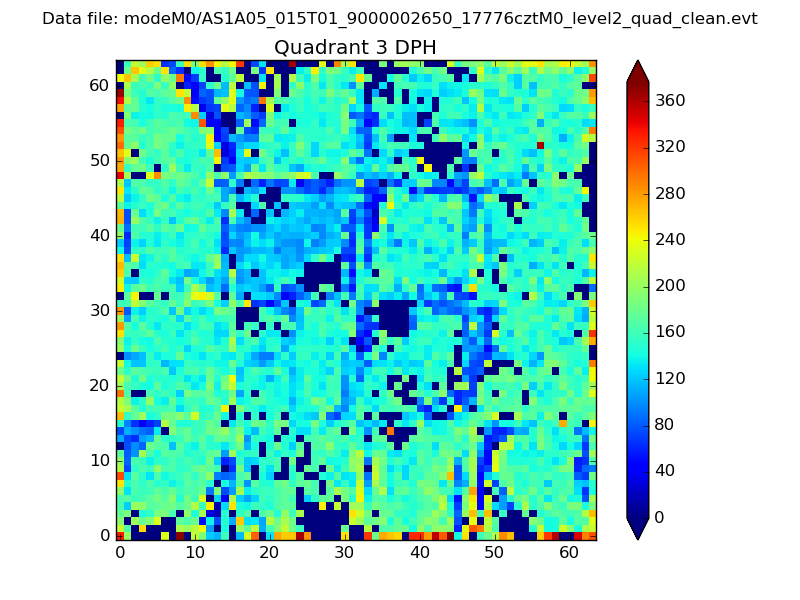 |
 |
Quadrant C |
| Plot type | Count rate plots | Images |
|---|---|---|
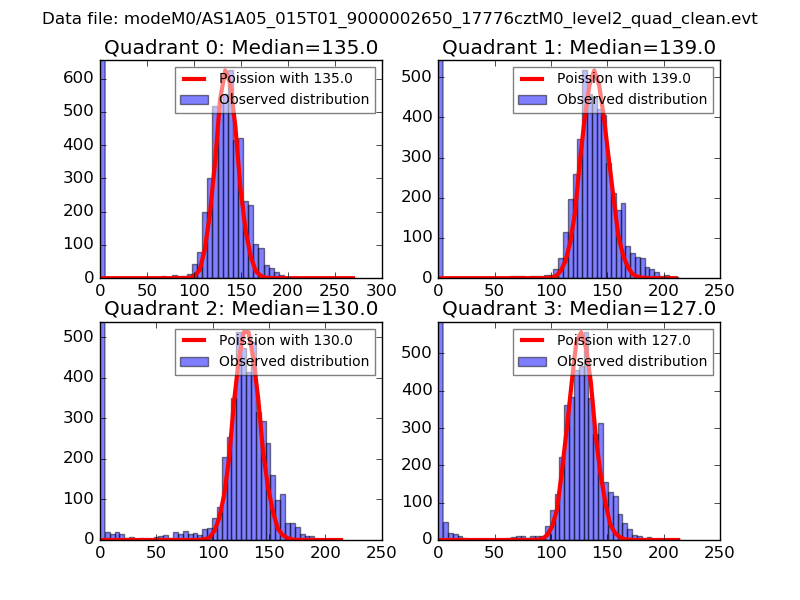
| Comparison with Poisson distribution Blue bars denote a histogram of data divided into 1 sec bins. Red curve is a Poisson curve with rate = median count rate of data. |
 |
 |
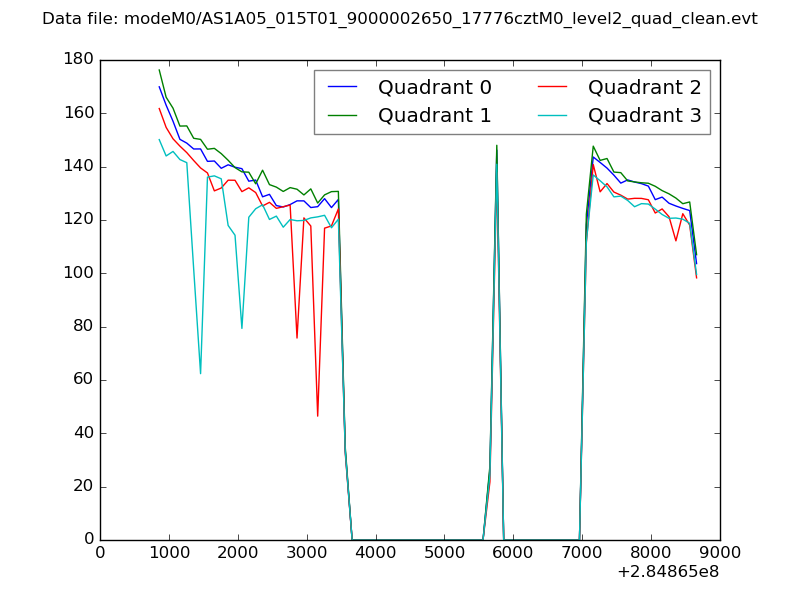
| Quadrant-wise count rates Data is divided into 100 sec bins |
 |
|
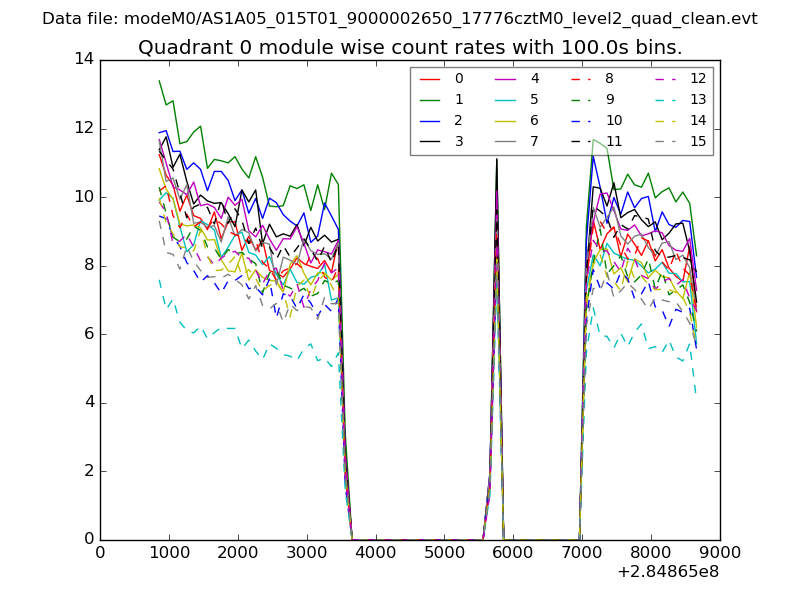
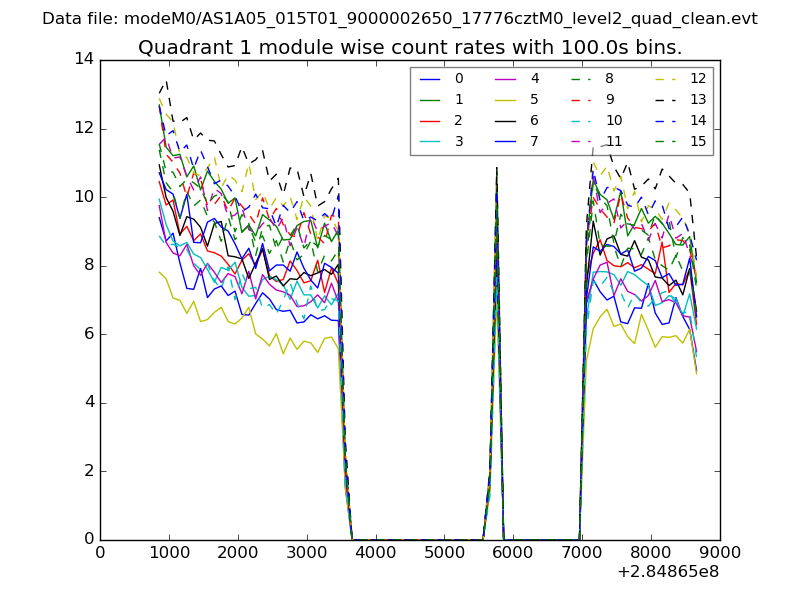
| Module-wise count rates for Quadrant A Data is divided into 100 sec bins |
 |
 |
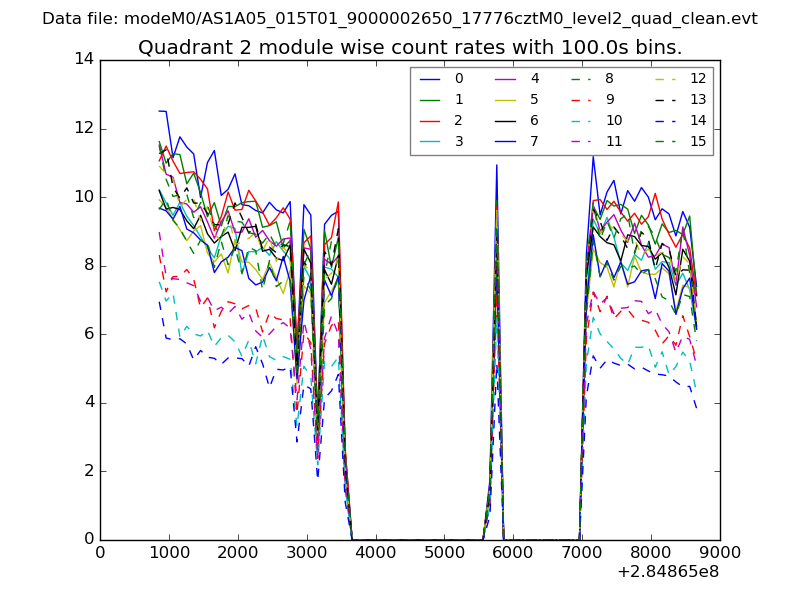
| Module-wise count rates for Quadrant B Data is divided into 100 sec bins |
 |
 |
| Module-wise count rates for Quadrant C Data is divided into 100 sec bins |
 |
 |
| Module-wise count rates for Quadrant D Data is divided into 100 sec bins |
 |
 |
| Parameter | Plot |
|---|---|
| CZT HV Monitor | 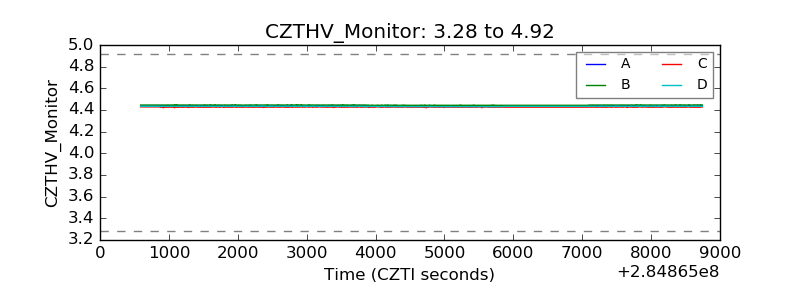 |
| D_VDD | 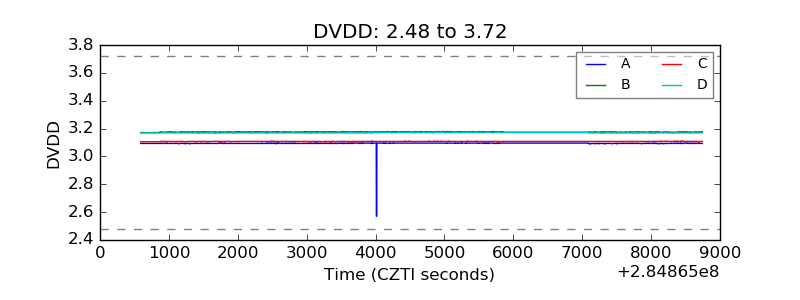 |
| Temperature 1 | 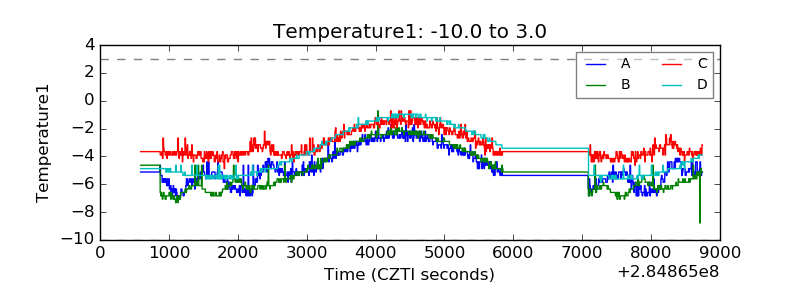 |
| Veto HV Monitor | 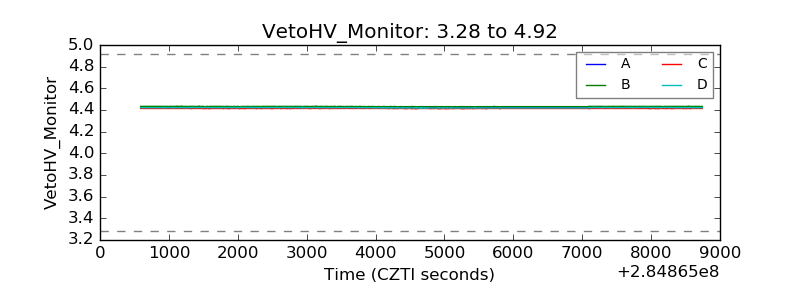 |
| Veto LLD |  |
| Alpha Counter | 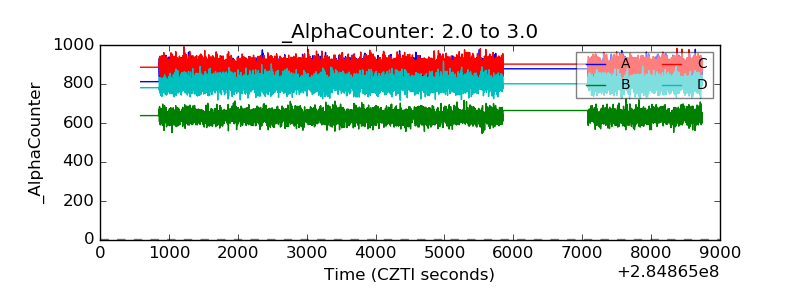 |
| _CPM_Rate | 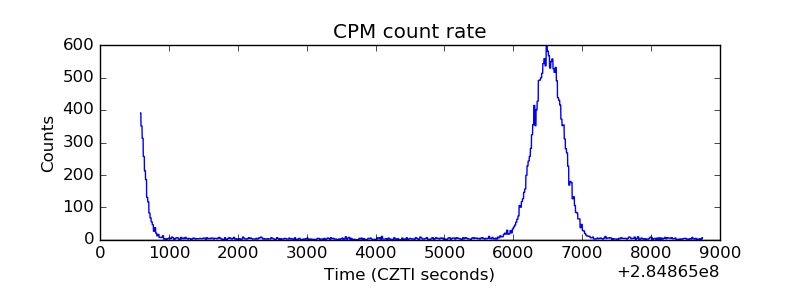 |
| CZT Counter | 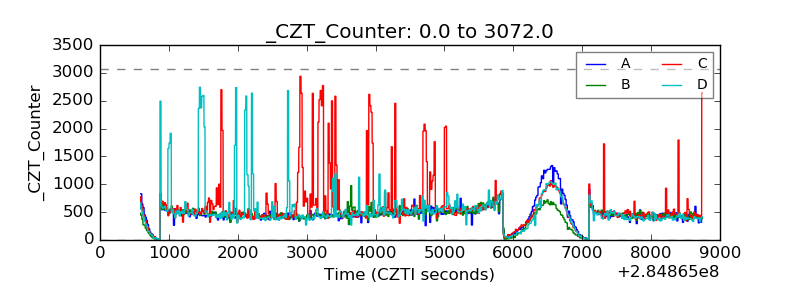 |
| +2.5 Volts monitor |  |
| +5 Volts monitor |  |
| _ROLL_ROT | 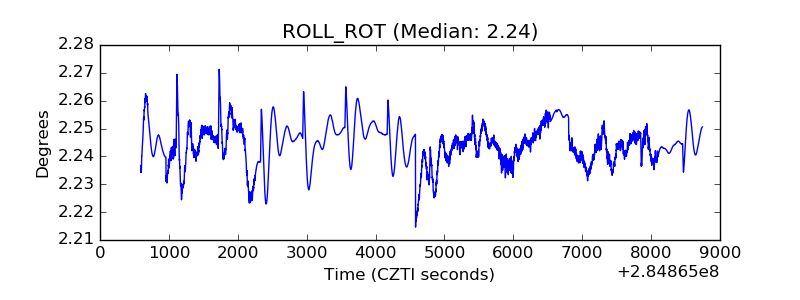 |
| _Roll_DEC | 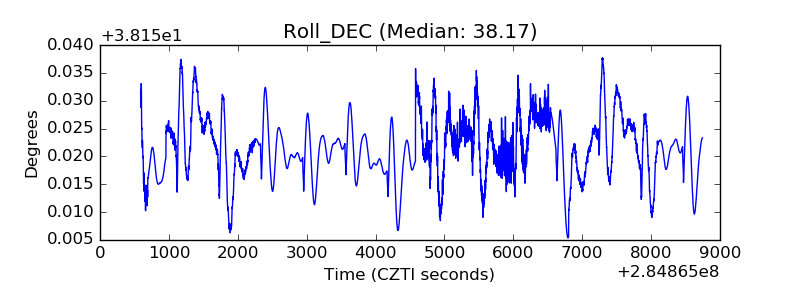 |
| _Roll_RA | 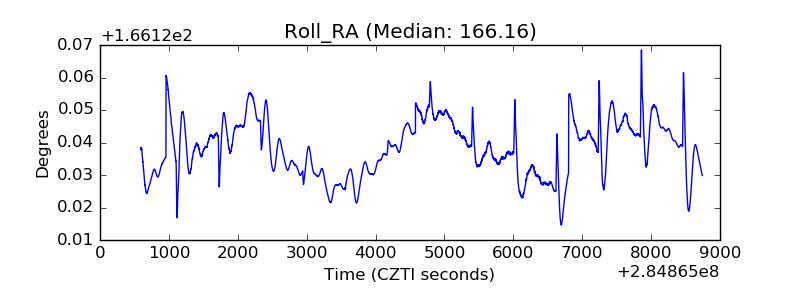 |
| Veto Counter |  |