| Param | Original file | Final file |
|---|---|---|
| Filename | modeM0/AS1A05_015T01_9000002650_17778cztM0_level2.evt | modeM0/AS1A05_015T01_9000002650_17778cztM0_level2_quad_clean.evt |
| Size (bytes) | 489,643,200 | 91,869,120 |
| Size | 467.0 MB | 87.6 MB |
| Events in quadrant A | 3,121,281 | 584,447 |
| Events in quadrant B | 3,246,835 | 597,688 |
| Events in quadrant C | 4,152,690 | 560,966 |
| Events in quadrant D | 3,841,706 | 560,766 |
| Mode SS | |||
|---|---|---|---|
| Quadrant | BADHDUFLAG | Total packets | Discarded packets |
| A | 0 | 140 | 0 |
| B | 0 | 140 | 0 |
| C | 0 | 140 | 0 |
| D | 0 | 140 | 0 |
| Mode M9 | |||
|---|---|---|---|
| Quadrant | BADHDUFLAG | Total packets | Discarded packets |
| A | 0 | 4 | 0 |
| B | 0 | 4 | 0 |
| C | 0 | 4 | 0 |
| D | 0 | 4 | 0 |
| Mode M0 | |||
|---|---|---|---|
| Quadrant | BADHDUFLAG | Total packets | Discarded packets |
| A | 0 | 13981 | 1 |
| B | 0 | 14218 | 1 |
| C | 0 | 16904 | 1 |
| D | 0 | 16327 | 1 |
| Quadrant | Total seconds | Saturated seconds | Saturation percentage |
|---|---|---|---|
| A | 6865 | 119 | 1.733430% |
| B | 6865 | 113 | 1.646031% |
| C | 6866 | 359 | 5.228663% |
| D | 6866 | 172 | 2.505098% |
Noise dominated data is calculated using 1-second bins in cleaned event files. If a bin has >2000 counts, and if more than 50% of those come from <1% of pixels, then it is considered to be noise-dominated and hence unusable.
| Quadrant | # 1 sec bins | Bins with >0 counts | Bins with >2000 counts | High rate bins dominated by noise | Noise dominated (total time) | Noise dominated (detector-on time) | Marked lightcurve |
|---|---|---|---|---|---|---|---|
| A | 7230 | 6867 | 0 | 0 | 0.00% | 0.00% | 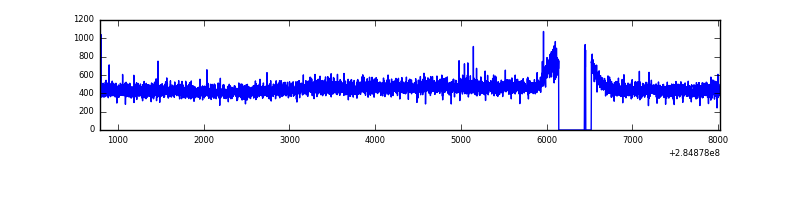 |
| B | 7230 | 6867 | 8 | 8 | 0.11% | 0.12% | 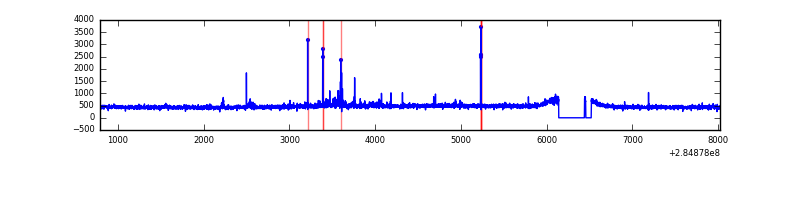 |
| C | 7231 | 6868 | 144 | 144 | 1.99% | 2.10% | 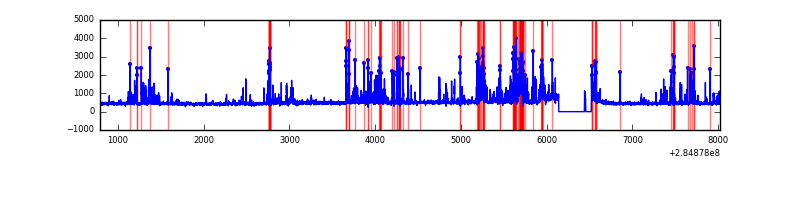 |
| D | 7231 | 6868 | 76 | 76 | 1.05% | 1.11% | 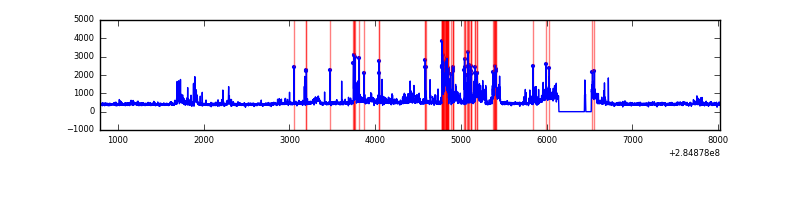 |
Top three noisy pixels from each quadrant. If the there are fewer than three noisy pixels in the level2.evt file, extra rows are filled as -1
| Pixel properties | Quadrant properties | ||||||
|---|---|---|---|---|---|---|---|
| Quadrant | DetID | PixID | Counts | Sigma | Mean | Median | Sigma |
| A | 0 | 226 | 7124 | 38.49 | 810 | 793 | 164.5 |
| A | 12 | 194 | 6196 | 32.85 | 810 | 793 | 164.5 |
| A | 3 | 137 | 6123 | 32.41 | 810 | 793 | 164.5 |
| B | 7 | 220 | 48504 | 305.27 | 806 | 785 | 156.3 |
| B | 12 | 111 | 18599 | 113.96 | 806 | 785 | 156.3 |
| B | 11 | 111 | 16127 | 98.15 | 806 | 785 | 156.3 |
| C | 4 | 254 | 993283 | 5556.65 | 760 | 764 | 178.6 |
| C | 14 | 238 | 117574 | 653.96 | 760 | 764 | 178.6 |
| C | 5 | 218 | 48185 | 265.49 | 760 | 764 | 178.6 |
| D | 7 | 238 | 768206 | 4105.08 | 778 | 759 | 187.0 |
| D | 10 | 70 | 60075 | 317.28 | 778 | 759 | 187.0 |
| D | 2 | 234 | 34277 | 179.29 | 778 | 759 | 187.0 |
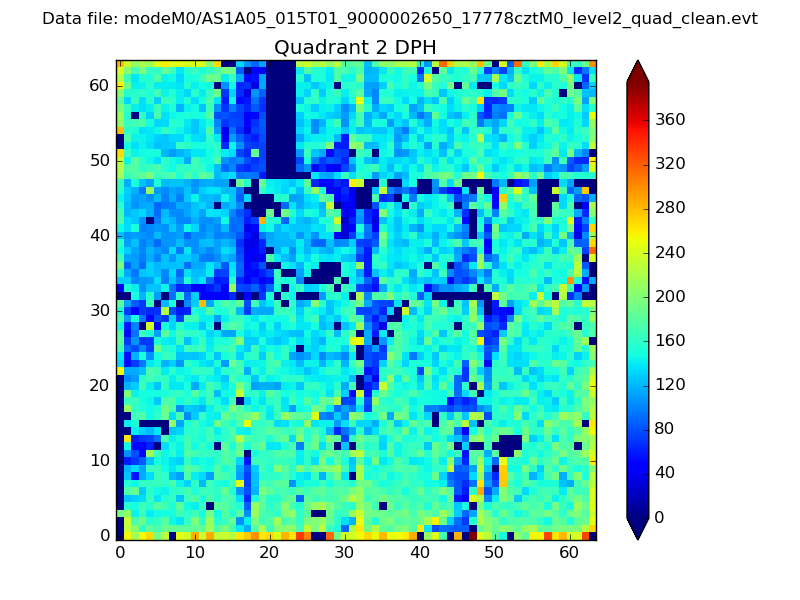
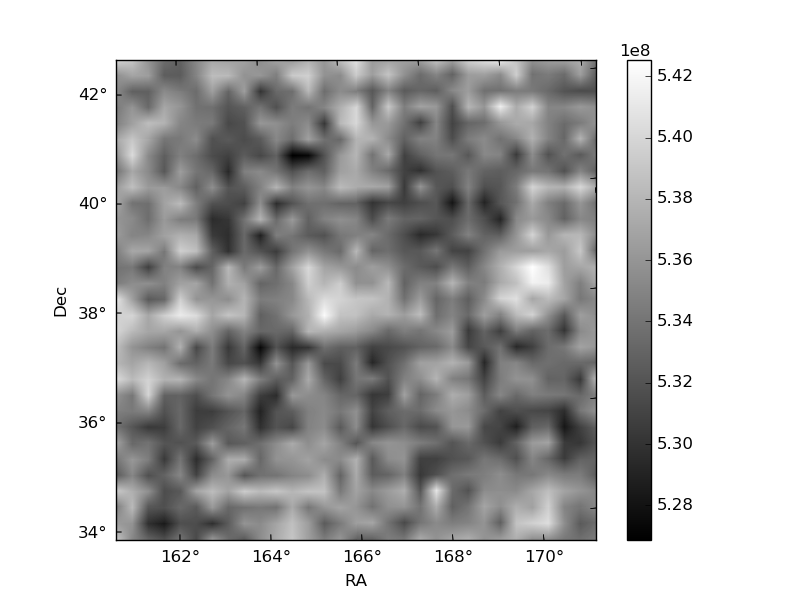
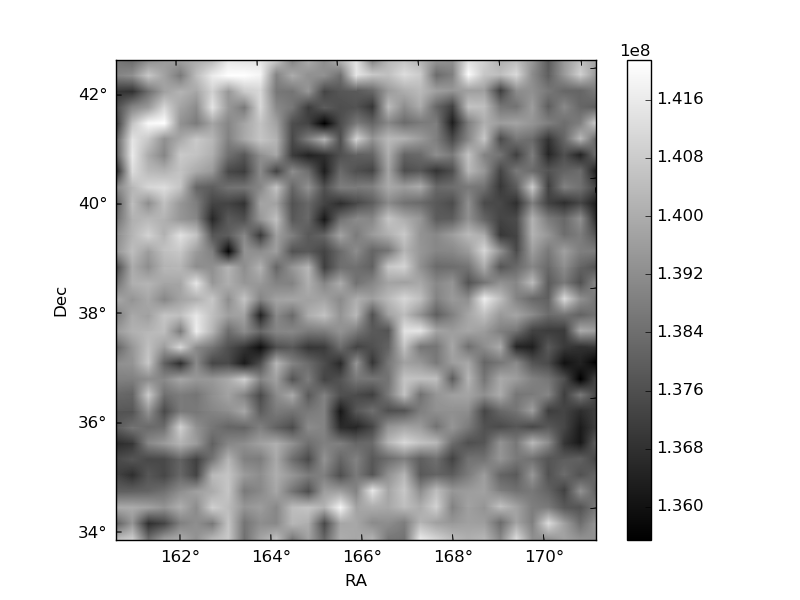
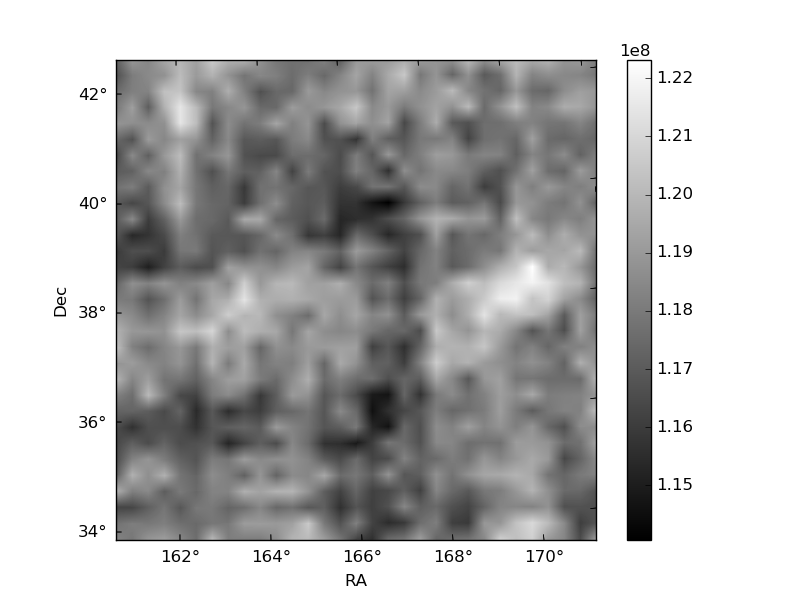
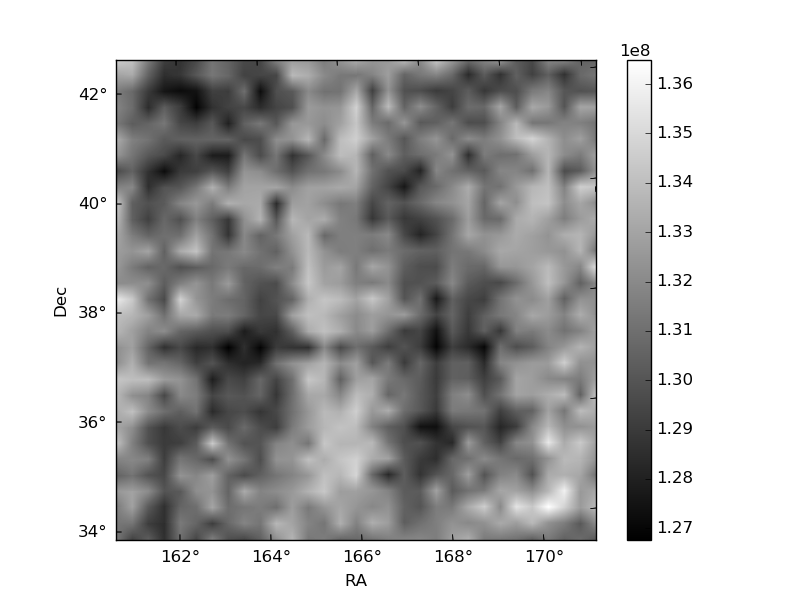
Histogram calculated using DETX and DETY for each event in the final _common_clean file
| Quadrant A | 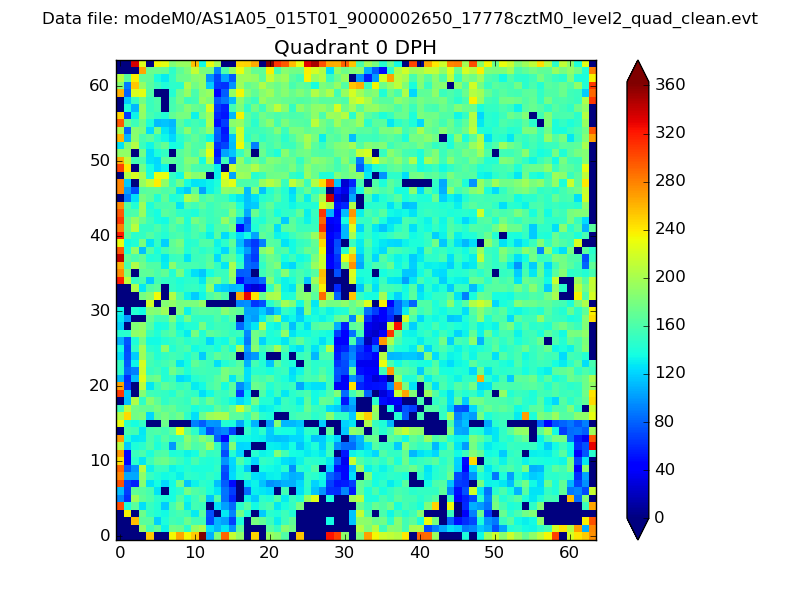 |
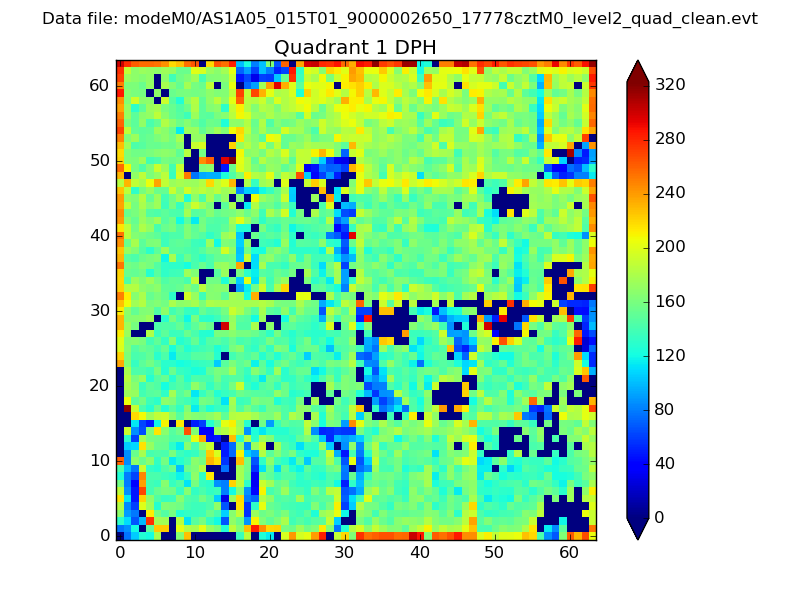 |
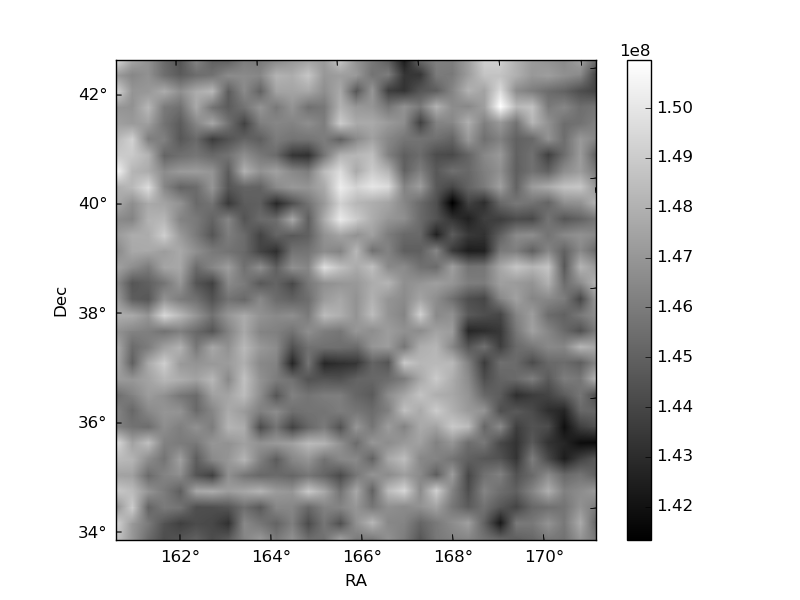
Quadrant B |
|---|---|---|---|
| Quadrant D | 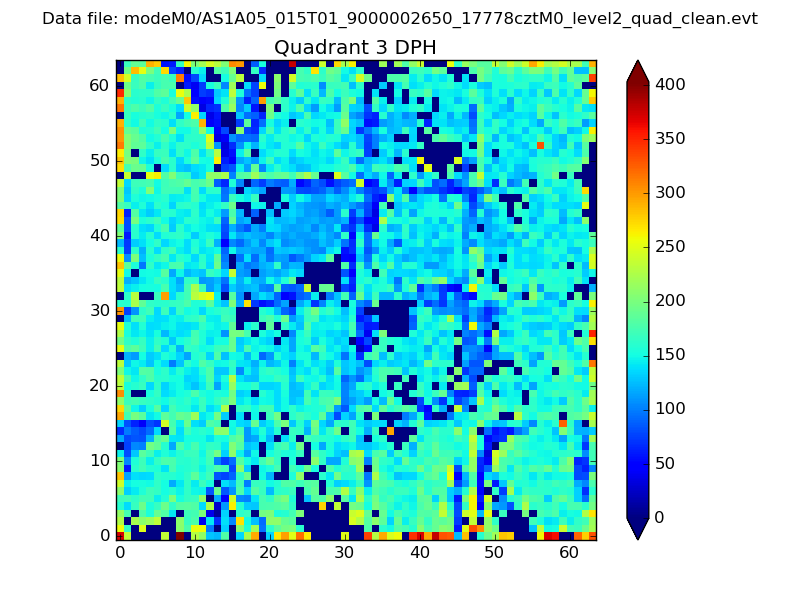 |
 |
Quadrant C |
| Plot type | Count rate plots | Images |
|---|---|---|
| Comparison with Poisson distribution Blue bars denote a histogram of data divided into 1 sec bins. Red curve is a Poisson curve with rate = median count rate of data. |
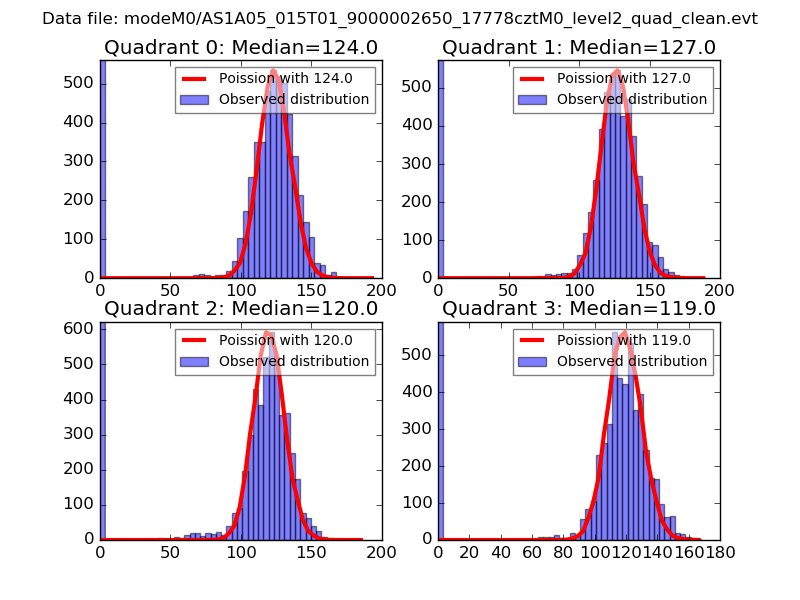 |
 |
| Quadrant-wise count rates Data is divided into 100 sec bins |
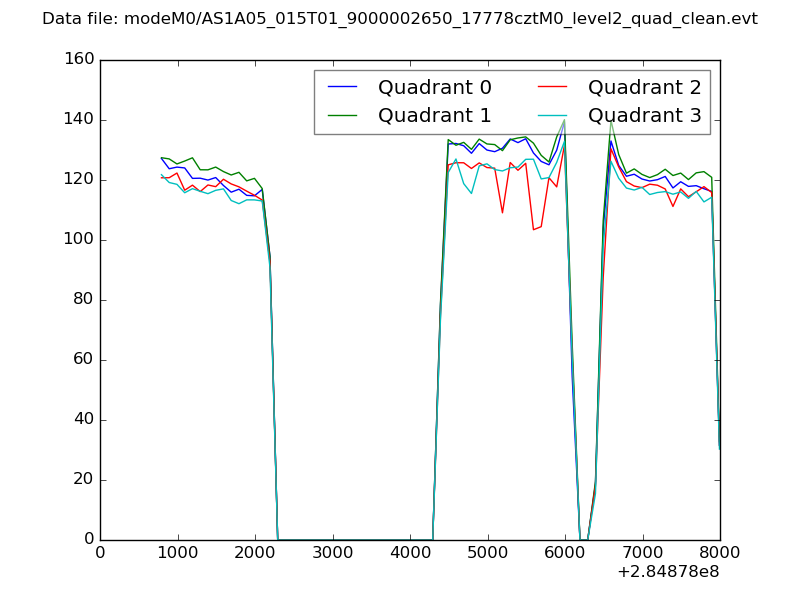 |
|
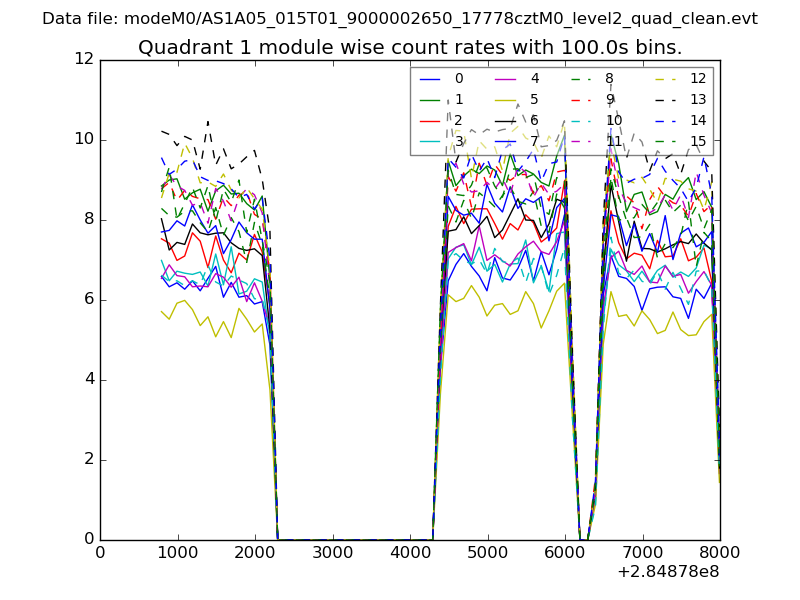
| Module-wise count rates for Quadrant A Data is divided into 100 sec bins |
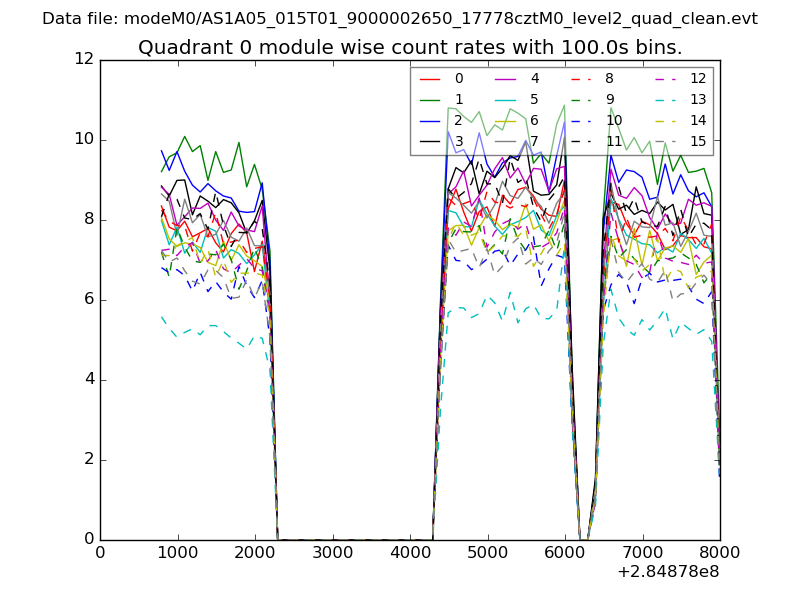 |
 |
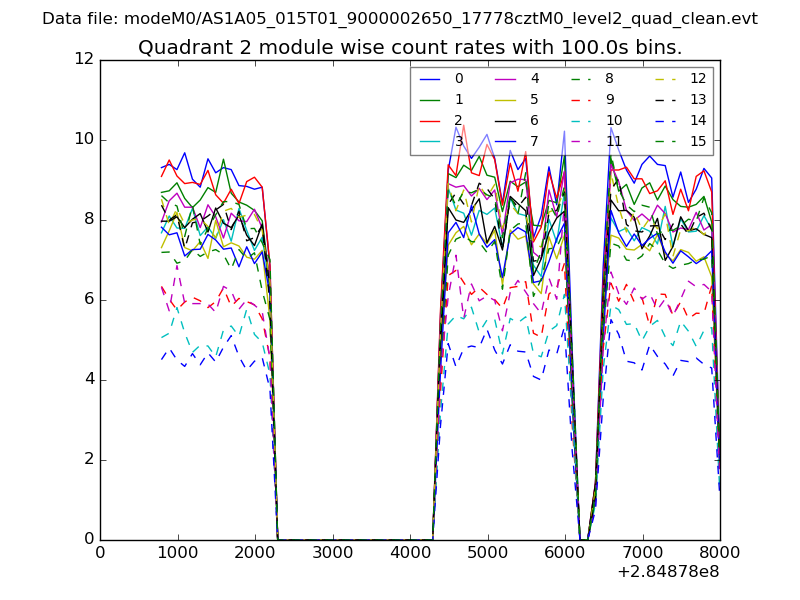
| Module-wise count rates for Quadrant B Data is divided into 100 sec bins |
 |
 |
| Module-wise count rates for Quadrant C Data is divided into 100 sec bins |
 |
 |
| Module-wise count rates for Quadrant D Data is divided into 100 sec bins |
 |
 |
| Parameter | Plot |
|---|---|
| CZT HV Monitor | 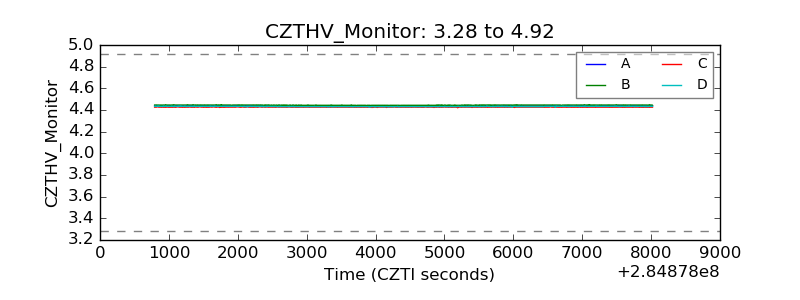 |
| D_VDD | 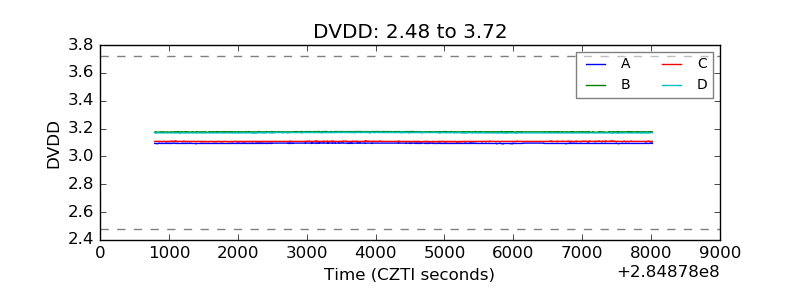 |
| Temperature 1 | 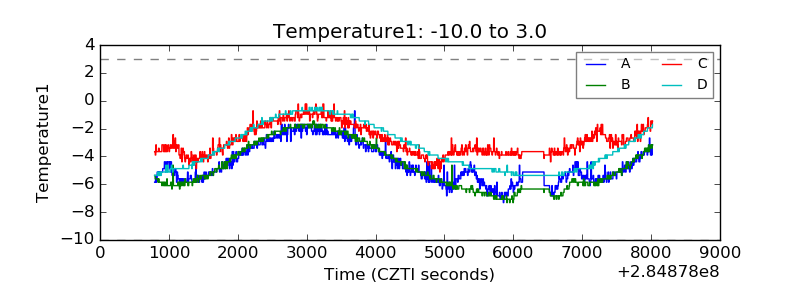 |
| Veto HV Monitor | 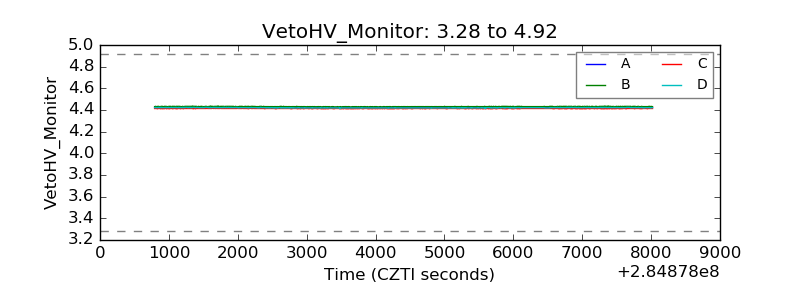 |
| Veto LLD |  |
| Alpha Counter | 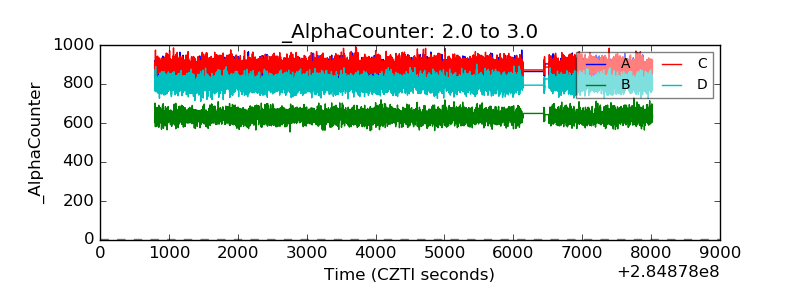 |
| _CPM_Rate | 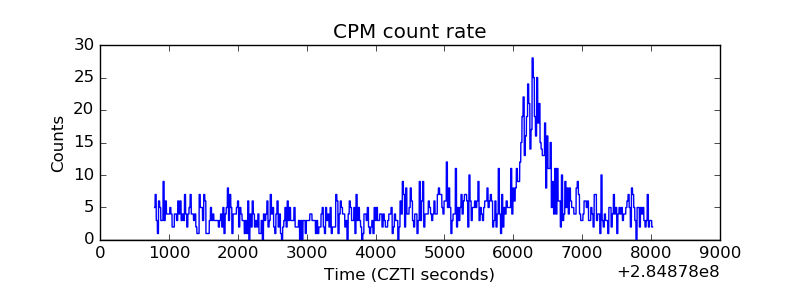 |
| CZT Counter | 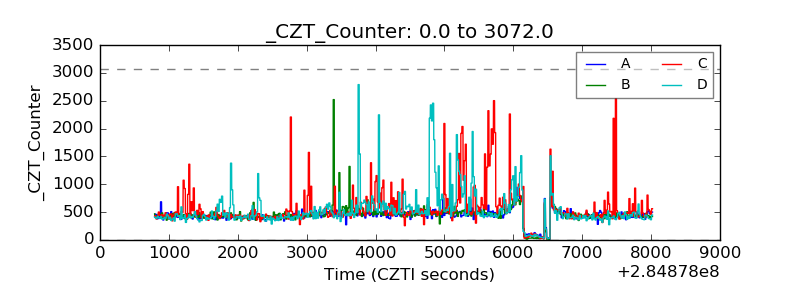 |
| +2.5 Volts monitor |  |
| +5 Volts monitor |  |
| _ROLL_ROT | 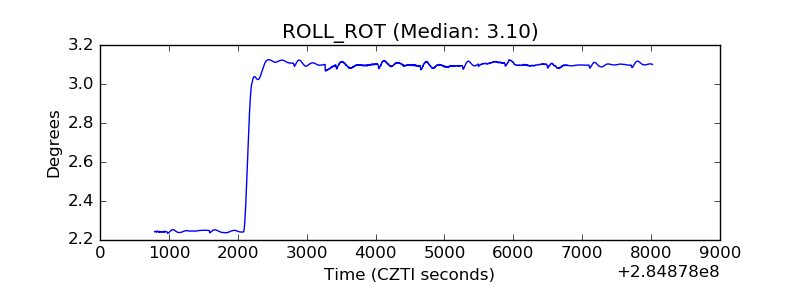 |
| _Roll_DEC | 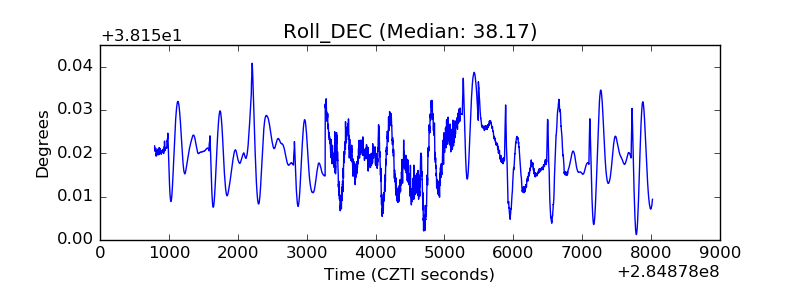 |
| _Roll_RA | 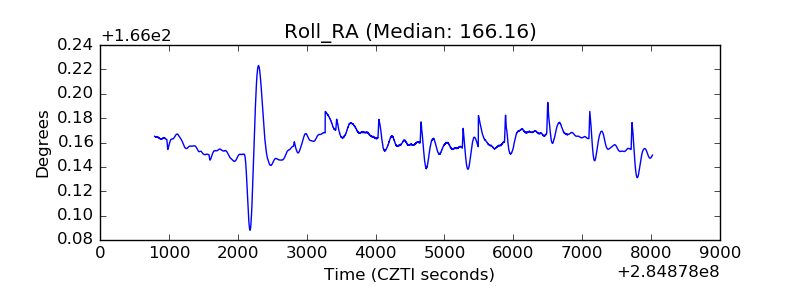 |
| Veto Counter |  |