| Param | Original file | Final file |
|---|---|---|
| Filename | modeM0/AS1A05_015T01_9000002650_17779cztM0_level2.evt | modeM0/AS1A05_015T01_9000002650_17779cztM0_level2_quad_clean.evt |
| Size (bytes) | 507,824,640 | 91,846,080 |
| Size | 484.3 MB | 87.6 MB |
| Events in quadrant A | 3,318,713 | 574,922 |
| Events in quadrant B | 3,521,840 | 588,419 |
| Events in quadrant C | 3,919,012 | 557,160 |
| Events in quadrant D | 4,128,472 | 557,071 |
| Mode SS | |||
|---|---|---|---|
| Quadrant | BADHDUFLAG | Total packets | Discarded packets |
| A | 0 | 146 | 0 |
| B | 0 | 146 | 0 |
| C | 0 | 146 | 0 |
| D | 0 | 145 | 0 |
| Mode M0 | |||
|---|---|---|---|
| Quadrant | BADHDUFLAG | Total packets | Discarded packets |
| A | 0 | 14853 | 1 |
| B | 0 | 15261 | 1 |
| C | 0 | 16332 | 1 |
| D | 0 | 17439 | 1 |
| Quadrant | Total seconds | Saturated seconds | Saturation percentage |
|---|---|---|---|
| A | 7226 | 216 | 2.989206% |
| B | 7227 | 224 | 3.099488% |
| C | 7227 | 345 | 4.773765% |
| D | 7227 | 376 | 5.202712% |
Noise dominated data is calculated using 1-second bins in cleaned event files. If a bin has >2000 counts, and if more than 50% of those come from <1% of pixels, then it is considered to be noise-dominated and hence unusable.
| Quadrant | # 1 sec bins | Bins with >0 counts | Bins with >2000 counts | High rate bins dominated by noise | Noise dominated (total time) | Noise dominated (detector-on time) | Marked lightcurve |
|---|---|---|---|---|---|---|---|
| A | 7241 | 7227 | 0 | 0 | 0.00% | 0.00% | 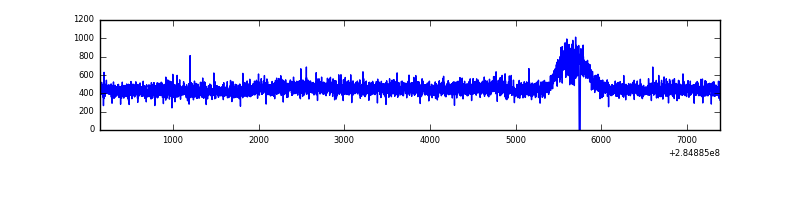 |
| B | 7242 | 7228 | 8 | 8 | 0.11% | 0.11% | 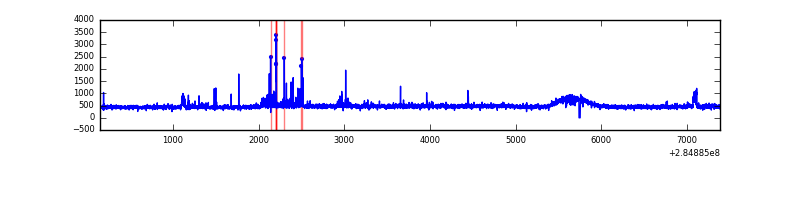 |
| C | 7242 | 7228 | 75 | 75 | 1.04% | 1.04% | 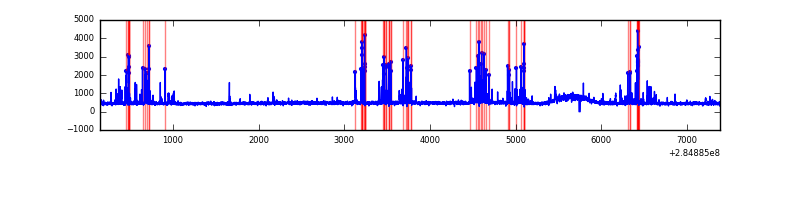 |
| D | 7242 | 7228 | 183 | 183 | 2.53% | 2.53% | 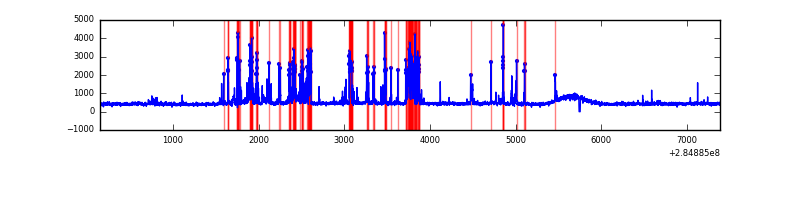 |
Top three noisy pixels from each quadrant. If the there are fewer than three noisy pixels in the level2.evt file, extra rows are filled as -1
| Pixel properties | Quadrant properties | ||||||
|---|---|---|---|---|---|---|---|
| Quadrant | DetID | PixID | Counts | Sigma | Mean | Median | Sigma |
| A | 0 | 226 | 7561 | 38.37 | 861 | 842 | 175.1 |
| A | 3 | 137 | 6485 | 32.22 | 861 | 842 | 175.1 |
| A | 12 | 194 | 6425 | 31.88 | 861 | 842 | 175.1 |
| B | 7 | 220 | 88534 | 532.09 | 859 | 838 | 164.8 |
| B | 0 | 230 | 35673 | 211.36 | 859 | 838 | 164.8 |
| B | 12 | 111 | 20137 | 117.09 | 859 | 838 | 164.8 |
| C | 4 | 254 | 509540 | 2633.44 | 819 | 821 | 193.2 |
| C | 14 | 238 | 126105 | 648.55 | 819 | 821 | 193.2 |
| C | 5 | 218 | 61224 | 312.68 | 819 | 821 | 193.2 |
| D | 7 | 238 | 781984 | 3945.69 | 824 | 803 | 198.0 |
| D | 10 | 70 | 77898 | 389.4 | 824 | 803 | 198.0 |
| D | 7 | 38 | 69354 | 346.25 | 824 | 803 | 198.0 |
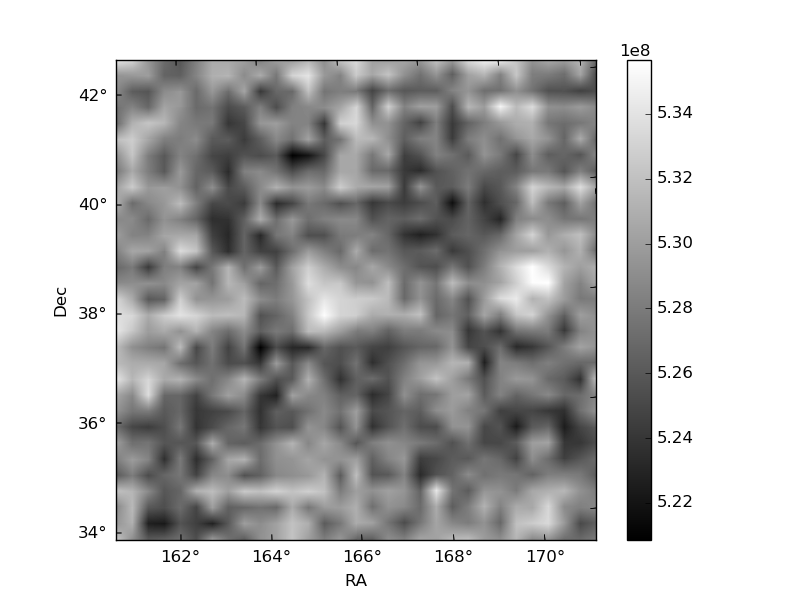
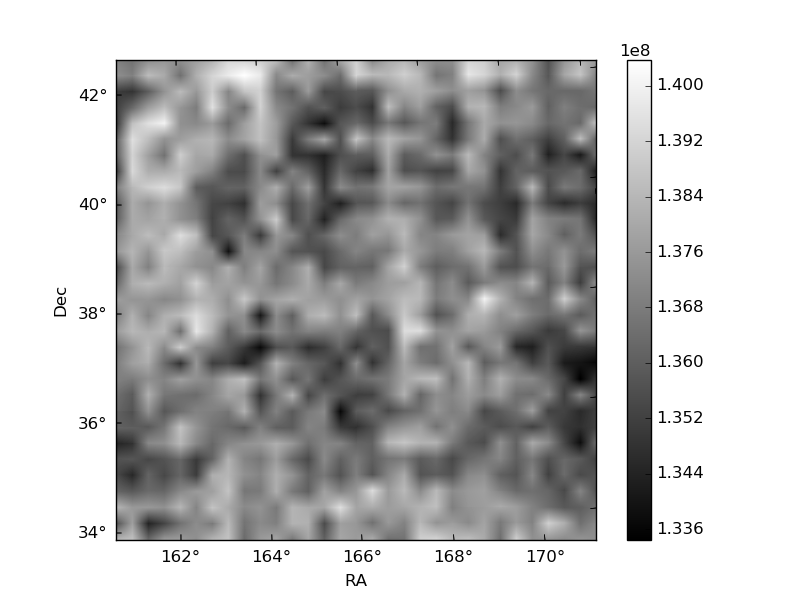
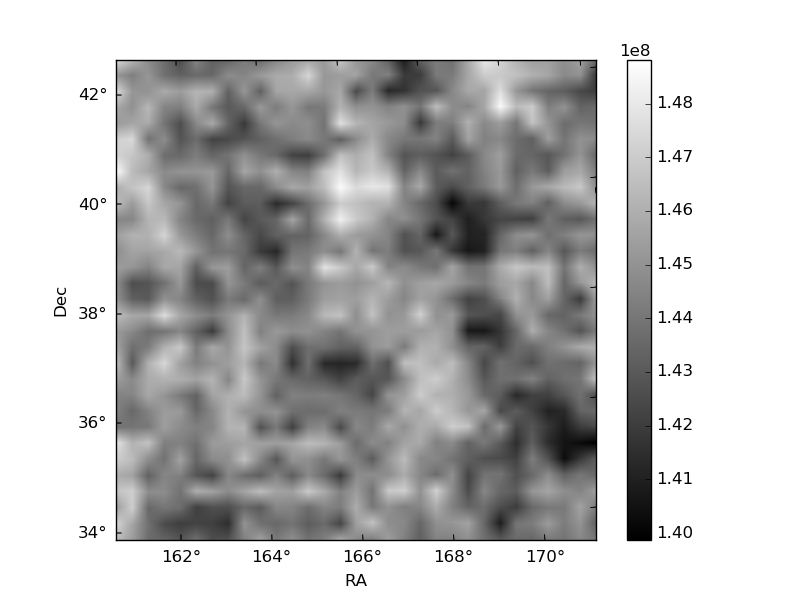
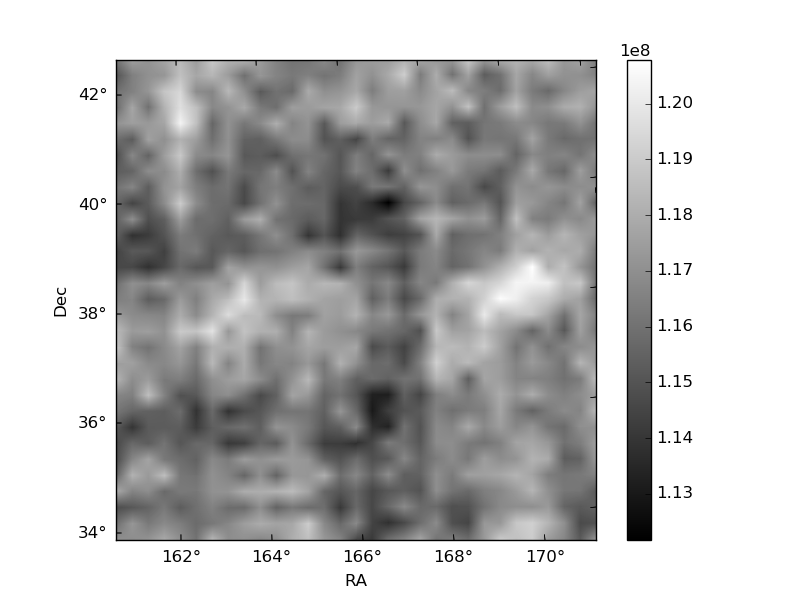
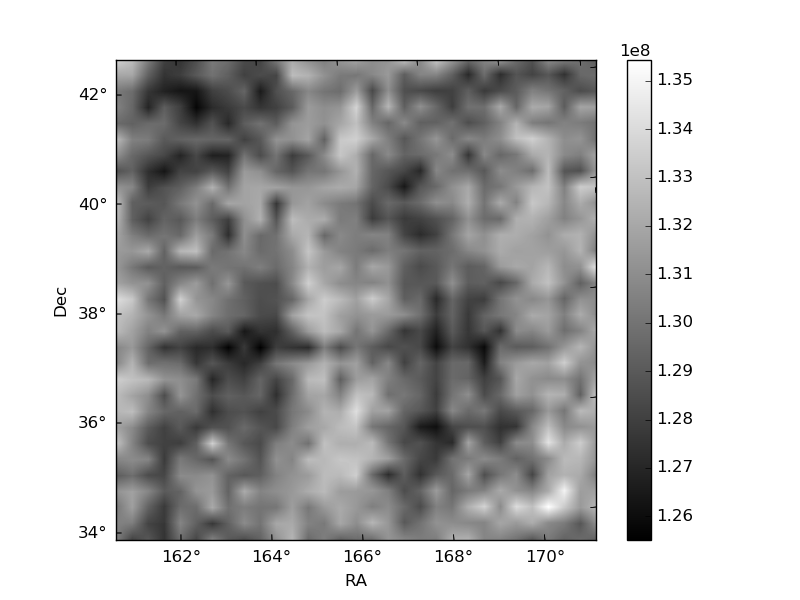
Histogram calculated using DETX and DETY for each event in the final _common_clean file
| Quadrant A | 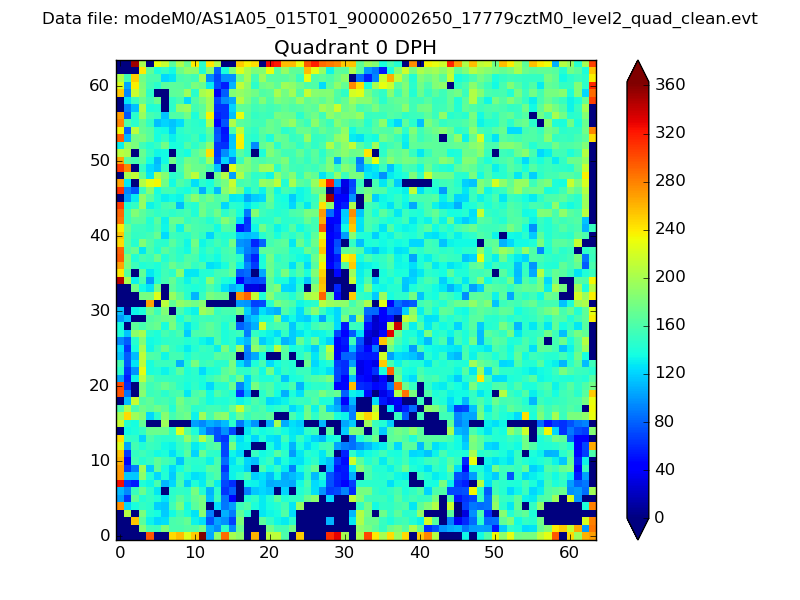 |
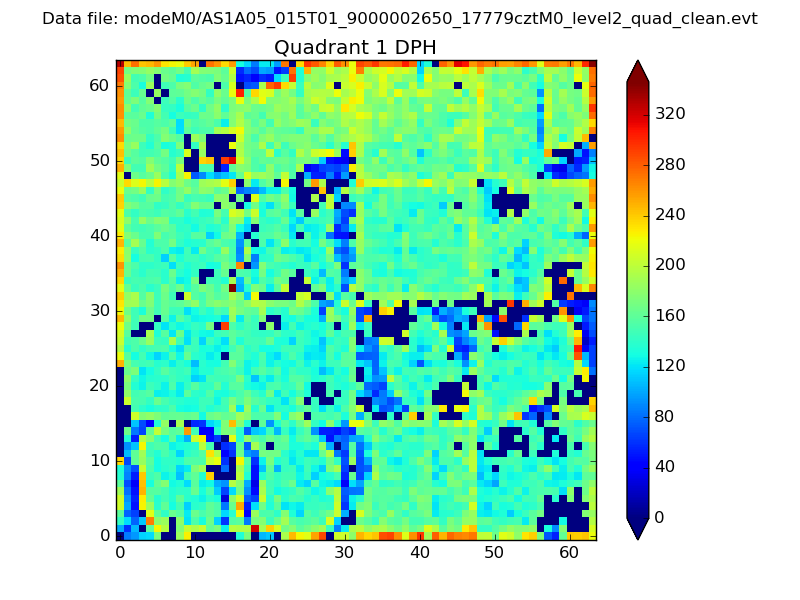 |
Quadrant B |
|---|---|---|---|
| Quadrant D | 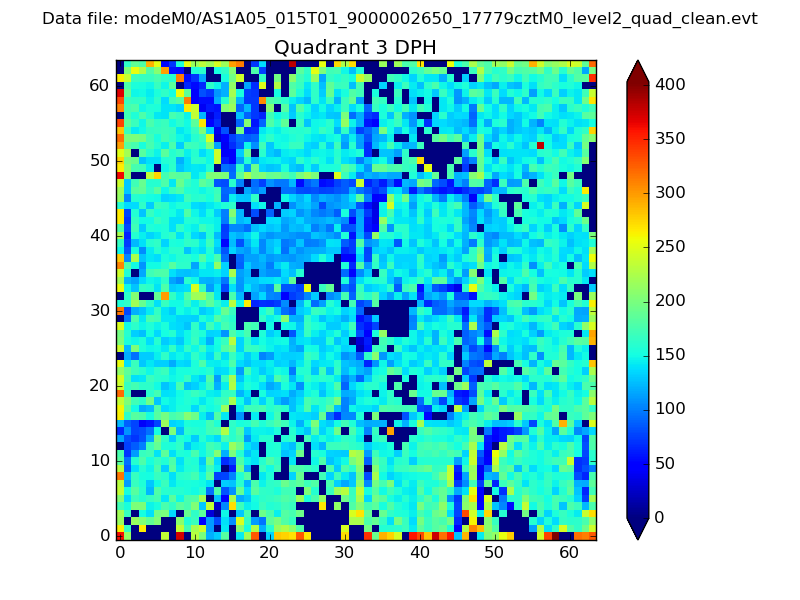 |
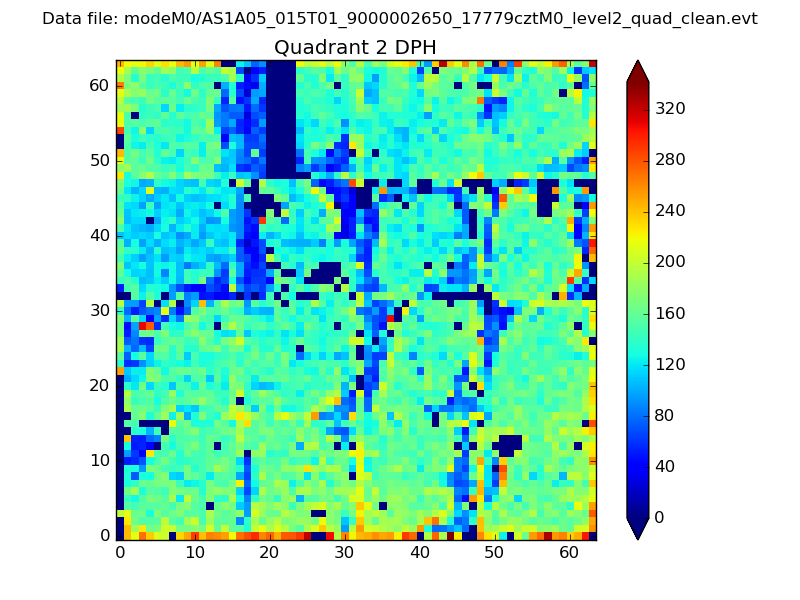 |
Quadrant C |
| Plot type | Count rate plots | Images |
|---|---|---|
| Comparison with Poisson distribution Blue bars denote a histogram of data divided into 1 sec bins. Red curve is a Poisson curve with rate = median count rate of data. |
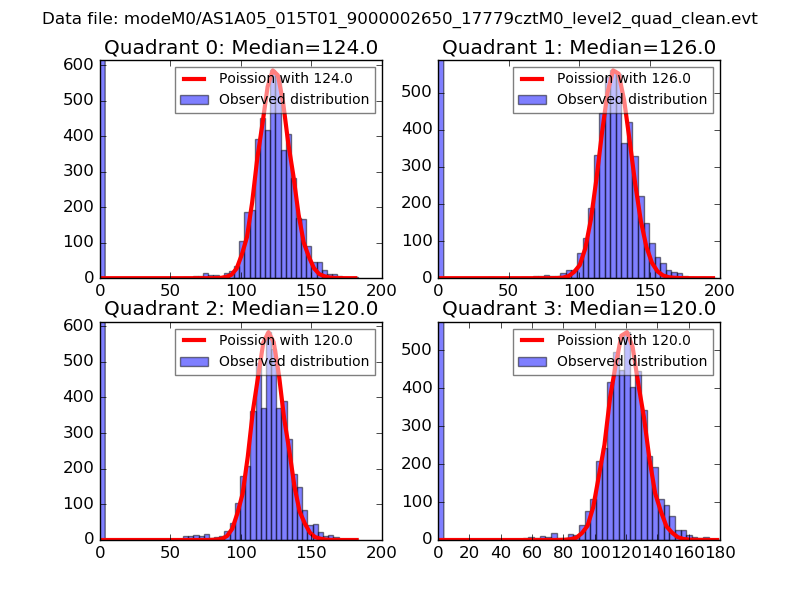 |
 |
| Quadrant-wise count rates Data is divided into 100 sec bins |
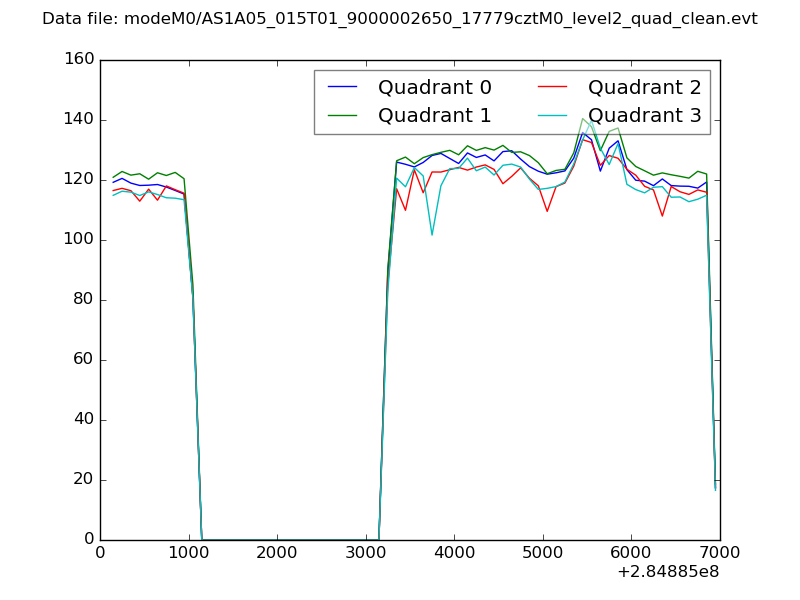 |
|
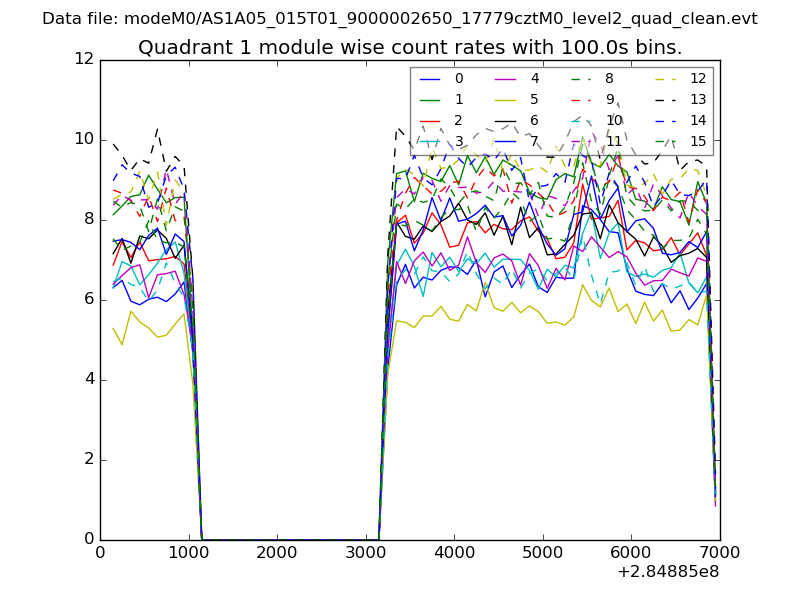
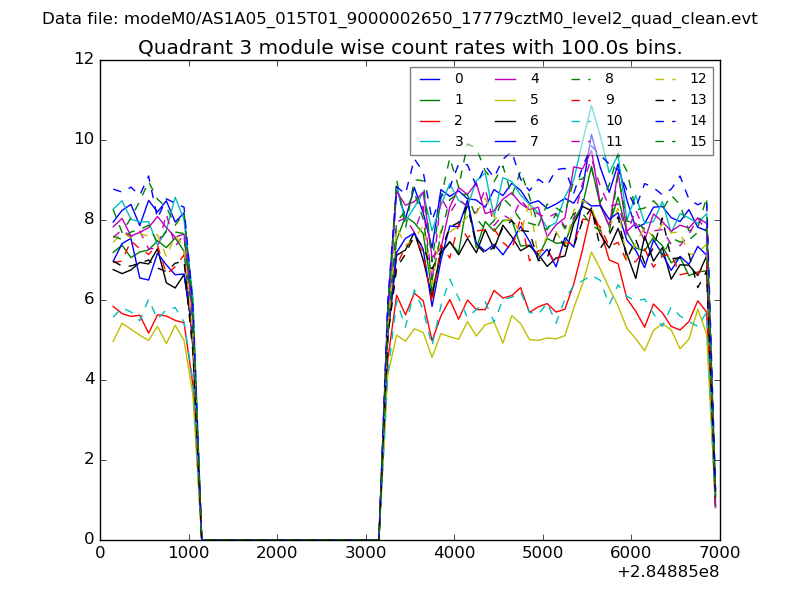
| Module-wise count rates for Quadrant A Data is divided into 100 sec bins |
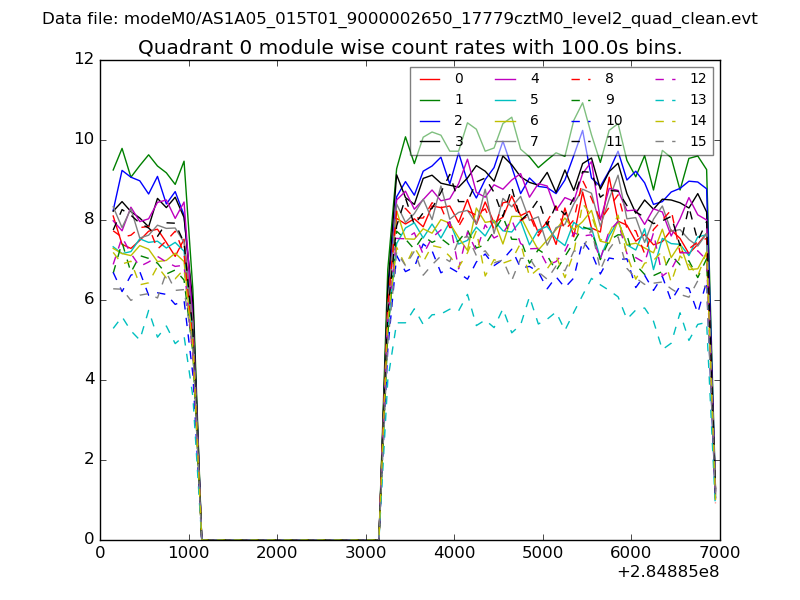 |
 |
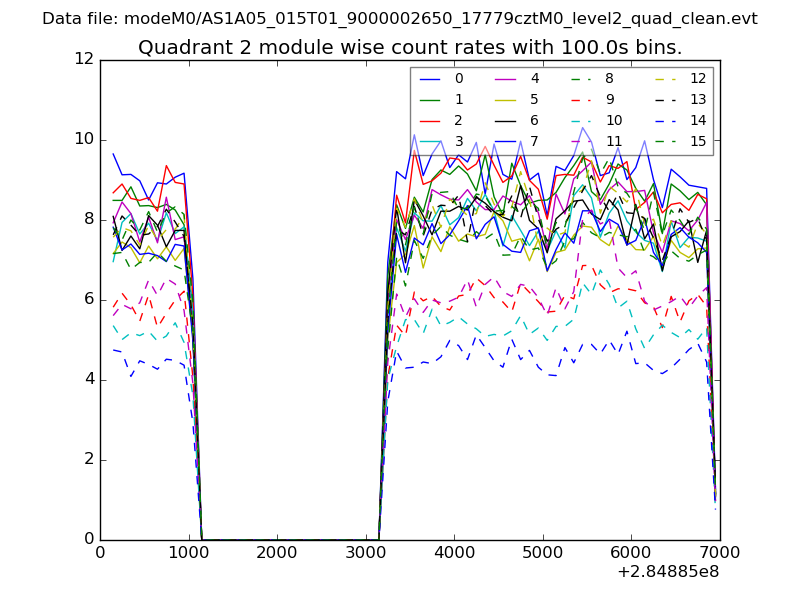
| Module-wise count rates for Quadrant B Data is divided into 100 sec bins |
 |
 |
| Module-wise count rates for Quadrant C Data is divided into 100 sec bins |
 |
 |
| Module-wise count rates for Quadrant D Data is divided into 100 sec bins |
 |
 |
| Parameter | Plot |
|---|---|
| CZT HV Monitor | 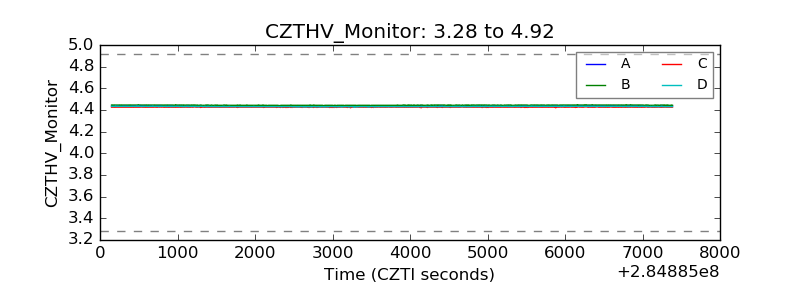 |
| D_VDD | 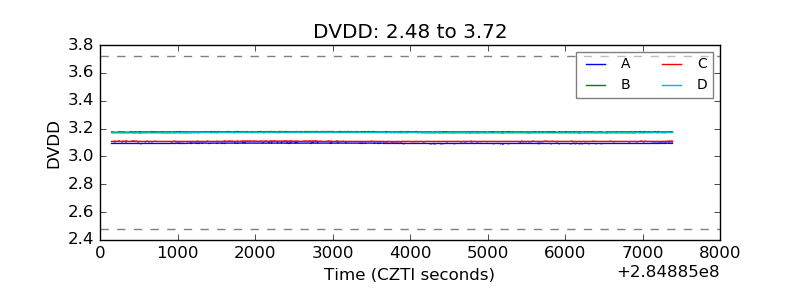 |
| Temperature 1 | 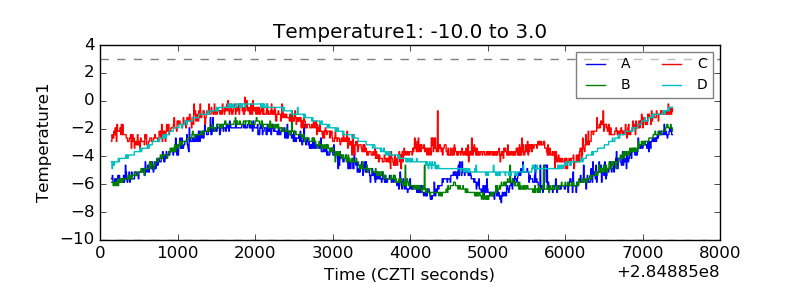 |
| Veto HV Monitor | 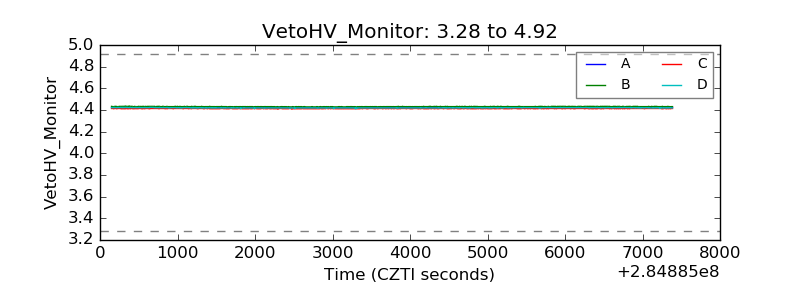 |
| Veto LLD | 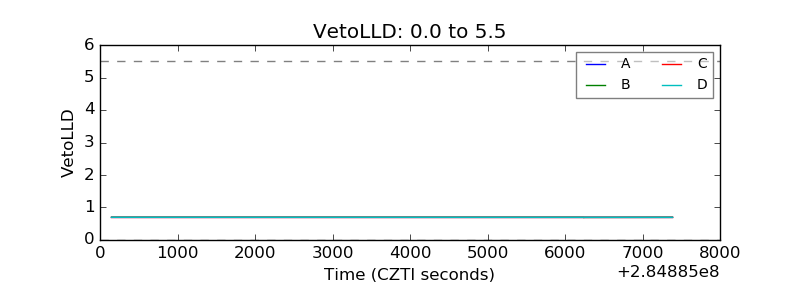 |
| Alpha Counter | 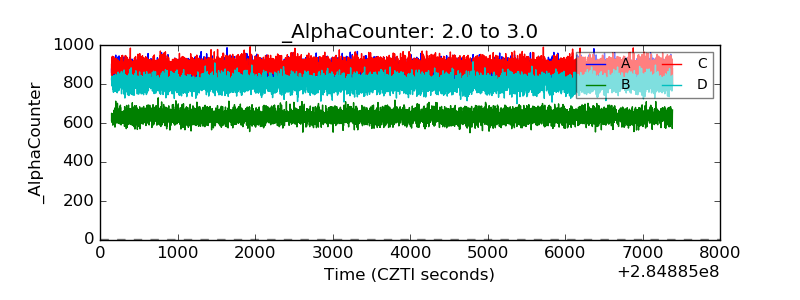 |
| _CPM_Rate | 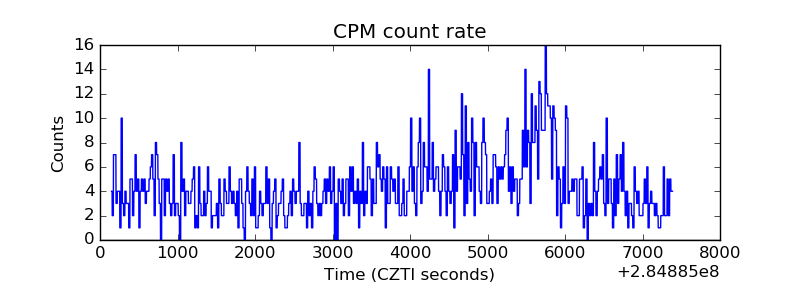 |
| CZT Counter | 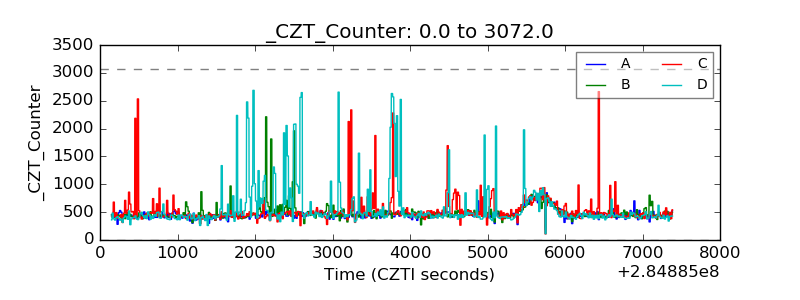 |
| +2.5 Volts monitor |  |
| +5 Volts monitor |  |
| _ROLL_ROT | 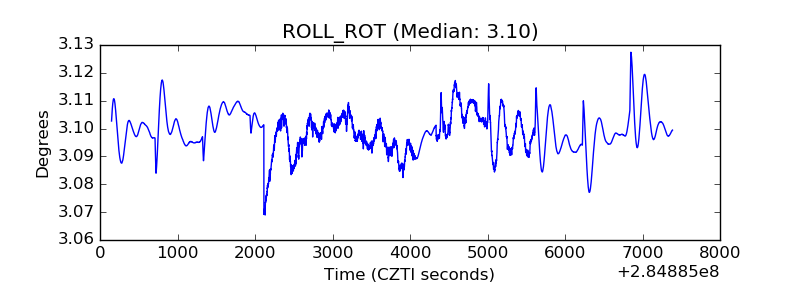 |
| _Roll_DEC | 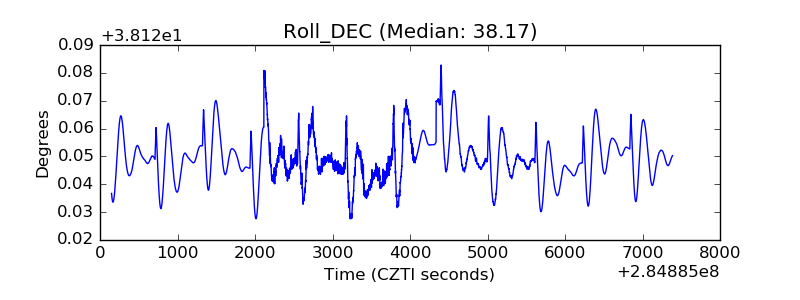 |
| _Roll_RA | 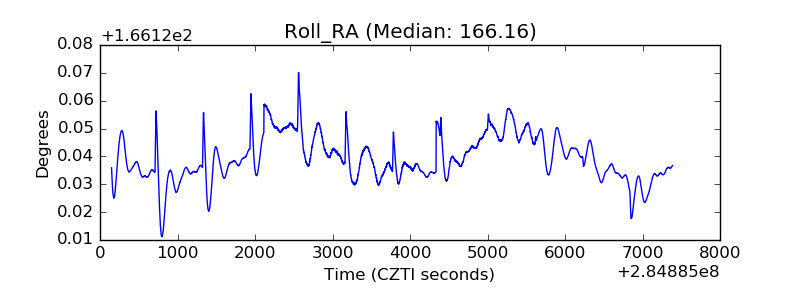 |
| Veto Counter | 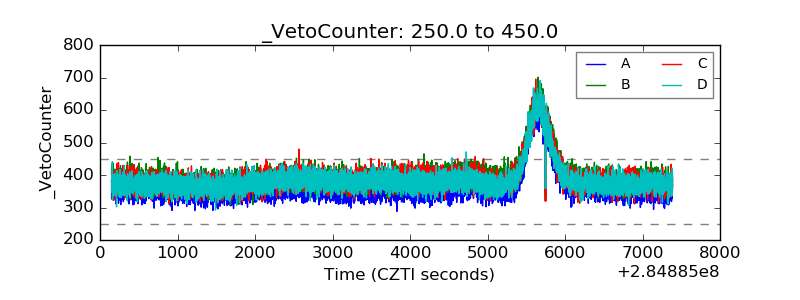 |