| Param | Original file | Final file |
|---|---|---|
| Filename | modeM0/AS1A05_015T01_9000002650_17780cztM0_level2.evt | modeM0/AS1A05_015T01_9000002650_17780cztM0_level2_quad_clean.evt |
| Size (bytes) | 532,869,120 | 82,071,360 |
| Size | 508.2 MB | 78.3 MB |
| Events in quadrant A | 3,259,069 | 508,610 |
| Events in quadrant B | 3,438,838 | 516,893 |
| Events in quadrant C | 3,482,622 | 493,159 |
| Events in quadrant D | 5,474,948 | 471,672 |
| Mode SS | |||
|---|---|---|---|
| Quadrant | BADHDUFLAG | Total packets | Discarded packets |
| A | 0 | 144 | 0 |
| B | 0 | 144 | 0 |
| C | 0 | 144 | 0 |
| D | 0 | 144 | 0 |
| Mode M9 | |||
|---|---|---|---|
| Quadrant | BADHDUFLAG | Total packets | Discarded packets |
| A | 0 | 2 | 0 |
| B | 0 | 2 | 0 |
| C | 0 | 2 | 0 |
| D | 0 | 2 | 0 |
| Mode M0 | |||
|---|---|---|---|
| Quadrant | BADHDUFLAG | Total packets | Discarded packets |
| A | 0 | 14534 | 1 |
| B | 0 | 14806 | 1 |
| C | 0 | 14959 | 1 |
| D | 0 | 21264 | 1 |
| Quadrant | Total seconds | Saturated seconds | Saturation percentage |
|---|---|---|---|
| A | 7102 | 147 | 2.069839% |
| B | 7102 | 173 | 2.435934% |
| C | 7102 | 198 | 2.787947% |
| D | 7102 | 841 | 11.841735% |
Noise dominated data is calculated using 1-second bins in cleaned event files. If a bin has >2000 counts, and if more than 50% of those come from <1% of pixels, then it is considered to be noise-dominated and hence unusable.
| Quadrant | # 1 sec bins | Bins with >0 counts | Bins with >2000 counts | High rate bins dominated by noise | Noise dominated (total time) | Noise dominated (detector-on time) | Marked lightcurve |
|---|---|---|---|---|---|---|---|
| A | 7327 | 7102 | 0 | 0 | 0.00% | 0.00% | 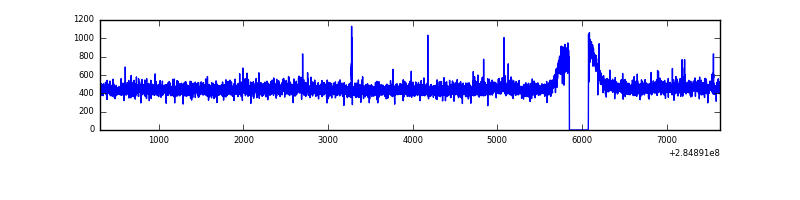 |
| B | 7327 | 7102 | 3 | 3 | 0.04% | 0.04% | 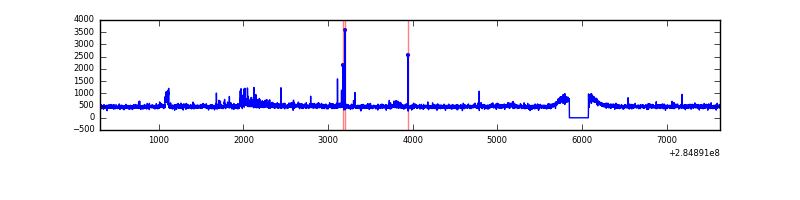 |
| C | 7327 | 7102 | 21 | 21 | 0.29% | 0.30% | 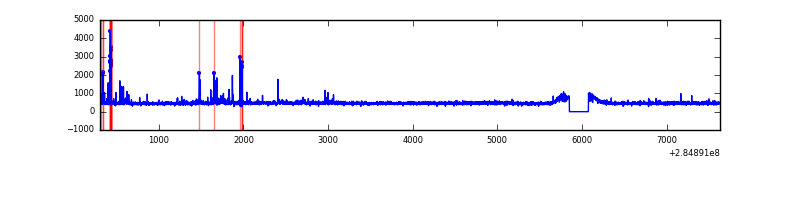 |
| D | 7327 | 7103 | 575 | 575 | 7.85% | 8.10% | 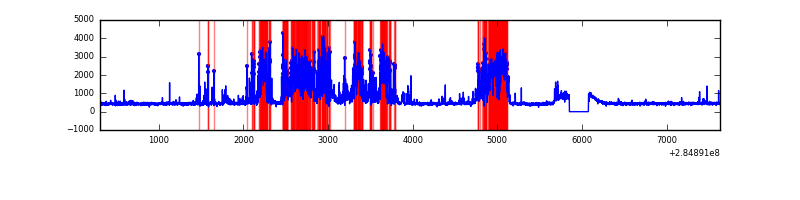 |
Top three noisy pixels from each quadrant. If the there are fewer than three noisy pixels in the level2.evt file, extra rows are filled as -1
| Pixel properties | Quadrant properties | ||||||
|---|---|---|---|---|---|---|---|
| Quadrant | DetID | PixID | Counts | Sigma | Mean | Median | Sigma |
| A | 15 | 174 | 8135 | 42.27 | 845 | 823 | 173.0 |
| A | 0 | 226 | 7388 | 37.95 | 845 | 823 | 173.0 |
| A | 3 | 137 | 6407 | 32.28 | 845 | 823 | 173.0 |
| B | 7 | 220 | 50276 | 302.86 | 841 | 817 | 163.3 |
| B | 0 | 219 | 25561 | 151.52 | 841 | 817 | 163.3 |
| B | 0 | 230 | 23405 | 138.32 | 841 | 817 | 163.3 |
| C | 4 | 254 | 151732 | 797.31 | 804 | 806 | 189.3 |
| C | 14 | 238 | 123080 | 645.95 | 804 | 806 | 189.3 |
| C | 5 | 218 | 43893 | 227.62 | 804 | 806 | 189.3 |
| D | 7 | 238 | 2365155 | 12525.23 | 787 | 767 | 188.8 |
| D | 10 | 70 | 72120 | 377.99 | 787 | 767 | 188.8 |
| D | 2 | 234 | 41307 | 214.76 | 787 | 767 | 188.8 |
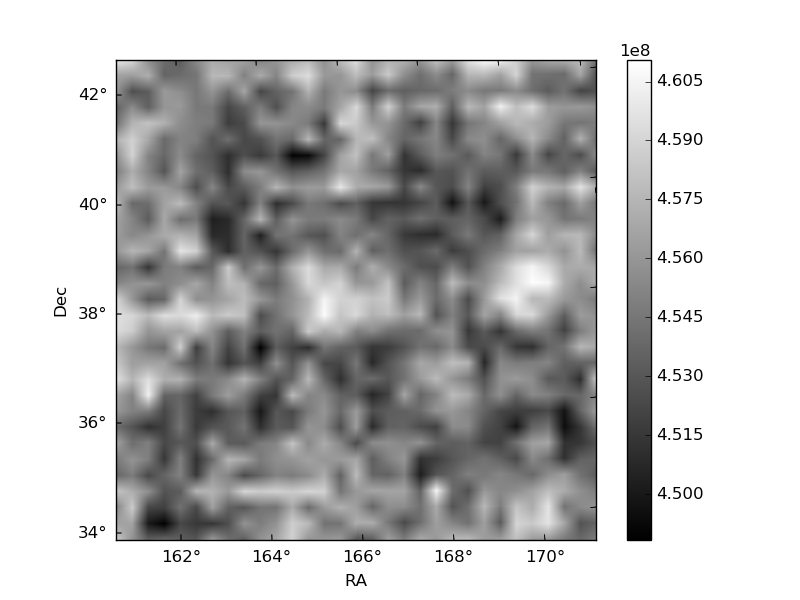
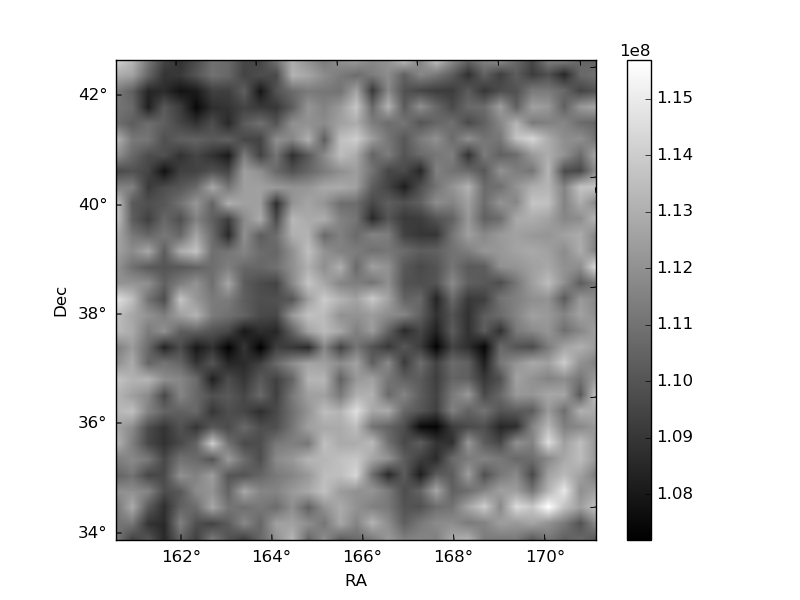
Histogram calculated using DETX and DETY for each event in the final _common_clean file
| Quadrant A | 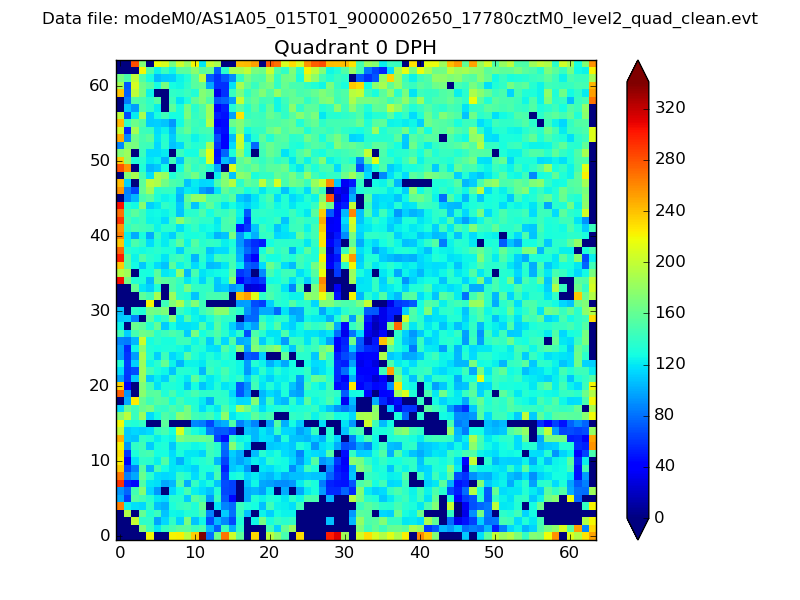 |
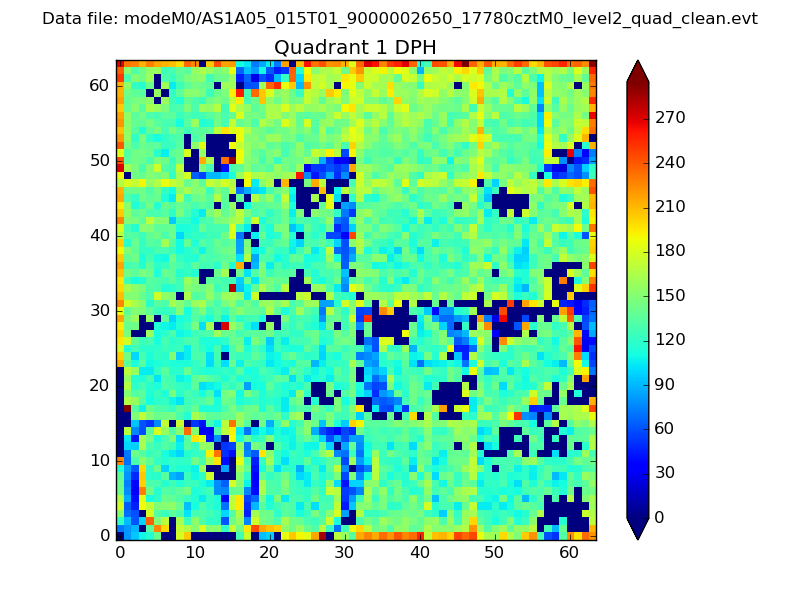 |
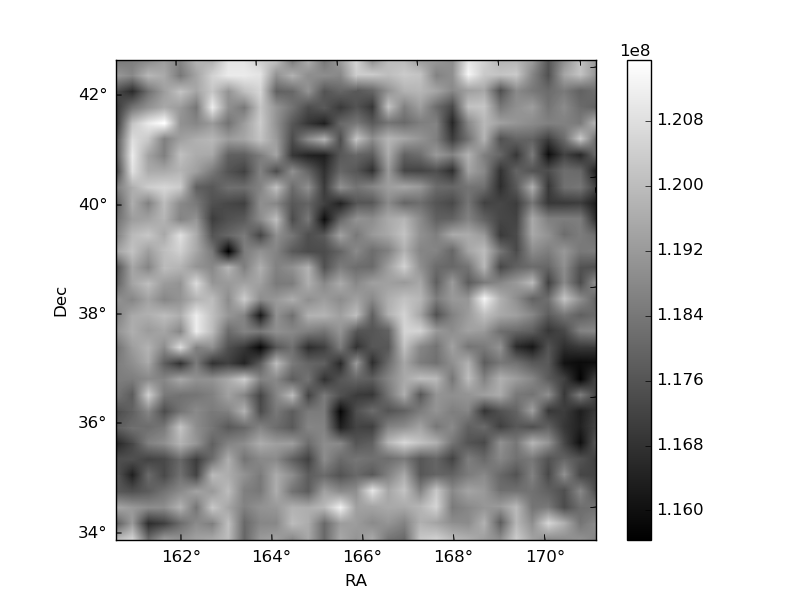
Quadrant B |
|---|---|---|---|
| Quadrant D | 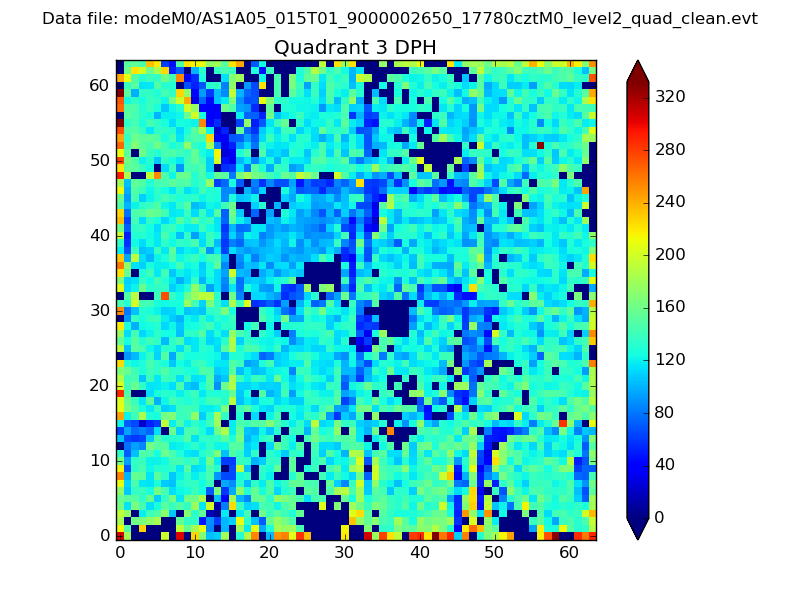 |
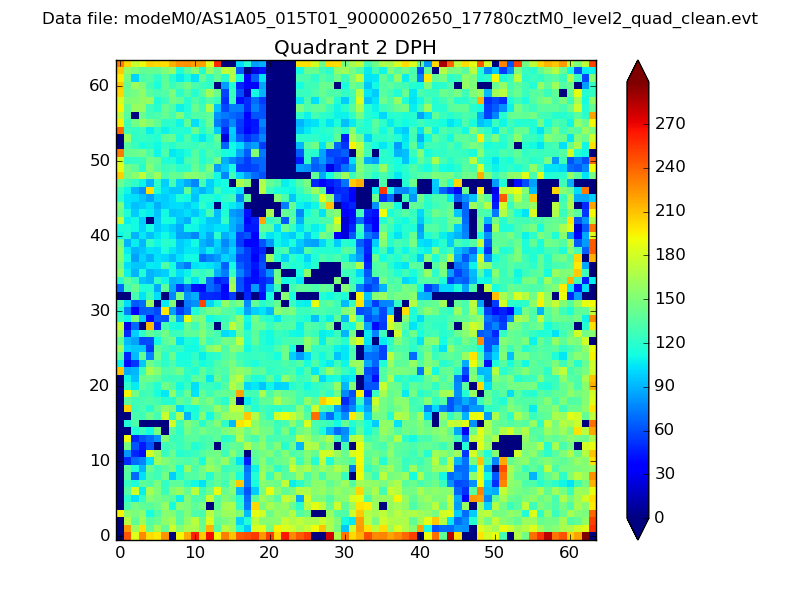 |
Quadrant C |
| Plot type | Count rate plots | Images |
|---|---|---|
| Comparison with Poisson distribution Blue bars denote a histogram of data divided into 1 sec bins. Red curve is a Poisson curve with rate = median count rate of data. |
 |
 |
| Quadrant-wise count rates Data is divided into 100 sec bins |
 |
|
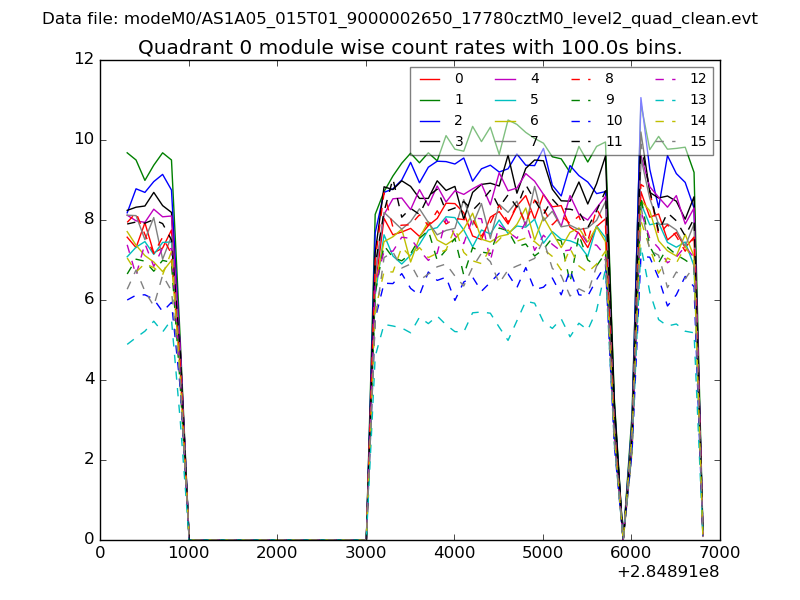
| Module-wise count rates for Quadrant A Data is divided into 100 sec bins |
 |
 |
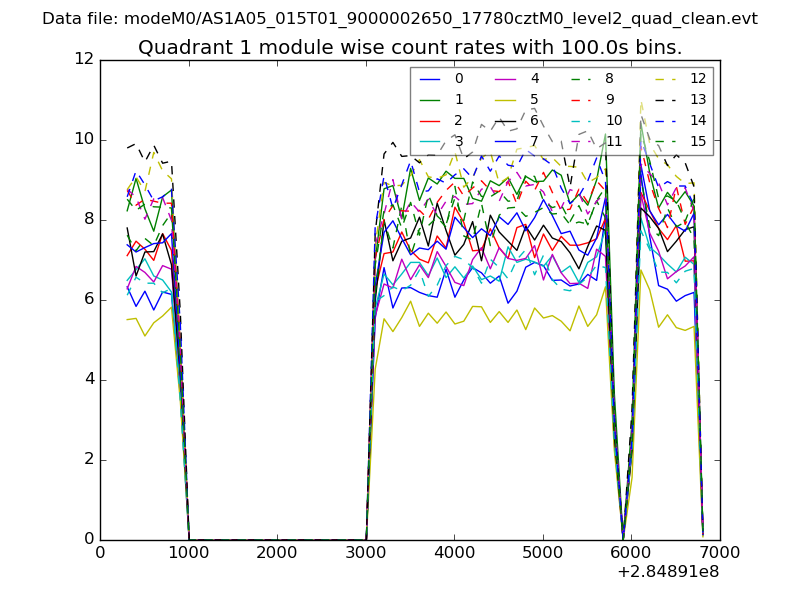
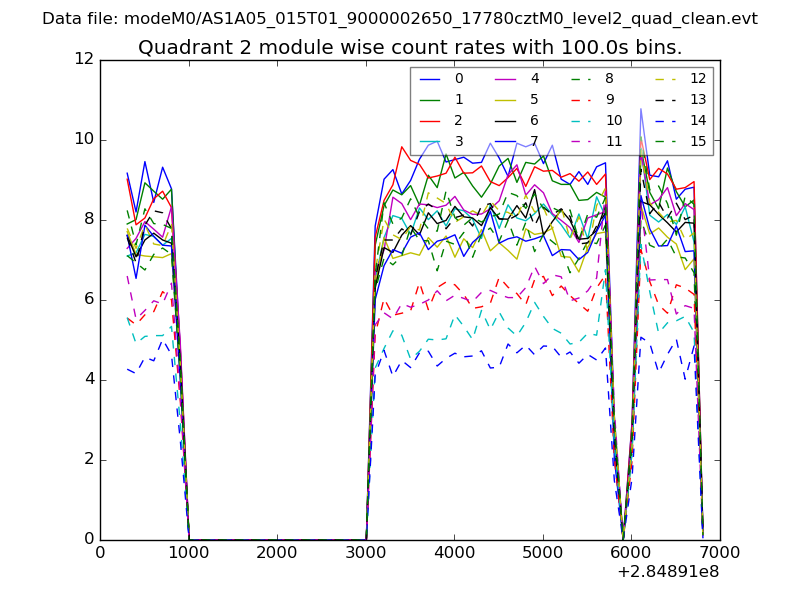
| Module-wise count rates for Quadrant B Data is divided into 100 sec bins |
 |
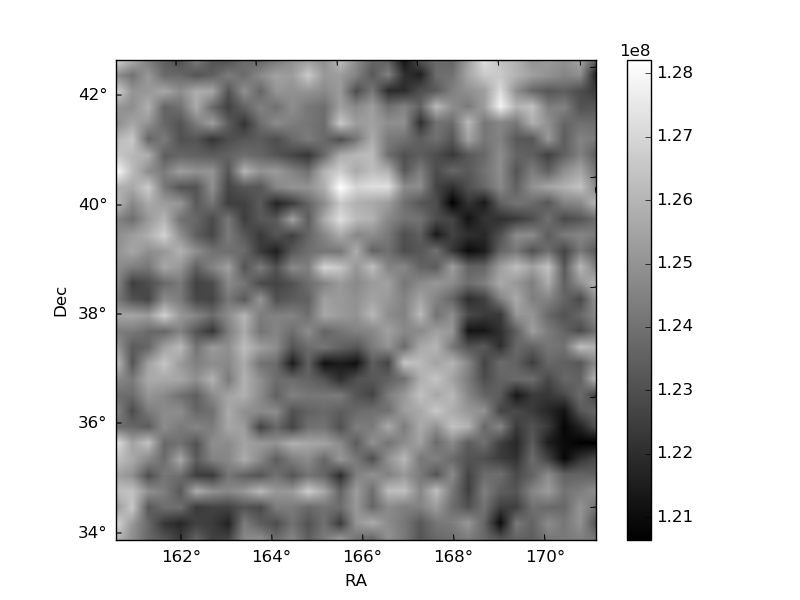 |
| Module-wise count rates for Quadrant C Data is divided into 100 sec bins |
 |
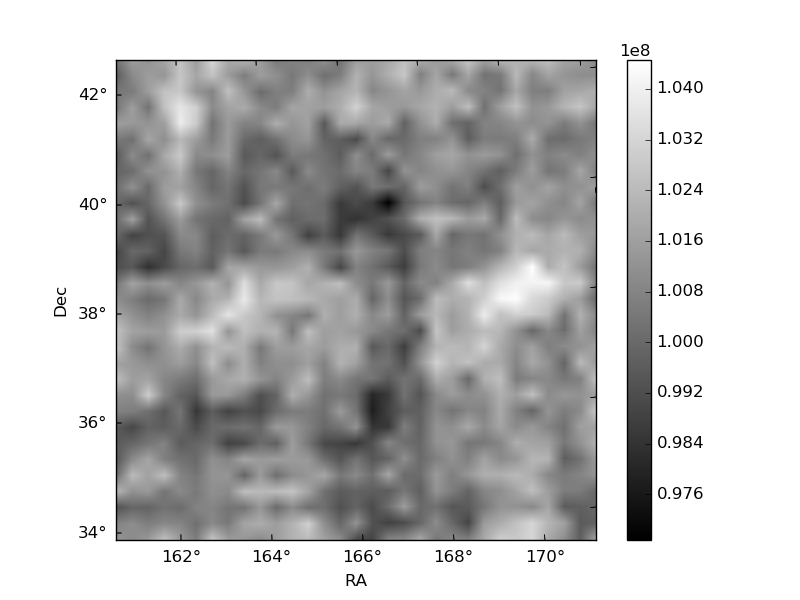 |
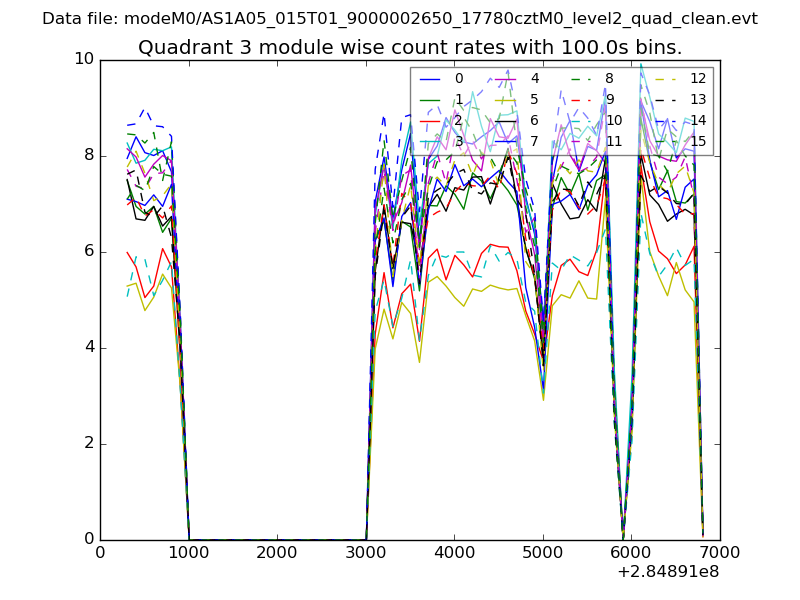
| Module-wise count rates for Quadrant D Data is divided into 100 sec bins |
 |
 |
| Parameter | Plot |
|---|---|
| CZT HV Monitor | 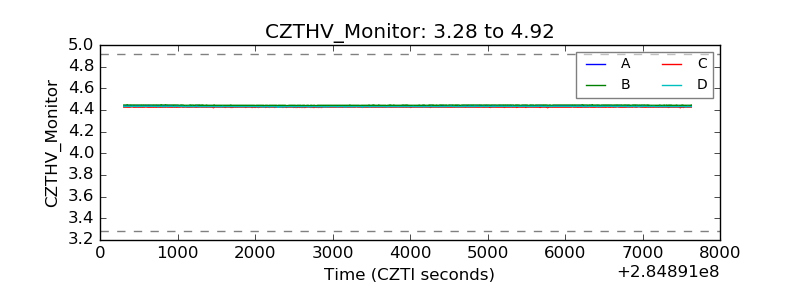 |
| D_VDD | 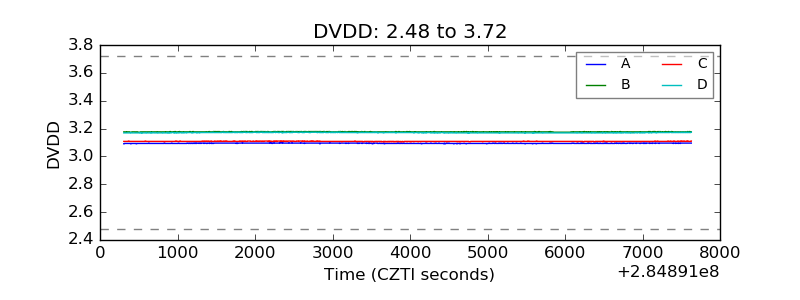 |
| Temperature 1 | 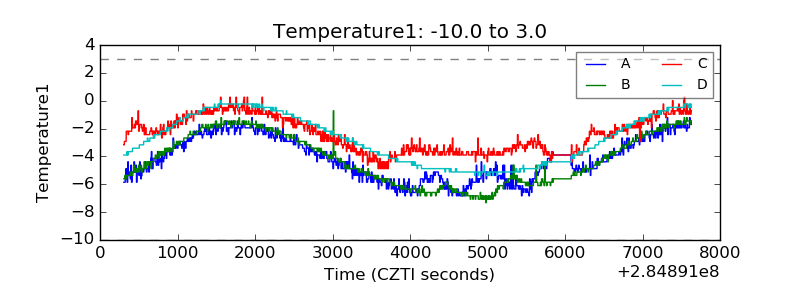 |
| Veto HV Monitor | 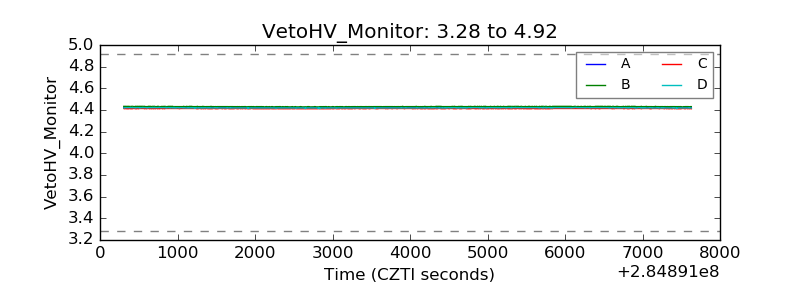 |
| Veto LLD | 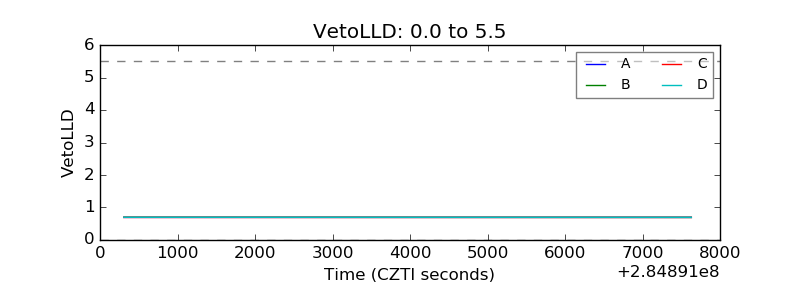 |
| Alpha Counter |  |
| _CPM_Rate | 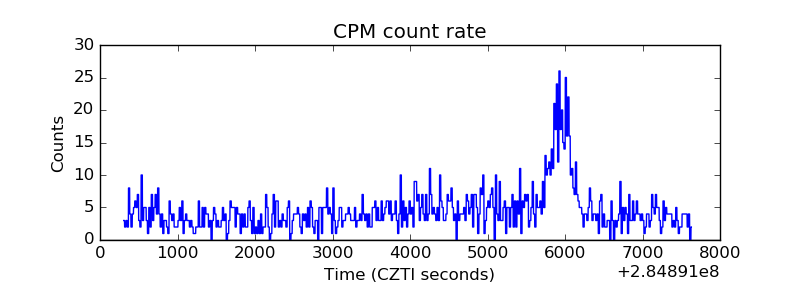 |
| CZT Counter | 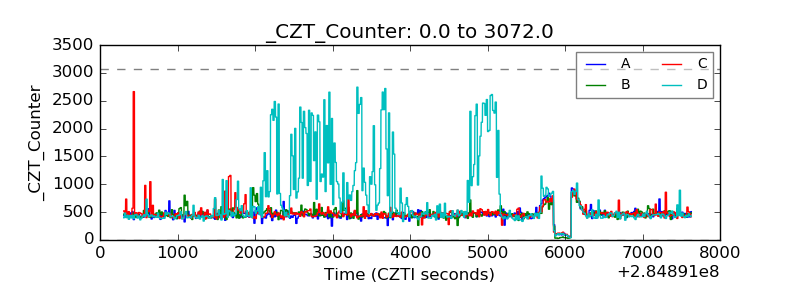 |
| +2.5 Volts monitor |  |
| +5 Volts monitor |  |
| _ROLL_ROT | 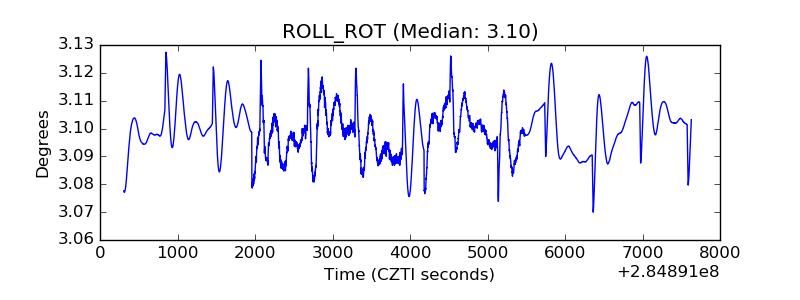 |
| _Roll_DEC |  |
| _Roll_RA | 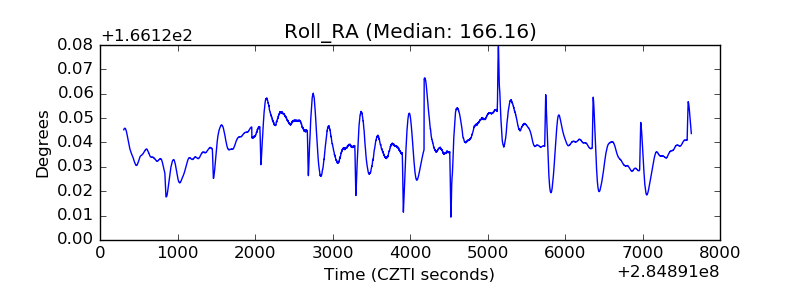 |
| Veto Counter | 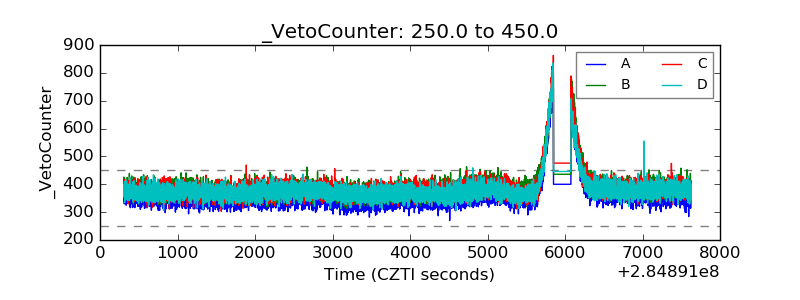 |