| Param | Original file | Final file |
|---|---|---|
| Filename | modeM0/AS1A05_015T01_9000002650_17782cztM0_level2.evt | modeM0/AS1A05_015T01_9000002650_17782cztM0_level2_quad_clean.evt |
| Size (bytes) | 871,467,840 | 138,018,240 |
| Size | 831.1 MB | 131.6 MB |
| Events in quadrant A | 5,863,017 | 839,187 |
| Events in quadrant B | 6,213,279 | 847,713 |
| Events in quadrant C | 5,921,243 | 813,395 |
| Events in quadrant D | 7,532,527 | 798,975 |
| Mode SS | |||
|---|---|---|---|
| Quadrant | BADHDUFLAG | Total packets | Discarded packets |
| A | 0 | 258 | 0 |
| B | 0 | 258 | 0 |
| C | 0 | 258 | 0 |
| D | 0 | 258 | 0 |
| Mode M9 | |||
|---|---|---|---|
| Quadrant | BADHDUFLAG | Total packets | Discarded packets |
| A | 0 | 12 | 0 |
| B | 0 | 12 | 0 |
| C | 0 | 12 | 0 |
| D | 0 | 12 | 0 |
| Mode M0 | |||
|---|---|---|---|
| Quadrant | BADHDUFLAG | Total packets | Discarded packets |
| A | 0 | 25913 | 2 |
| B | 0 | 26731 | 2 |
| C | 0 | 25905 | 2 |
| D | 0 | 31083 | 2 |
| Quadrant | Total seconds | Saturated seconds | Saturation percentage |
|---|---|---|---|
| A | 12737 | 136 | 1.067755% |
| B | 12738 | 173 | 1.358141% |
| C | 12738 | 177 | 1.389543% |
| D | 12737 | 412 | 3.234671% |
Noise dominated data is calculated using 1-second bins in cleaned event files. If a bin has >2000 counts, and if more than 50% of those come from <1% of pixels, then it is considered to be noise-dominated and hence unusable.
| Quadrant | # 1 sec bins | Bins with >0 counts | Bins with >2000 counts | High rate bins dominated by noise | Noise dominated (total time) | Noise dominated (detector-on time) | Marked lightcurve |
|---|---|---|---|---|---|---|---|
| A | 13912 | 12737 | 0 | 0 | 0.00% | 0.00% | 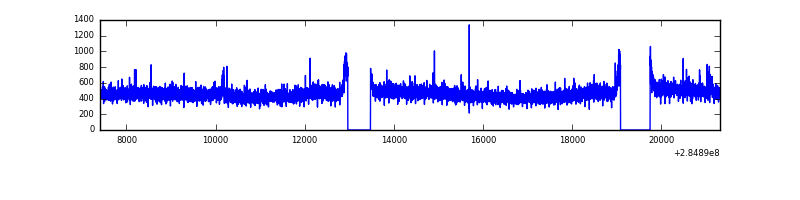 |
| B | 13913 | 12738 | 18 | 18 | 0.13% | 0.14% | 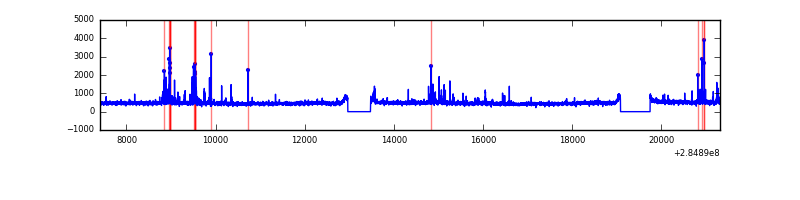 |
| C | 13913 | 12738 | 0 | 0 | 0.00% | 0.00% | 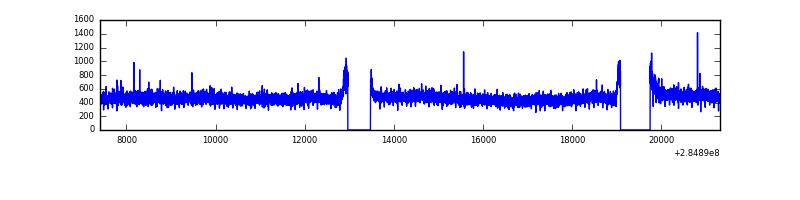 |
| D | 13912 | 12737 | 252 | 252 | 1.81% | 1.98% | 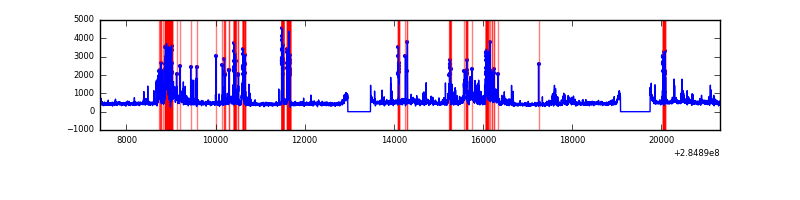 |
Top three noisy pixels from each quadrant. If the there are fewer than three noisy pixels in the level2.evt file, extra rows are filled as -1
| Pixel properties | Quadrant properties | ||||||
|---|---|---|---|---|---|---|---|
| Quadrant | DetID | PixID | Counts | Sigma | Mean | Median | Sigma |
| A | 15 | 174 | 30256 | 93.87 | 1515 | 1478 | 306.6 |
| A | 0 | 226 | 13306 | 38.58 | 1515 | 1478 | 306.6 |
| A | 4 | 2 | 12114 | 34.69 | 1515 | 1478 | 306.6 |
| B | 7 | 220 | 159811 | 547.08 | 1508 | 1468 | 289.4 |
| B | 4 | 142 | 42944 | 143.3 | 1508 | 1468 | 289.4 |
| B | 12 | 111 | 34595 | 114.45 | 1508 | 1468 | 289.4 |
| C | 14 | 238 | 220312 | 645.53 | 1442 | 1450 | 339.0 |
| C | 5 | 218 | 36548 | 103.52 | 1442 | 1450 | 339.0 |
| C | 3 | 233 | 31011 | 87.19 | 1442 | 1450 | 339.0 |
| D | 7 | 238 | 1632826 | 4657.87 | 1454 | 1416 | 350.2 |
| D | 10 | 70 | 132942 | 375.52 | 1454 | 1416 | 350.2 |
| D | 12 | 110 | 110320 | 310.93 | 1454 | 1416 | 350.2 |
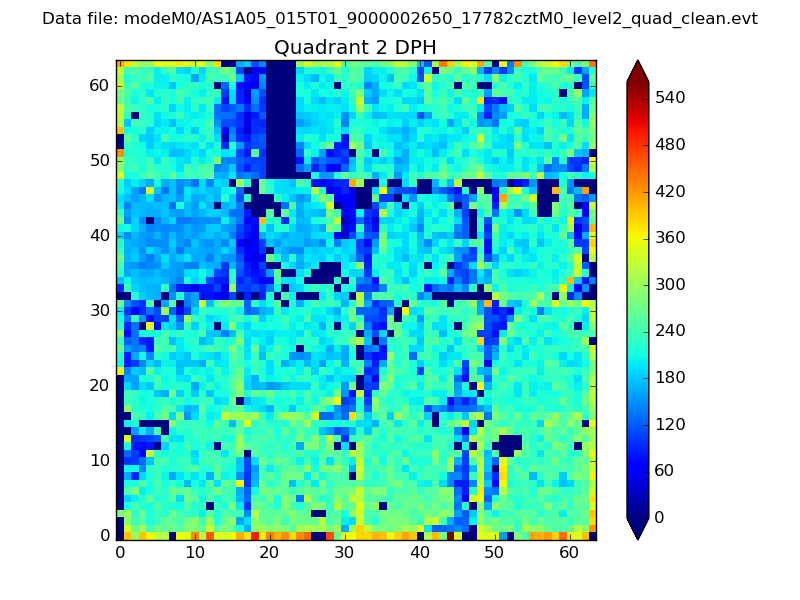
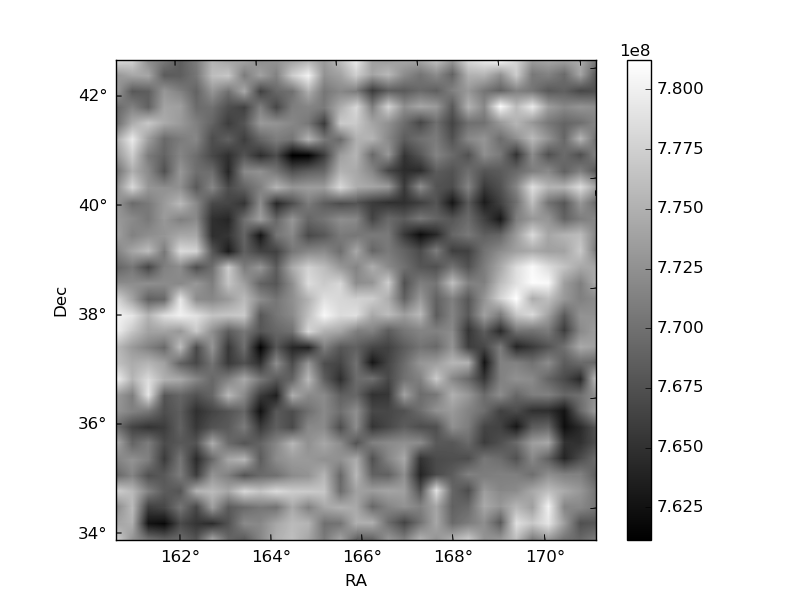
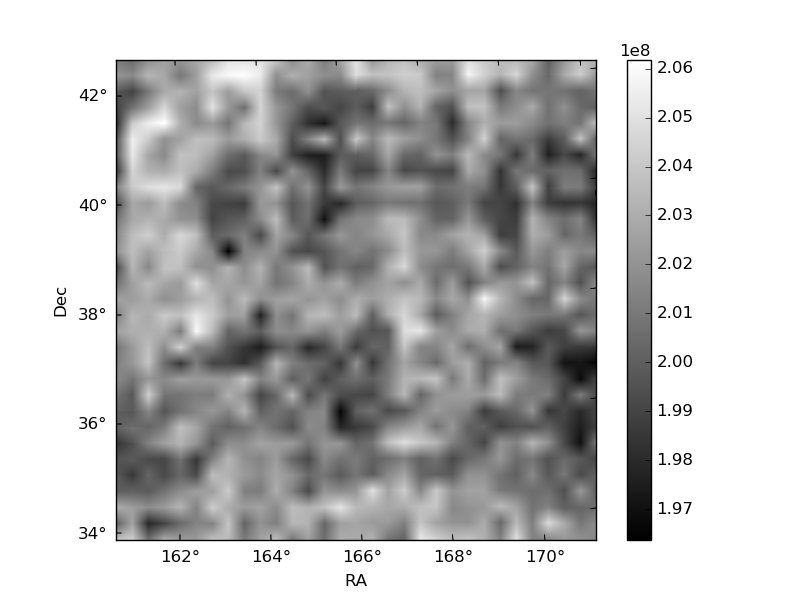
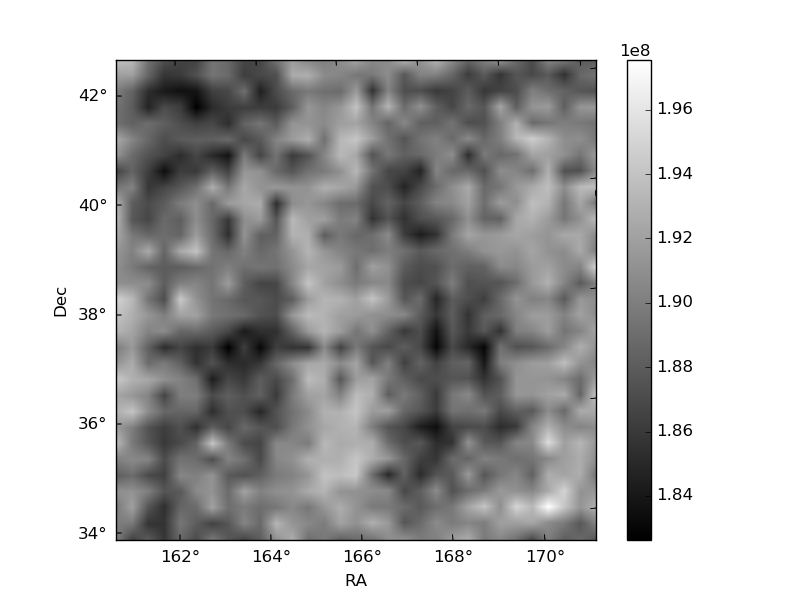
Histogram calculated using DETX and DETY for each event in the final _common_clean file
| Quadrant A | 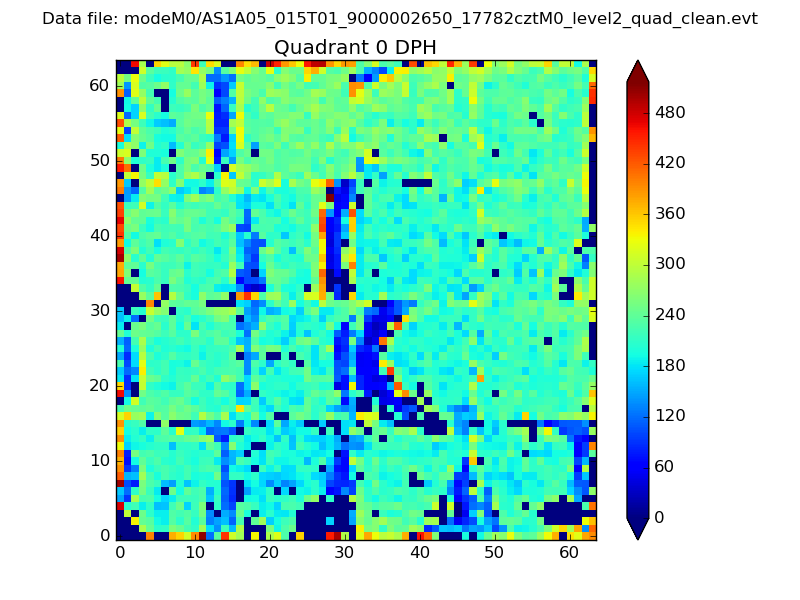 |
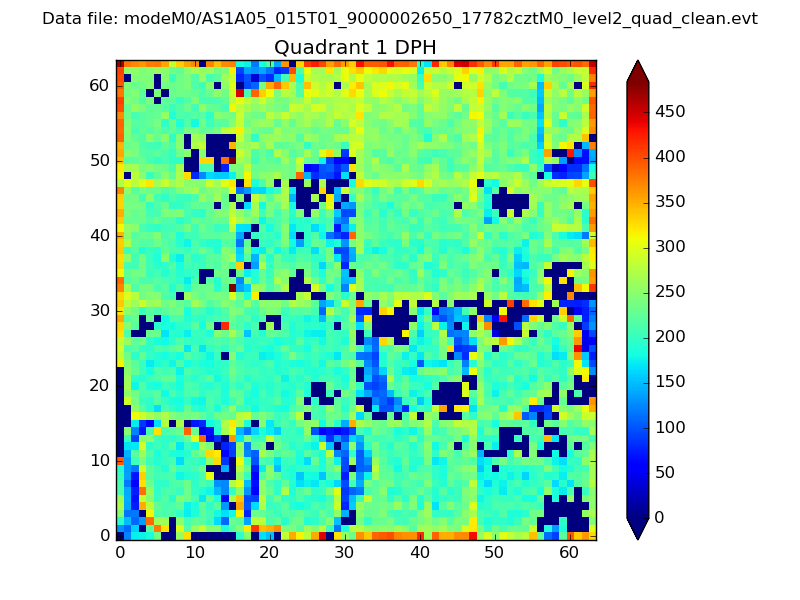 |
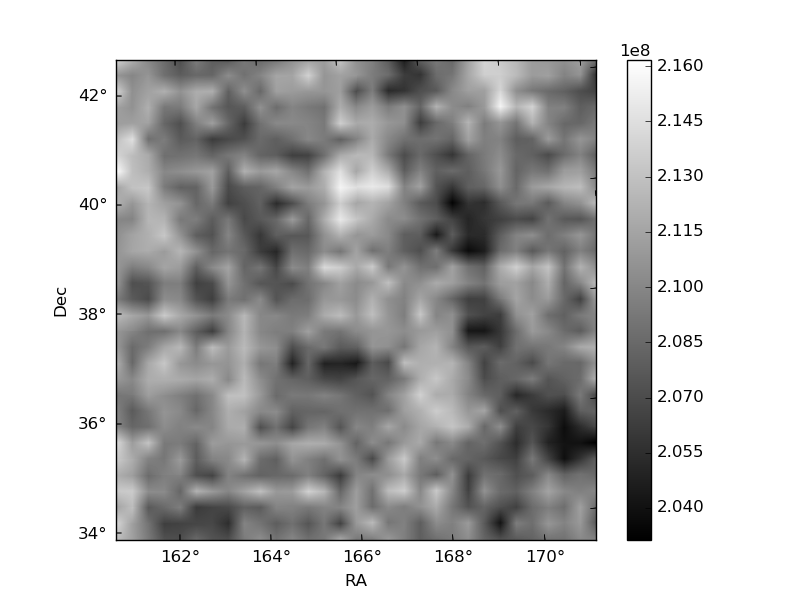
Quadrant B |
|---|---|---|---|
| Quadrant D | 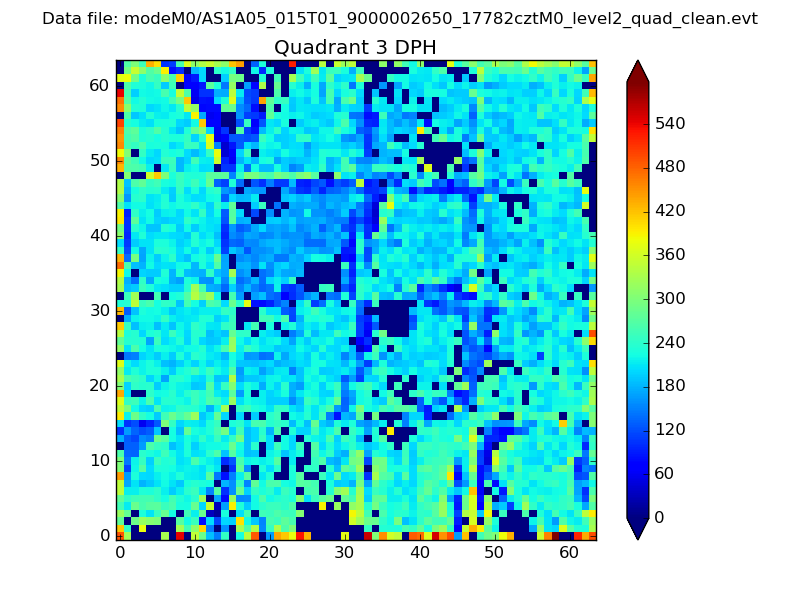 |
 |
Quadrant C |
| Plot type | Count rate plots | Images |
|---|---|---|
| Comparison with Poisson distribution Blue bars denote a histogram of data divided into 1 sec bins. Red curve is a Poisson curve with rate = median count rate of data. |
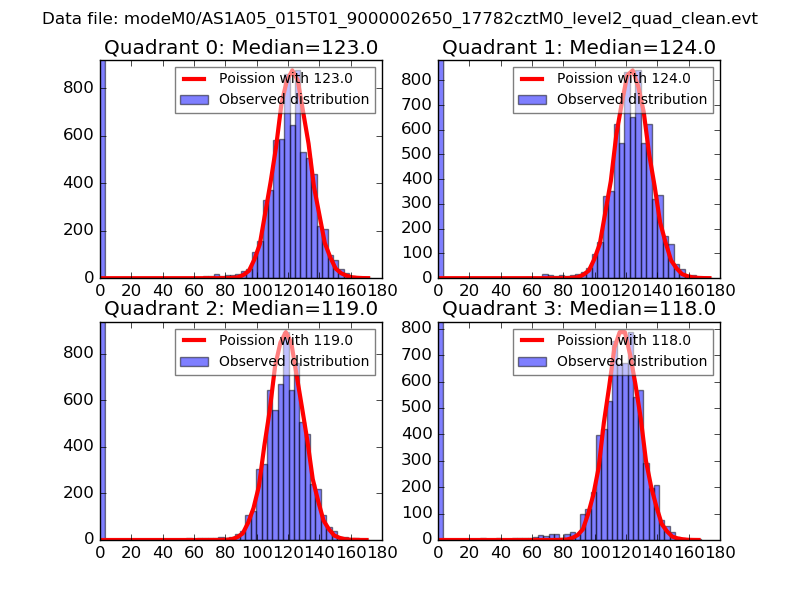 |
 |
| Quadrant-wise count rates Data is divided into 100 sec bins |
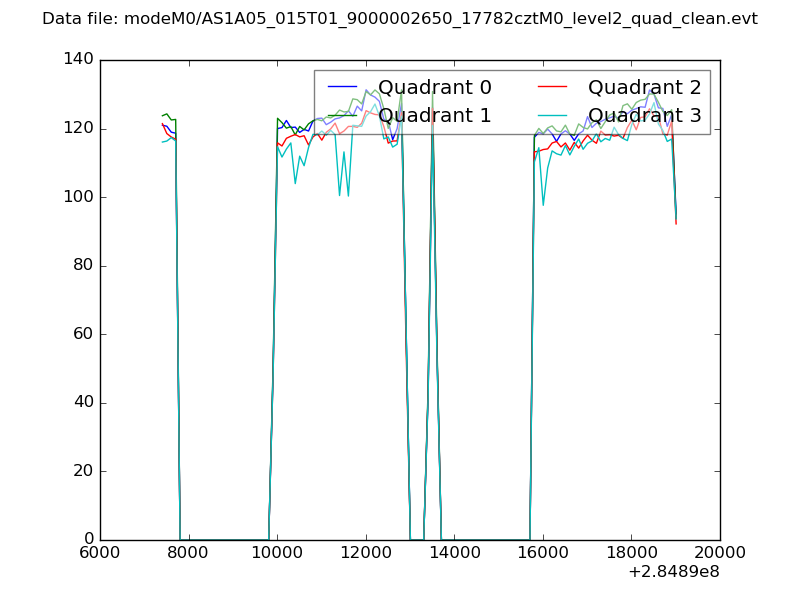 |
|
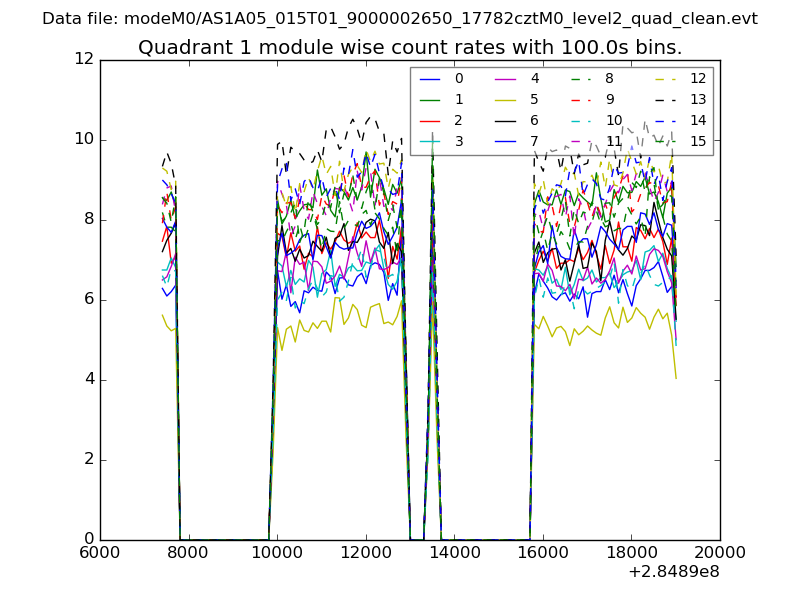
| Module-wise count rates for Quadrant A Data is divided into 100 sec bins |
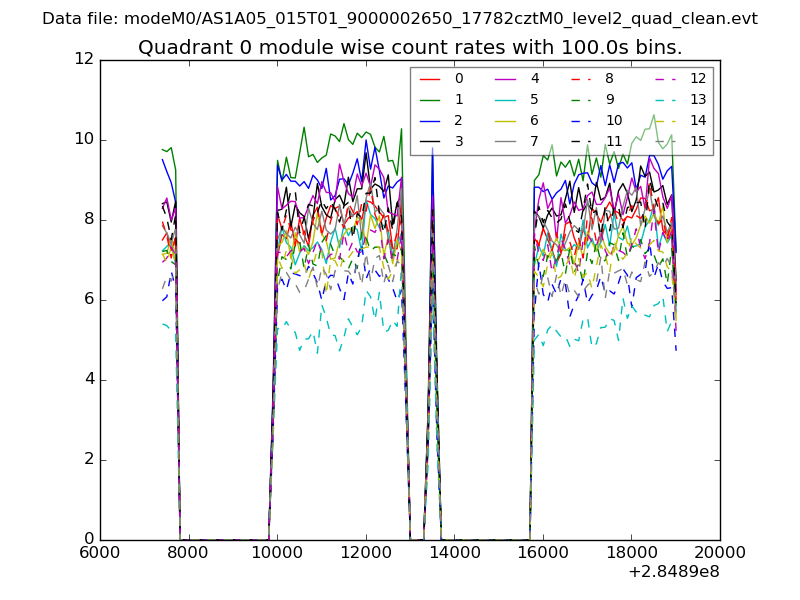 |
 |
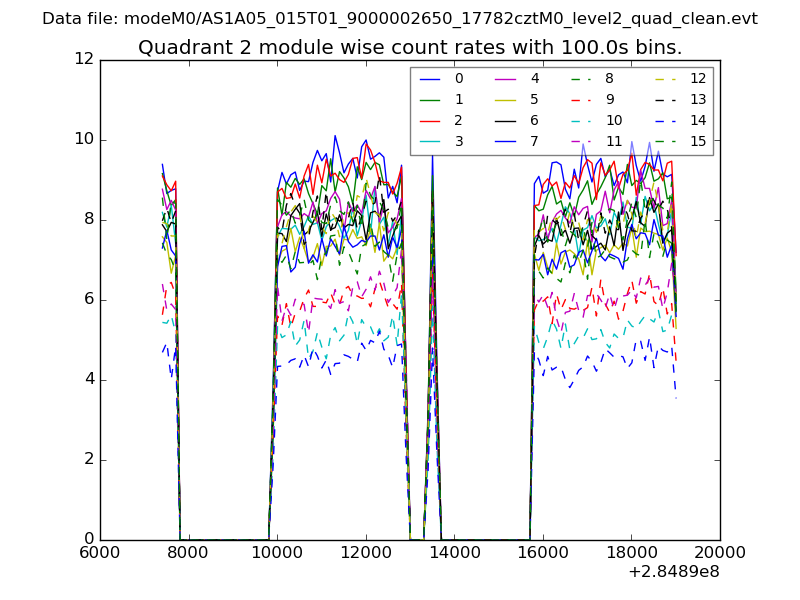
| Module-wise count rates for Quadrant B Data is divided into 100 sec bins |
 |
 |
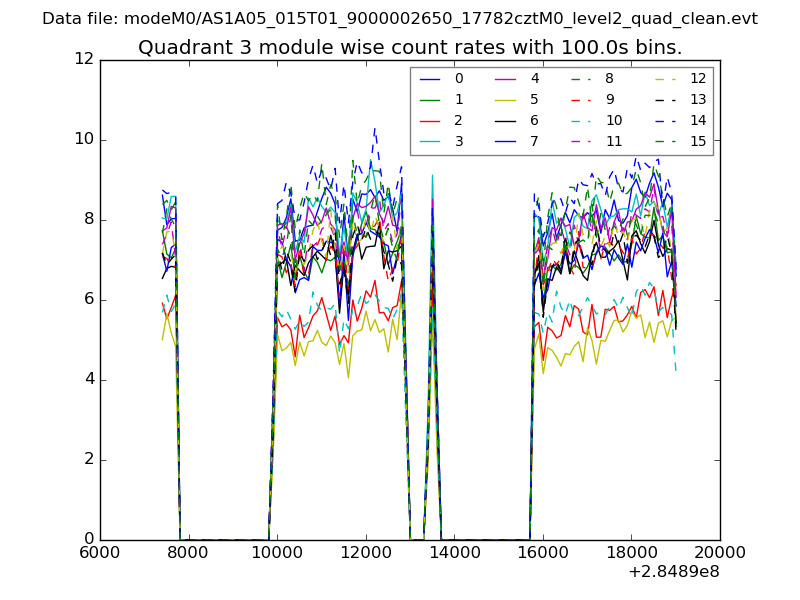
| Module-wise count rates for Quadrant C Data is divided into 100 sec bins |
 |
 |
| Module-wise count rates for Quadrant D Data is divided into 100 sec bins |
 |
 |
| Parameter | Plot |
|---|---|
| CZT HV Monitor | 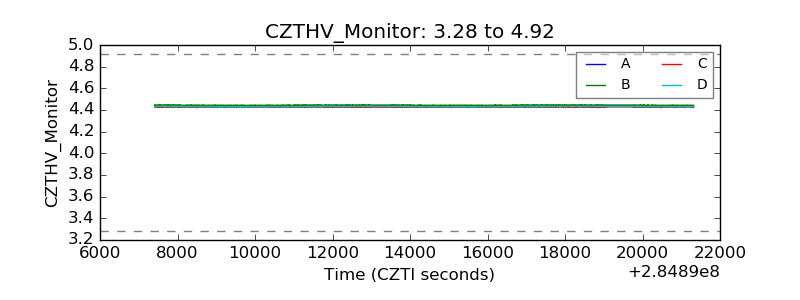 |
| D_VDD | 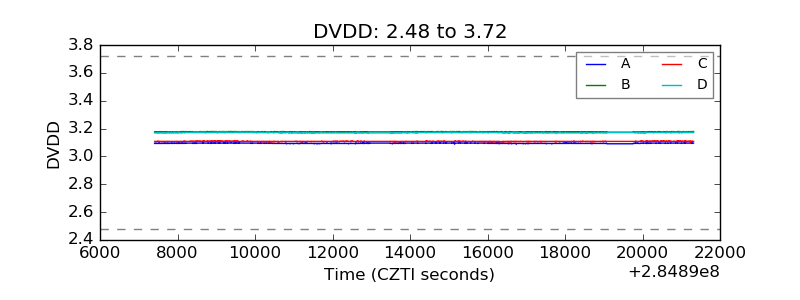 |
| Temperature 1 |  |
| Veto HV Monitor | 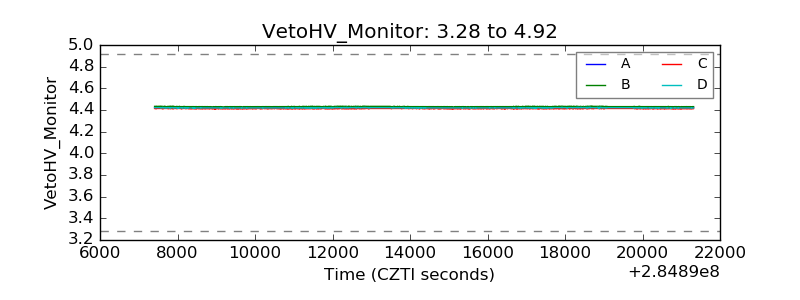 |
| Veto LLD | 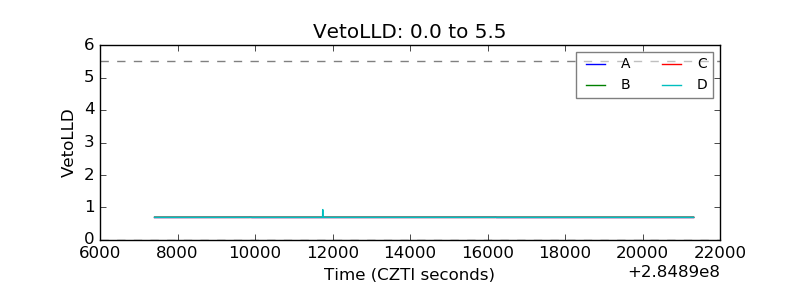 |
| Alpha Counter | 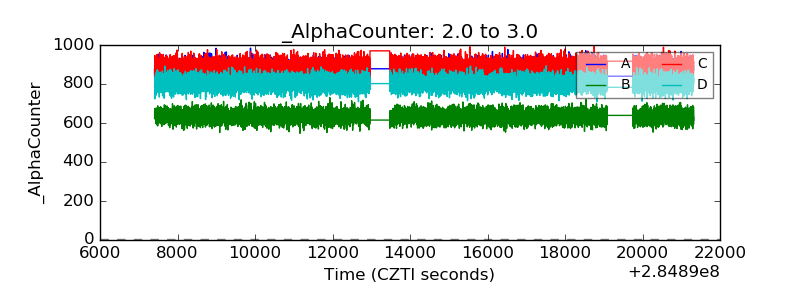 |
| _CPM_Rate | 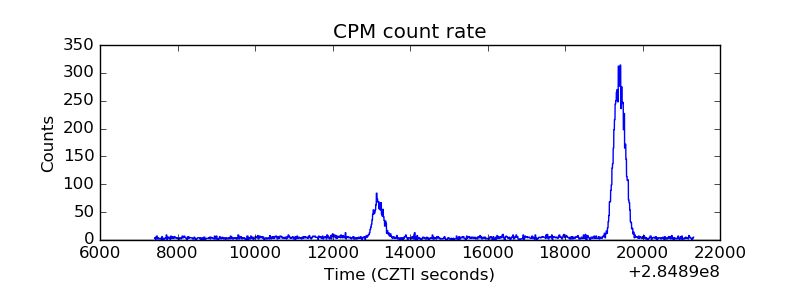 |
| CZT Counter | 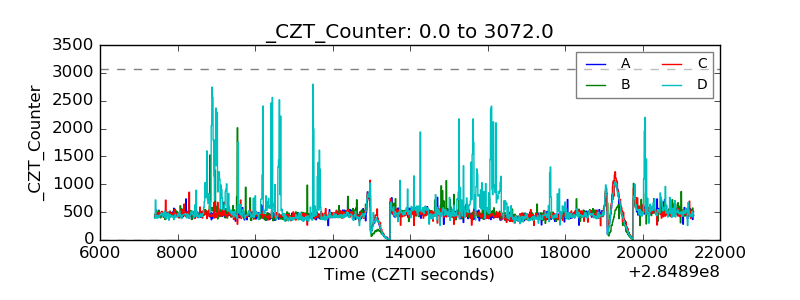 |
| +2.5 Volts monitor |  |
| +5 Volts monitor |  |
| _ROLL_ROT | 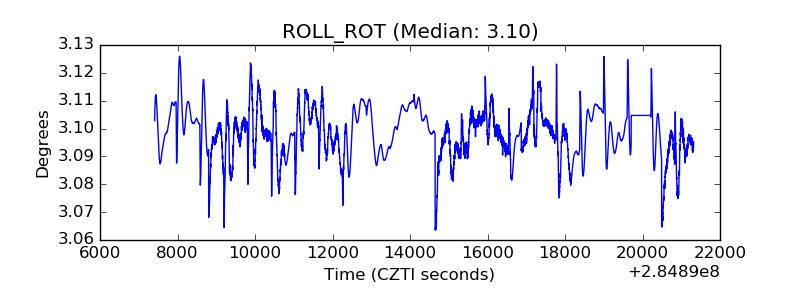 |
| _Roll_DEC | 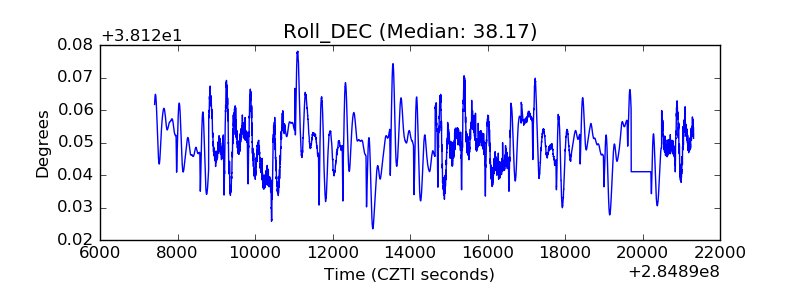 |
| _Roll_RA | 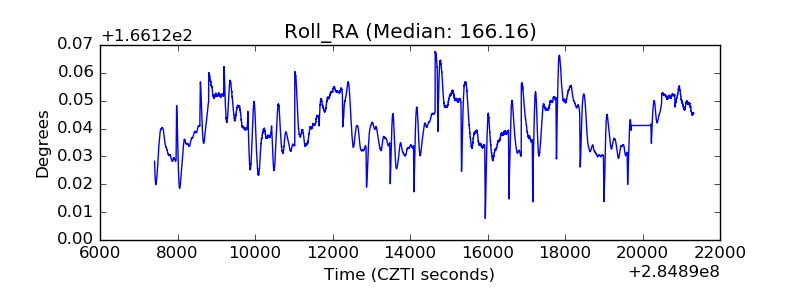 |
| Veto Counter | 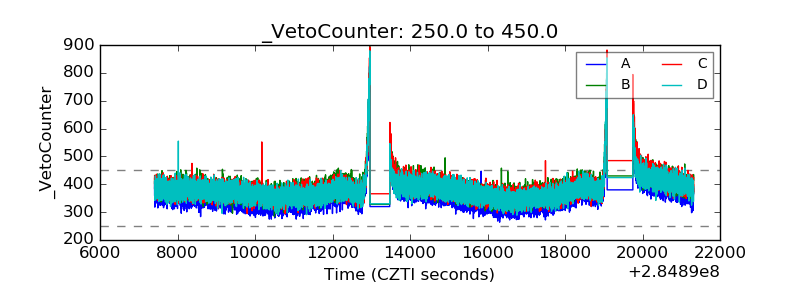 |