| Param | Original file | Final file |
|---|---|---|
| Filename | modeM0/AS1A05_015T01_9000002650_17784cztM0_level2.evt | modeM0/AS1A05_015T01_9000002650_17784cztM0_level2_quad_clean.evt |
| Size (bytes) | 465,321,600 | 77,659,200 |
| Size | 443.8 MB | 74.1 MB |
| Events in quadrant A | 3,106,377 | 481,085 |
| Events in quadrant B | 3,313,272 | 486,341 |
| Events in quadrant C | 3,181,263 | 469,039 |
| Events in quadrant D | 4,051,475 | 463,294 |
| Mode SS | |||
|---|---|---|---|
| Quadrant | BADHDUFLAG | Total packets | Discarded packets |
| A | 0 | 132 | 0 |
| B | 0 | 132 | 0 |
| C | 0 | 132 | 0 |
| D | 0 | 132 | 0 |
| Mode M9 | |||
|---|---|---|---|
| Quadrant | BADHDUFLAG | Total packets | Discarded packets |
| A | 0 | 12 | 0 |
| B | 0 | 13 | 0 |
| C | 0 | 13 | 0 |
| D | 0 | 13 | 0 |
| Mode M0 | |||
|---|---|---|---|
| Quadrant | BADHDUFLAG | Total packets | Discarded packets |
| A | 0 | 13589 | 3 |
| B | 0 | 14185 | 2 |
| C | 0 | 13802 | 2 |
| D | 0 | 16437 | 2 |
| Quadrant | Total seconds | Saturated seconds | Saturation percentage |
|---|---|---|---|
| A | 6475 | 77 | 1.189189% |
| B | 6475 | 97 | 1.498069% |
| C | 6475 | 91 | 1.405405% |
| D | 6475 | 161 | 2.486486% |
Noise dominated data is calculated using 1-second bins in cleaned event files. If a bin has >2000 counts, and if more than 50% of those come from <1% of pixels, then it is considered to be noise-dominated and hence unusable.
| Quadrant | # 1 sec bins | Bins with >0 counts | Bins with >2000 counts | High rate bins dominated by noise | Noise dominated (total time) | Noise dominated (detector-on time) | Marked lightcurve |
|---|---|---|---|---|---|---|---|
| A | 7495 | 6476 | 8 | 8 | 0.11% | 0.12% | 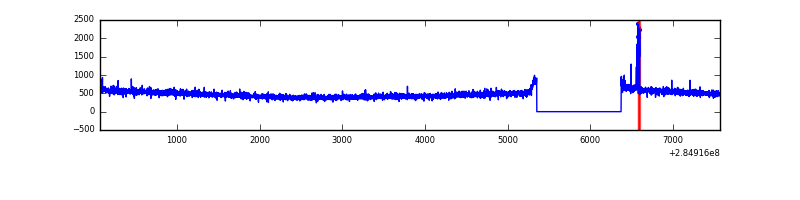 |
| B | 7495 | 6475 | 8 | 8 | 0.11% | 0.12% | 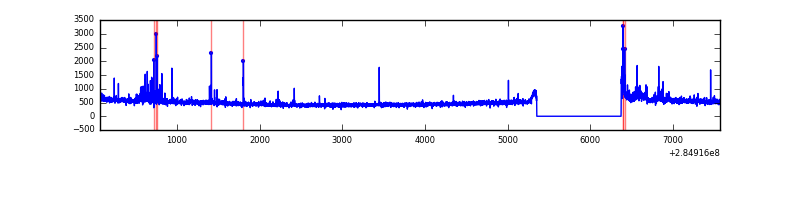 |
| C | 7495 | 6475 | 0 | 0 | 0.00% | 0.00% | 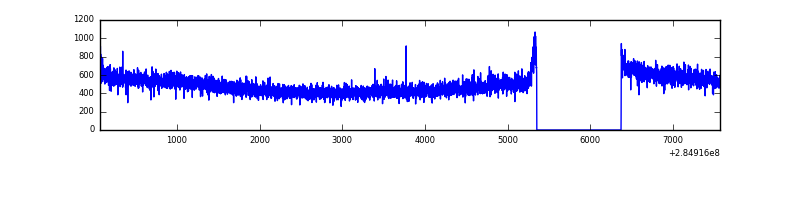 |
| D | 7495 | 6475 | 87 | 87 | 1.16% | 1.34% | 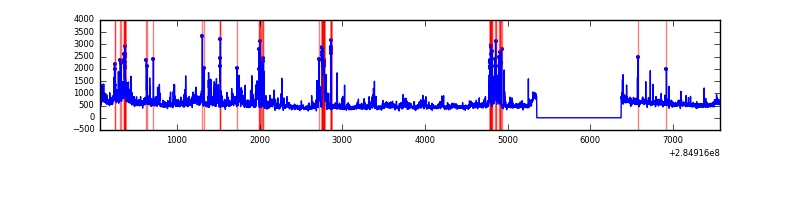 |
Top three noisy pixels from each quadrant. If the there are fewer than three noisy pixels in the level2.evt file, extra rows are filled as -1
| Pixel properties | Quadrant properties | ||||||
|---|---|---|---|---|---|---|---|
| Quadrant | DetID | PixID | Counts | Sigma | Mean | Median | Sigma |
| A | 15 | 174 | 40658 | 246.0 | 797 | 778 | 162.1 |
| A | 0 | 226 | 6815 | 37.24 | 797 | 778 | 162.1 |
| A | 12 | 194 | 5884 | 31.5 | 797 | 778 | 162.1 |
| B | 7 | 220 | 57275 | 369.89 | 798 | 777 | 152.7 |
| B | 15 | 35 | 43298 | 278.38 | 798 | 777 | 152.7 |
| B | 3 | 209 | 33721 | 215.68 | 798 | 777 | 152.7 |
| C | 14 | 238 | 119478 | 657.2 | 771 | 777 | 180.6 |
| C | 3 | 233 | 44320 | 241.08 | 771 | 777 | 180.6 |
| C | 1 | 16 | 8717 | 43.96 | 771 | 777 | 180.6 |
| D | 7 | 238 | 745452 | 3982.16 | 777 | 757 | 187.0 |
| D | 1 | 52 | 226568 | 1207.49 | 777 | 757 | 187.0 |
| D | 8 | 195 | 79132 | 419.1 | 777 | 757 | 187.0 |
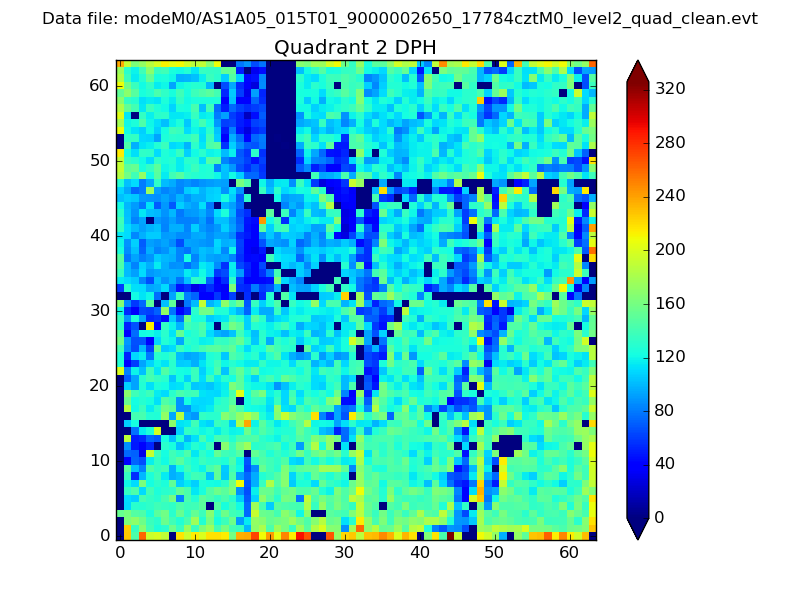
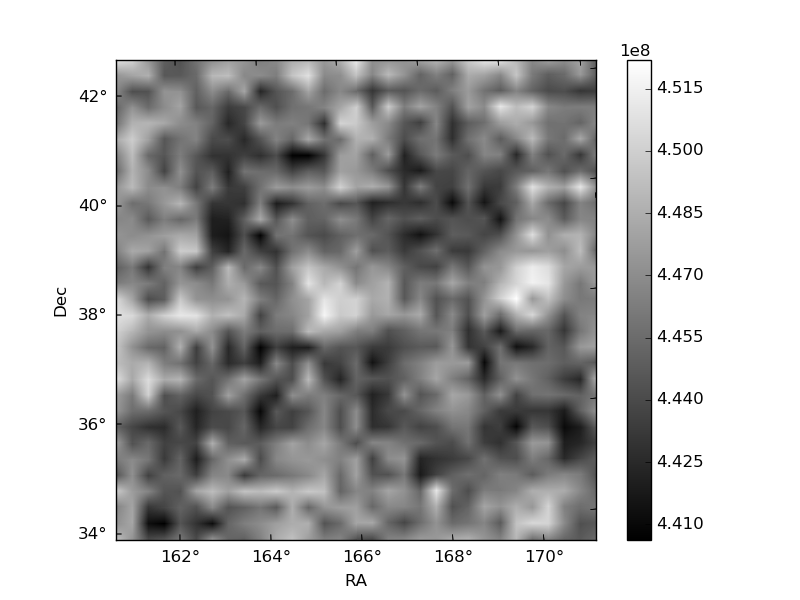
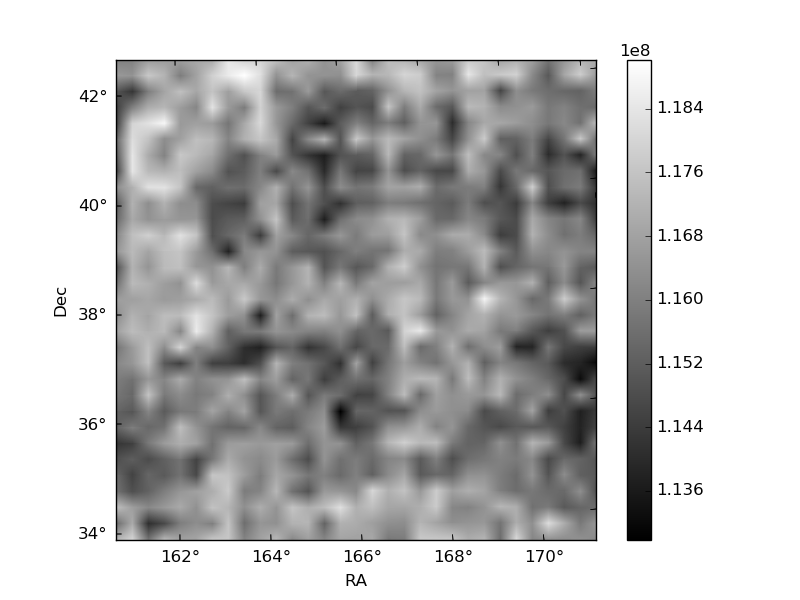
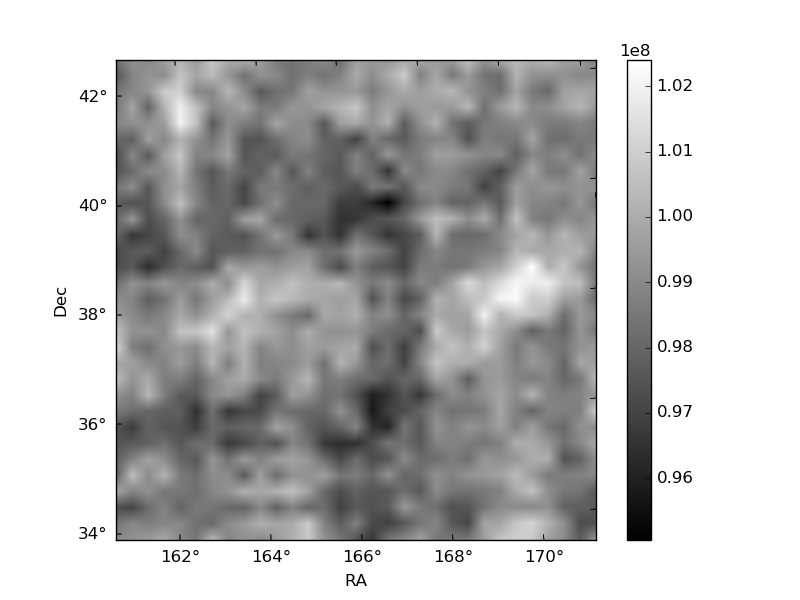
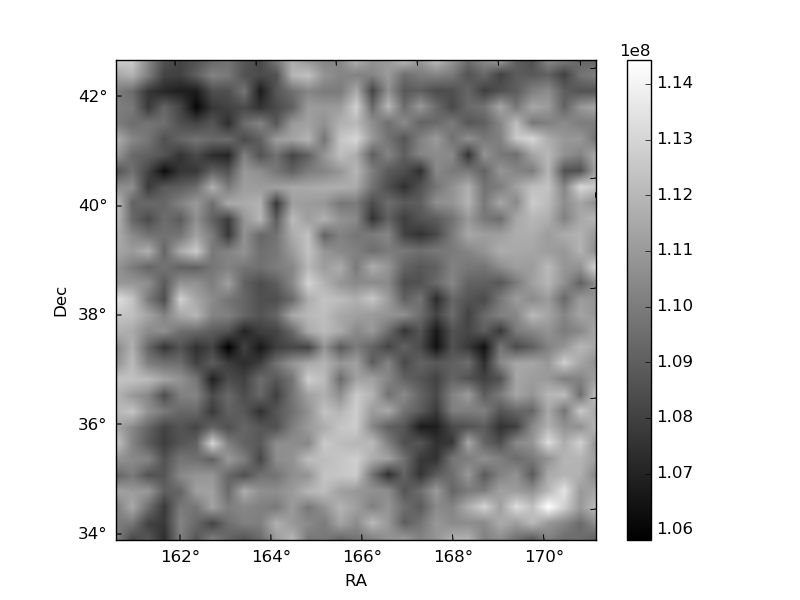
Histogram calculated using DETX and DETY for each event in the final _common_clean file
| Quadrant A | 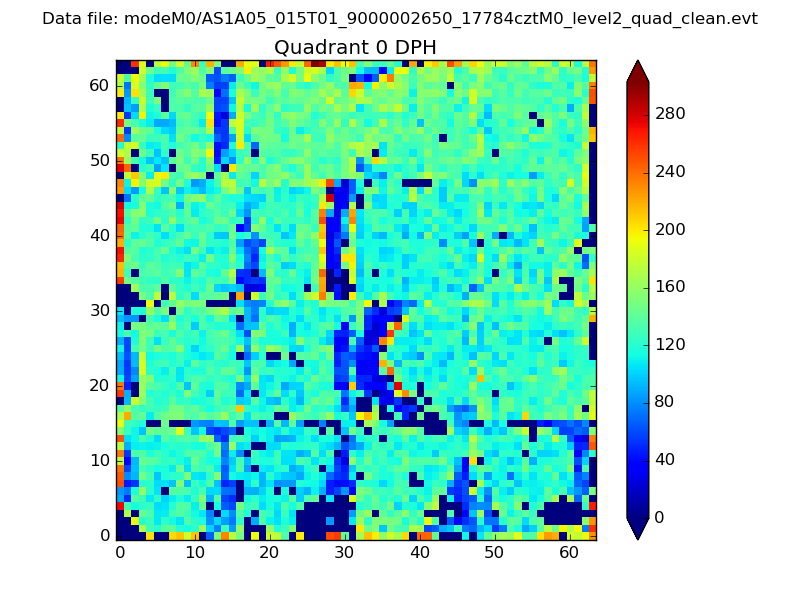 |
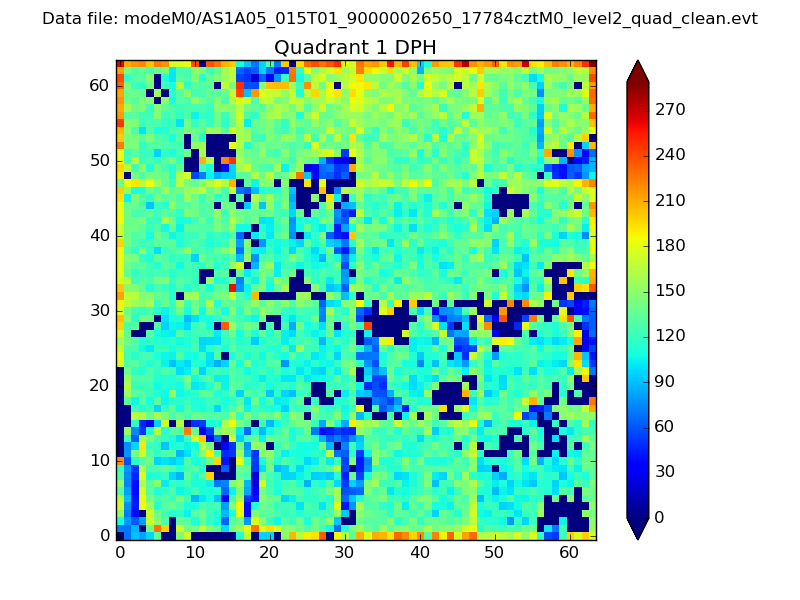 |
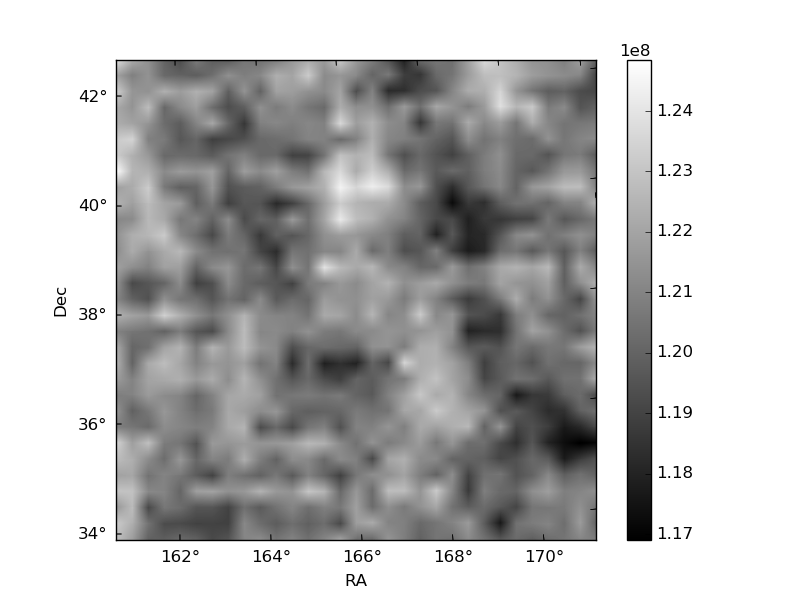
Quadrant B |
|---|---|---|---|
| Quadrant D | 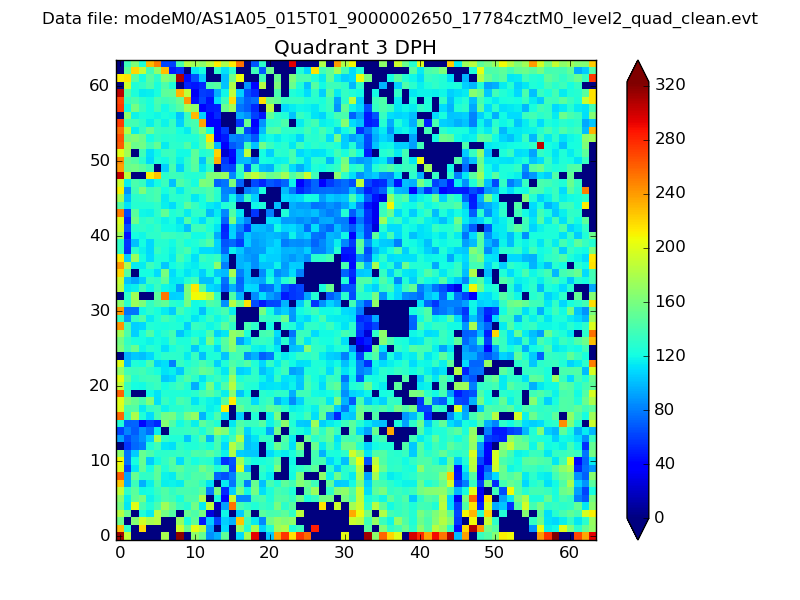 |
 |
Quadrant C |
| Plot type | Count rate plots | Images |
|---|---|---|
| Comparison with Poisson distribution Blue bars denote a histogram of data divided into 1 sec bins. Red curve is a Poisson curve with rate = median count rate of data. |
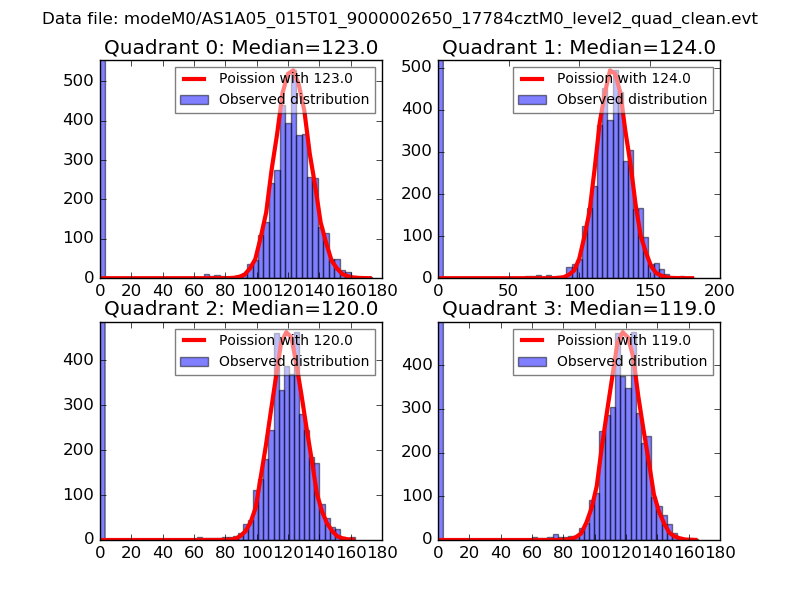 |
 |
| Quadrant-wise count rates Data is divided into 100 sec bins |
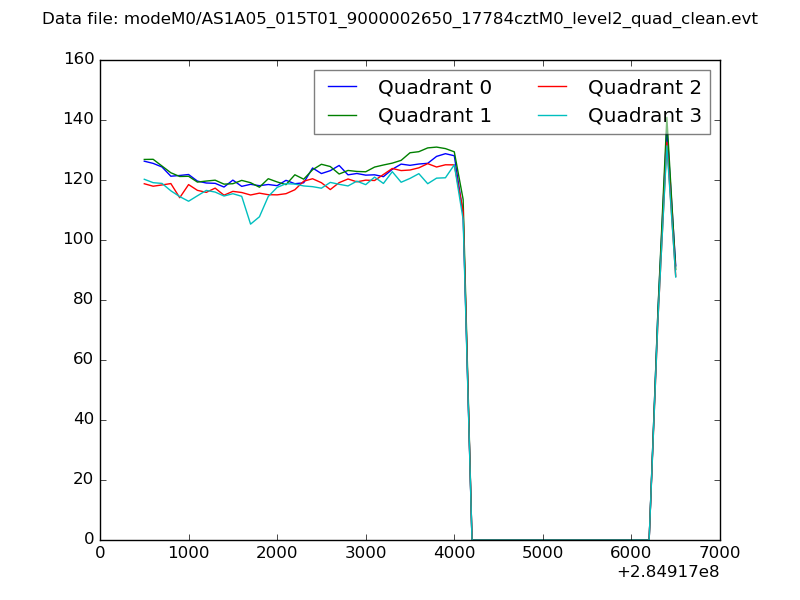 |
|
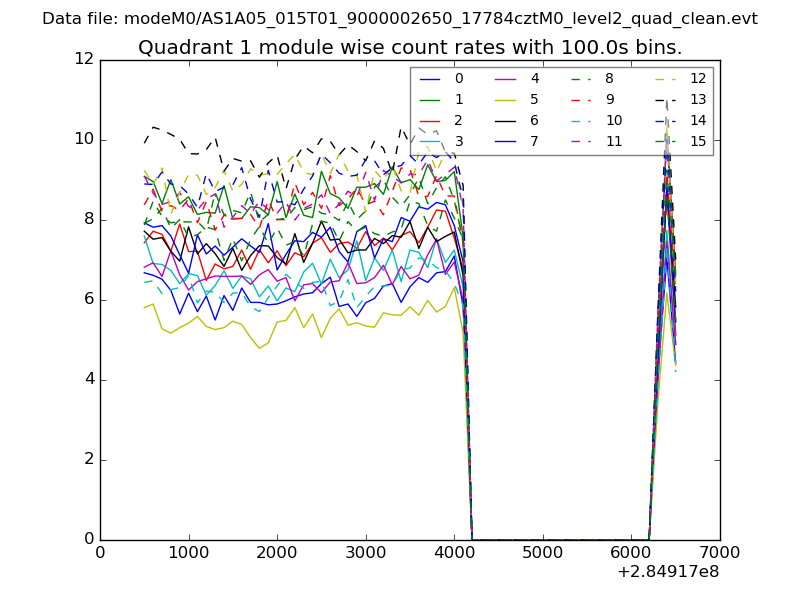
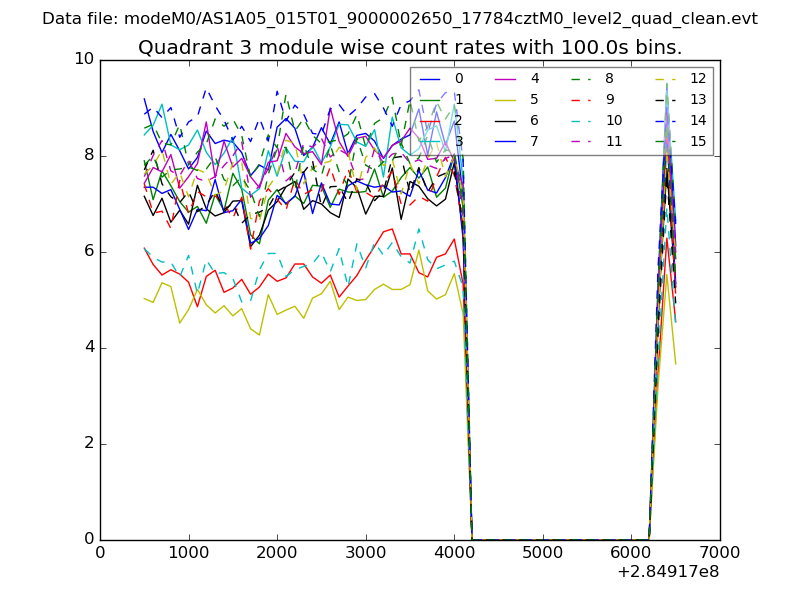
| Module-wise count rates for Quadrant A Data is divided into 100 sec bins |
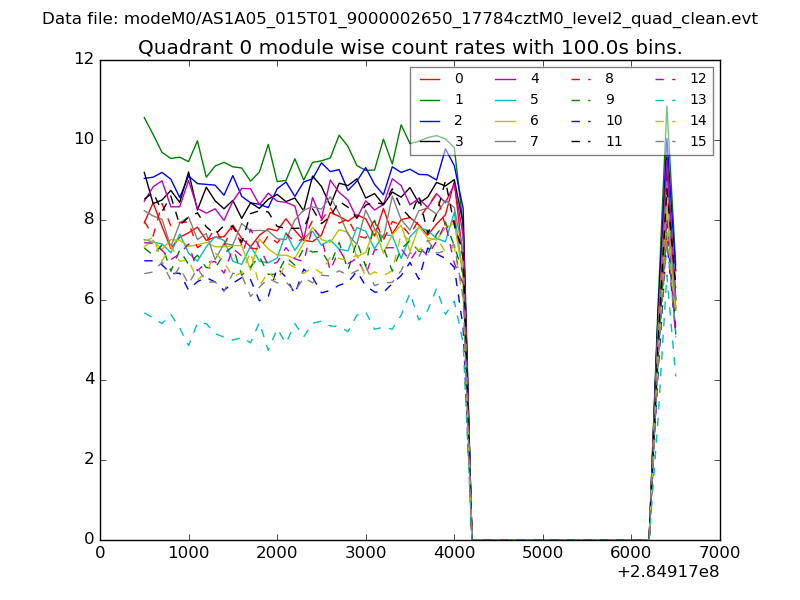 |
 |
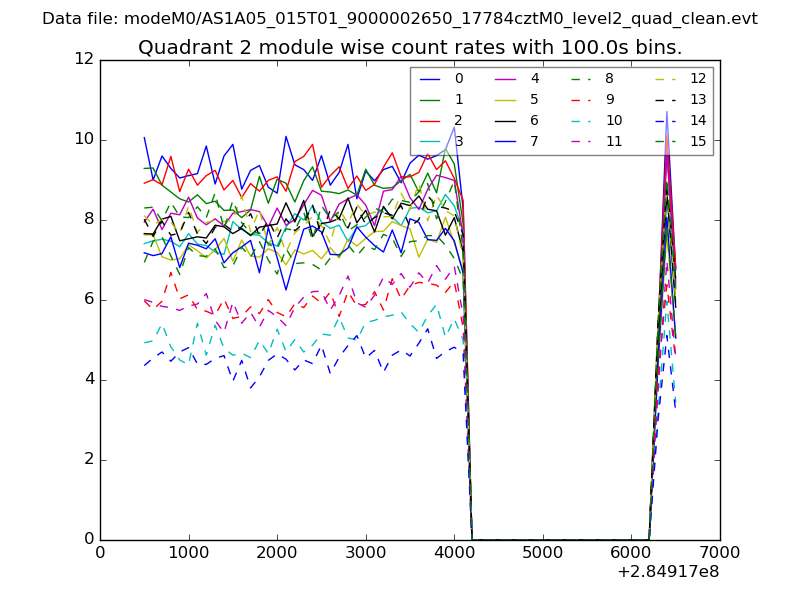
| Module-wise count rates for Quadrant B Data is divided into 100 sec bins |
 |
 |
| Module-wise count rates for Quadrant C Data is divided into 100 sec bins |
 |
 |
| Module-wise count rates for Quadrant D Data is divided into 100 sec bins |
 |
 |
| Parameter | Plot |
|---|---|
| CZT HV Monitor | 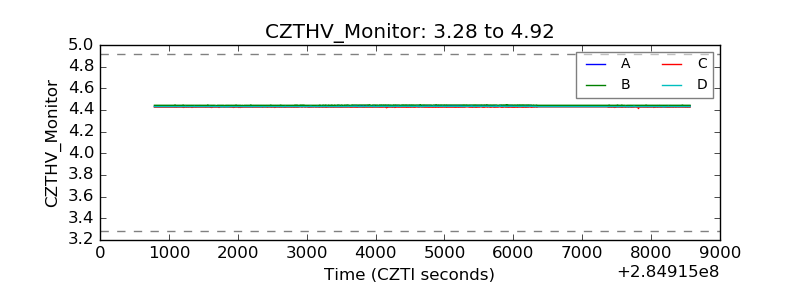 |
| D_VDD | 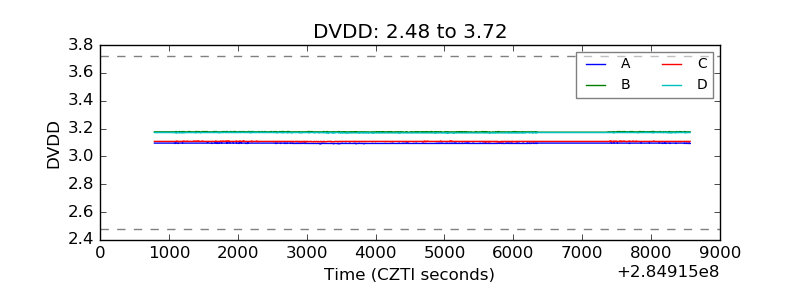 |
| Temperature 1 |  |
| Veto HV Monitor | 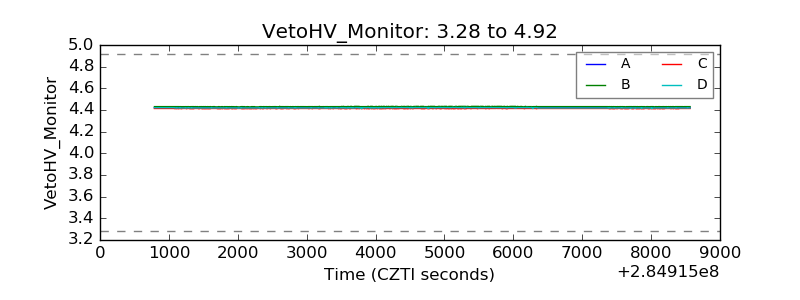 |
| Veto LLD | 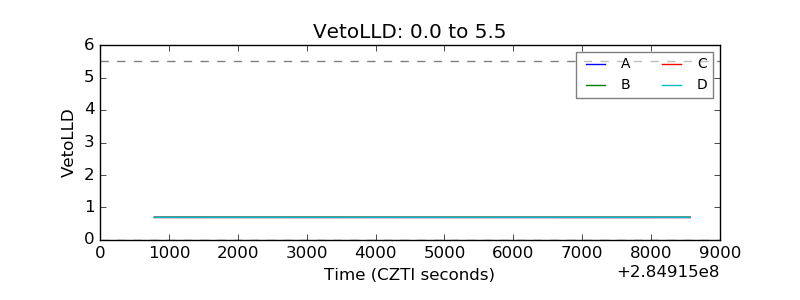 |
| Alpha Counter | 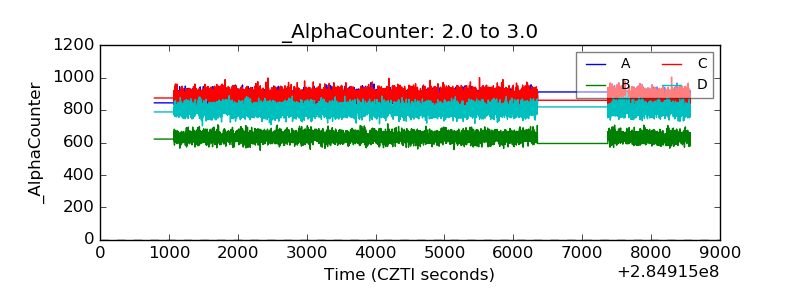 |
| _CPM_Rate | 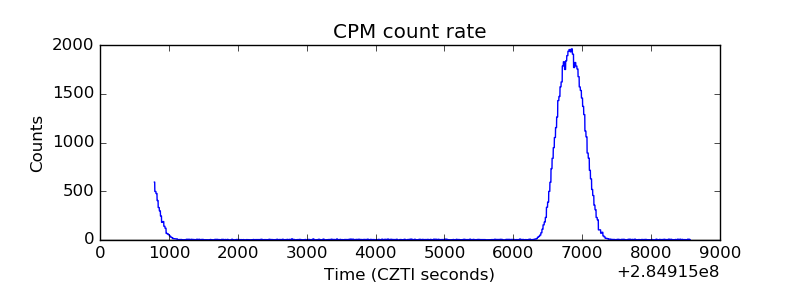 |
| CZT Counter | 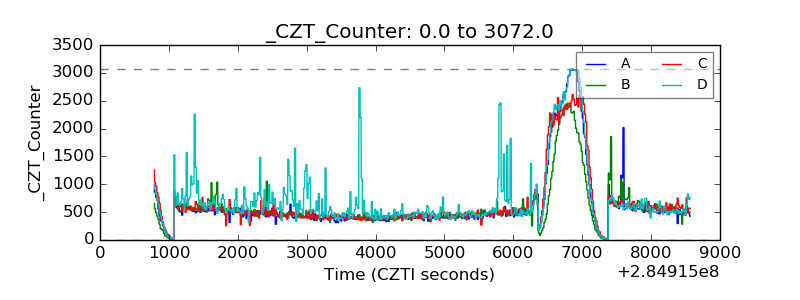 |
| +2.5 Volts monitor |  |
| +5 Volts monitor |  |
| _ROLL_ROT | 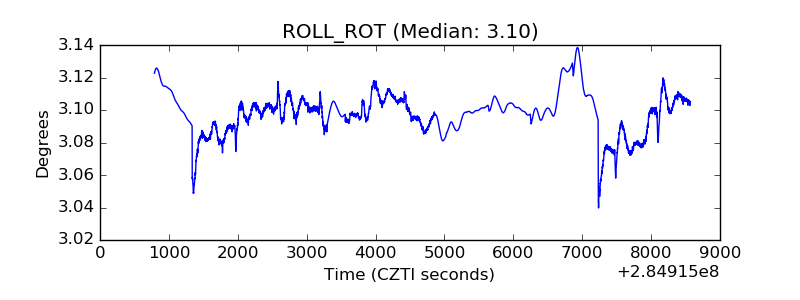 |
| _Roll_DEC | 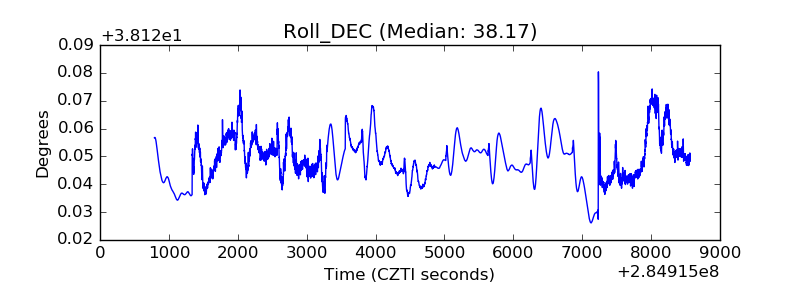 |
| _Roll_RA | 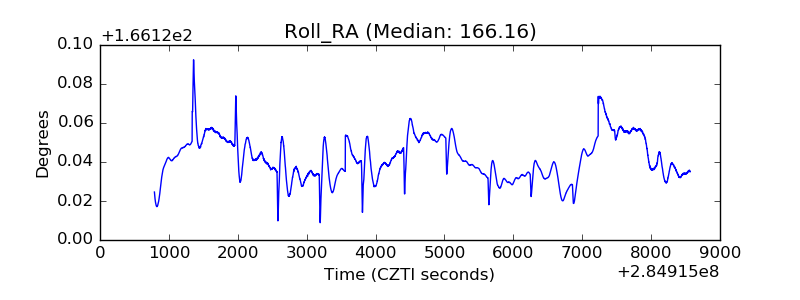 |
| Veto Counter |  |