| Param | Original file | Final file |
|---|---|---|
| Filename | modeM0/AS1A05_015T01_9000002650_17789cztM0_level2.evt | modeM0/AS1A05_015T01_9000002650_17789cztM0_level2_quad_clean.evt |
| Size (bytes) | 472,150,080 | 109,169,280 |
| Size | 450.3 MB | 104.1 MB |
| Events in quadrant A | 3,140,067 | 721,891 |
| Events in quadrant B | 3,234,738 | 752,474 |
| Events in quadrant C | 3,233,535 | 710,205 |
| Events in quadrant D | 4,257,449 | 676,398 |
| Mode SS | |||
|---|---|---|---|
| Quadrant | BADHDUFLAG | Total packets | Discarded packets |
| A | 0 | 132 | 0 |
| B | 0 | 132 | 0 |
| C | 0 | 132 | 0 |
| D | 0 | 132 | 0 |
| Mode M9 | |||
|---|---|---|---|
| Quadrant | BADHDUFLAG | Total packets | Discarded packets |
| A | 0 | 20 | 0 |
| B | 0 | 21 | 0 |
| C | 0 | 21 | 0 |
| D | 0 | 21 | 0 |
| Mode M0 | |||
|---|---|---|---|
| Quadrant | BADHDUFLAG | Total packets | Discarded packets |
| A | 0 | 13400 | 2 |
| B | 0 | 13647 | 2 |
| C | 0 | 13581 | 3 |
| D | 0 | 16921 | 2 |
| Quadrant | Total seconds | Saturated seconds | Saturation percentage |
|---|---|---|---|
| A | 6375 | 42 | 0.658824% |
| B | 6375 | 36 | 0.564706% |
| C | 6374 | 73 | 1.145278% |
| D | 6374 | 177 | 2.776906% |
Noise dominated data is calculated using 1-second bins in cleaned event files. If a bin has >2000 counts, and if more than 50% of those come from <1% of pixels, then it is considered to be noise-dominated and hence unusable.
| Quadrant | # 1 sec bins | Bins with >0 counts | Bins with >2000 counts | High rate bins dominated by noise | Noise dominated (total time) | Noise dominated (detector-on time) | Marked lightcurve |
|---|---|---|---|---|---|---|---|
| A | 7745 | 6376 | 7 | 7 | 0.09% | 0.11% |  |
| B | 7745 | 6376 | 0 | 0 | 0.00% | 0.00% |  |
| C | 7744 | 6375 | 0 | 0 | 0.00% | 0.00% | 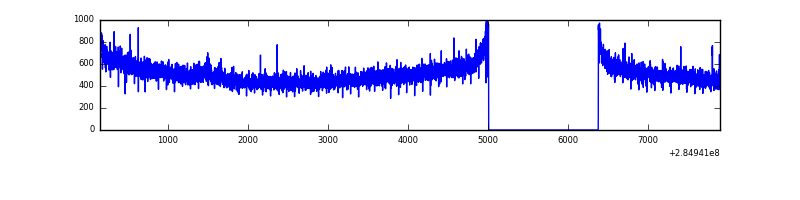 |
| D | 7744 | 6375 | 156 | 156 | 2.01% | 2.45% | 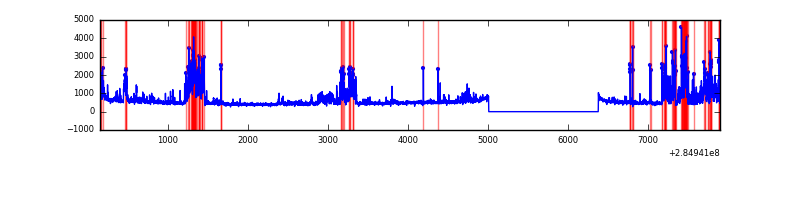 |
Top three noisy pixels from each quadrant. If the there are fewer than three noisy pixels in the level2.evt file, extra rows are filled as -1
| Pixel properties | Quadrant properties | ||||||
|---|---|---|---|---|---|---|---|
| Quadrant | DetID | PixID | Counts | Sigma | Mean | Median | Sigma |
| A | 15 | 174 | 36369 | 219.32 | 807 | 795 | 162.2 |
| A | 0 | 226 | 7296 | 40.08 | 807 | 795 | 162.2 |
| A | 12 | 194 | 5725 | 30.39 | 807 | 795 | 162.2 |
| B | 12 | 111 | 17720 | 111.75 | 819 | 802 | 151.4 |
| B | 11 | 111 | 15140 | 94.71 | 819 | 802 | 151.4 |
| B | 14 | 111 | 13131 | 81.44 | 819 | 802 | 151.4 |
| C | 14 | 238 | 122485 | 671.89 | 783 | 791 | 181.1 |
| C | 3 | 233 | 32143 | 173.1 | 783 | 791 | 181.1 |
| C | 5 | 218 | 19844 | 105.2 | 783 | 791 | 181.1 |
| D | 7 | 238 | 1228339 | 6618.29 | 771 | 754 | 185.5 |
| D | 10 | 70 | 45568 | 241.61 | 771 | 754 | 185.5 |
| D | 12 | 110 | 27017 | 141.59 | 771 | 754 | 185.5 |
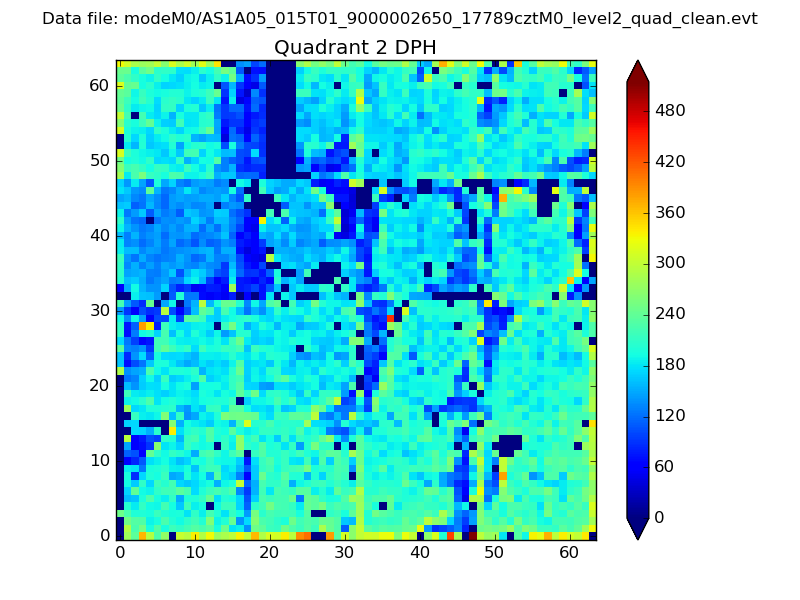
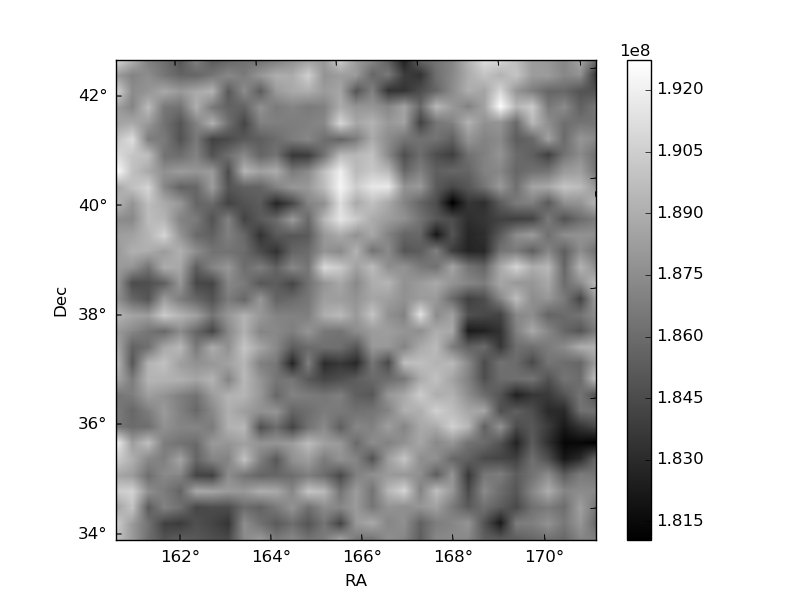
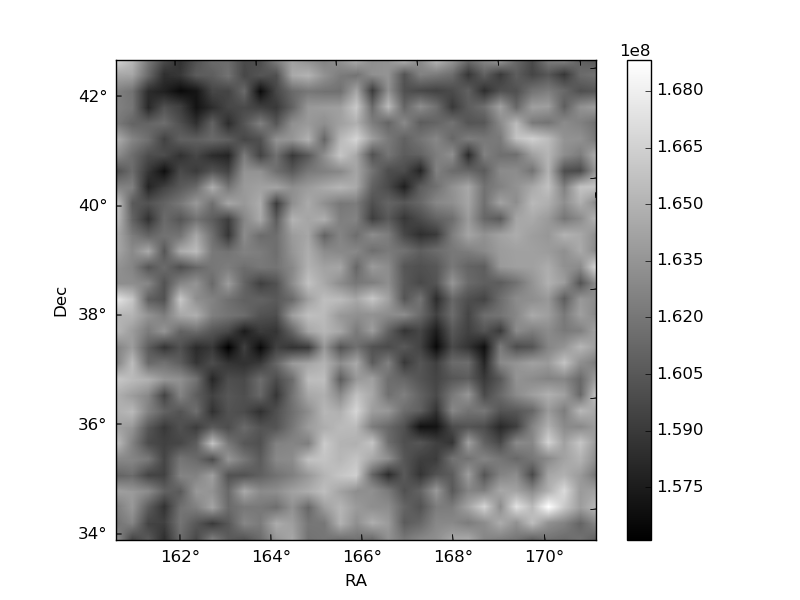
Histogram calculated using DETX and DETY for each event in the final _common_clean file
| Quadrant A | 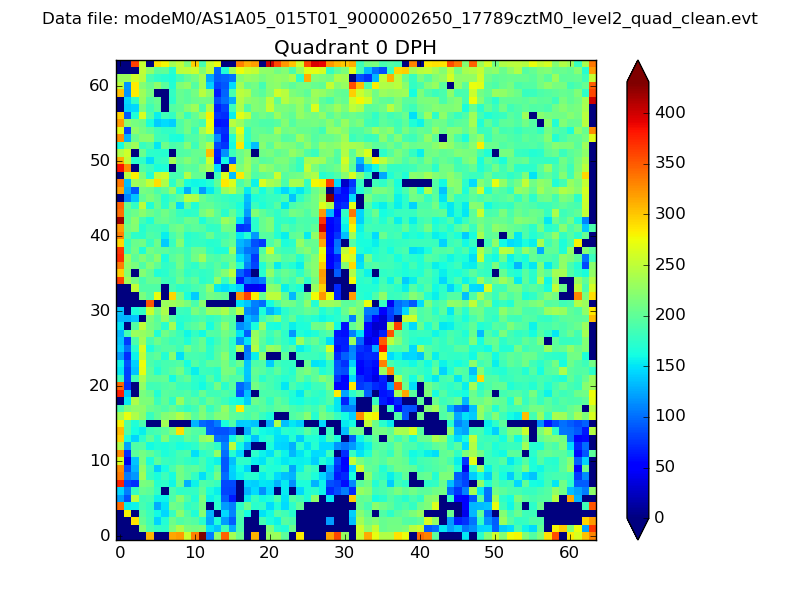 |
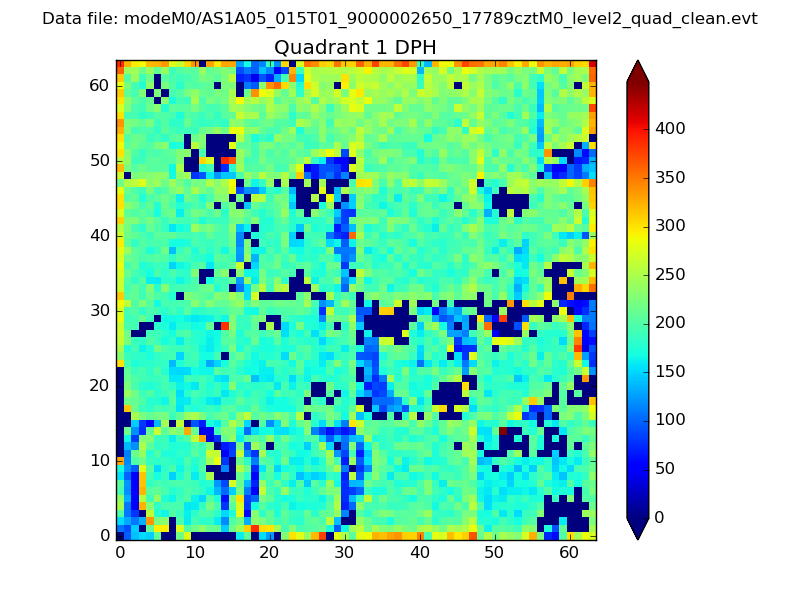 |
Quadrant B |
|---|---|---|---|
| Quadrant D | 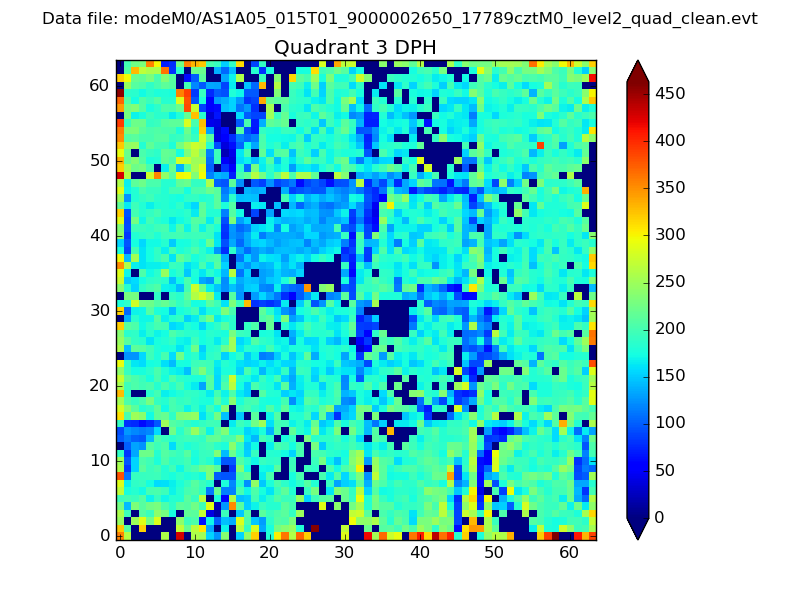 |
 |
Quadrant C |
| Plot type | Count rate plots | Images |
|---|---|---|
| Comparison with Poisson distribution Blue bars denote a histogram of data divided into 1 sec bins. Red curve is a Poisson curve with rate = median count rate of data. |
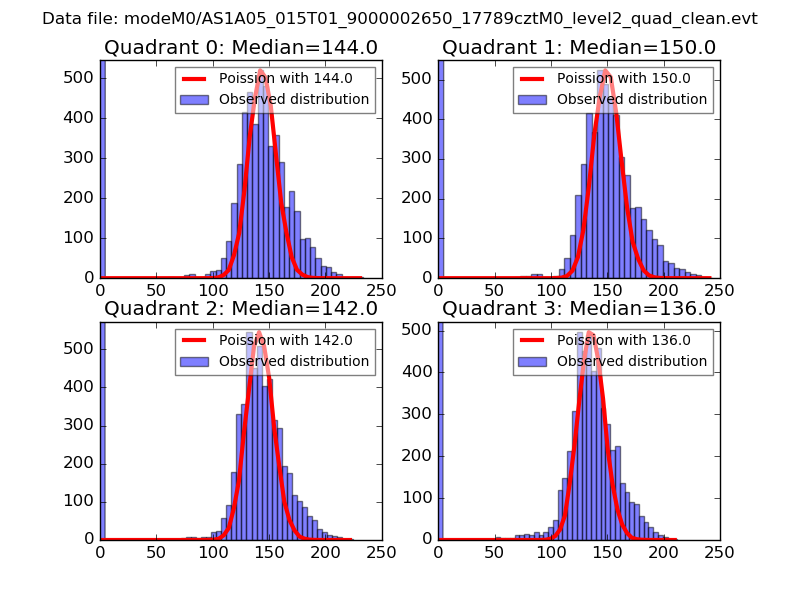 |
 |
| Quadrant-wise count rates Data is divided into 100 sec bins |
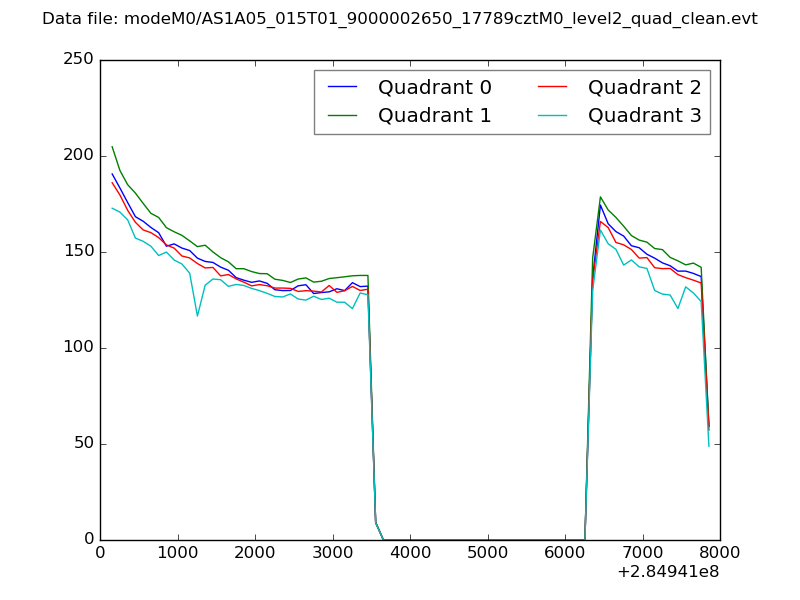 |
|
| Module-wise count rates for Quadrant A Data is divided into 100 sec bins |
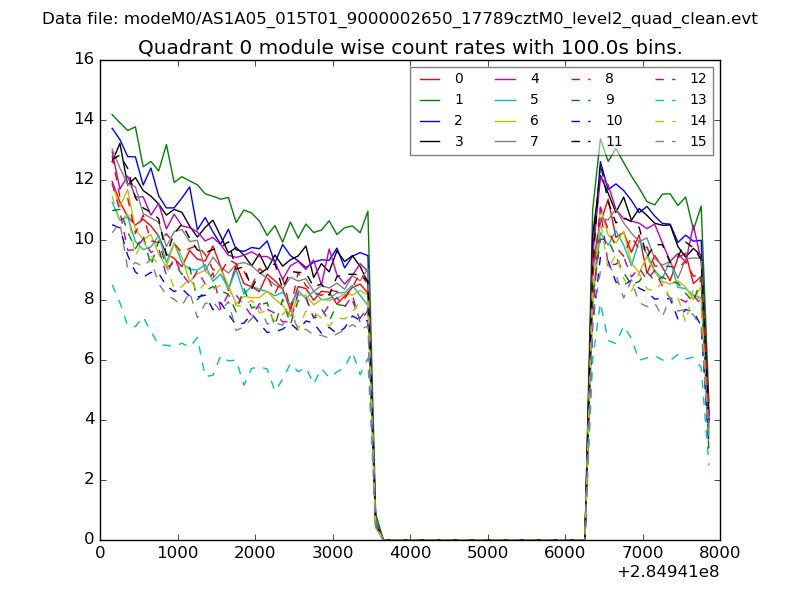 |
 |
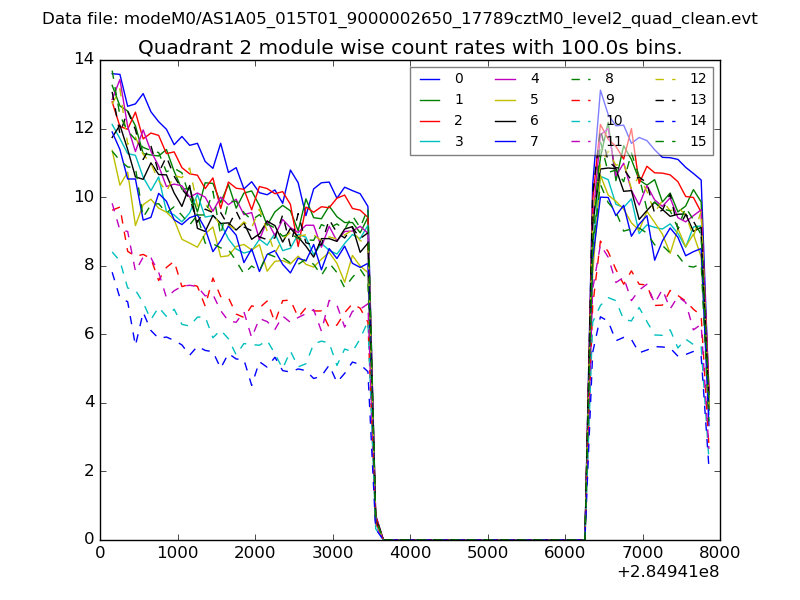
| Module-wise count rates for Quadrant B Data is divided into 100 sec bins |
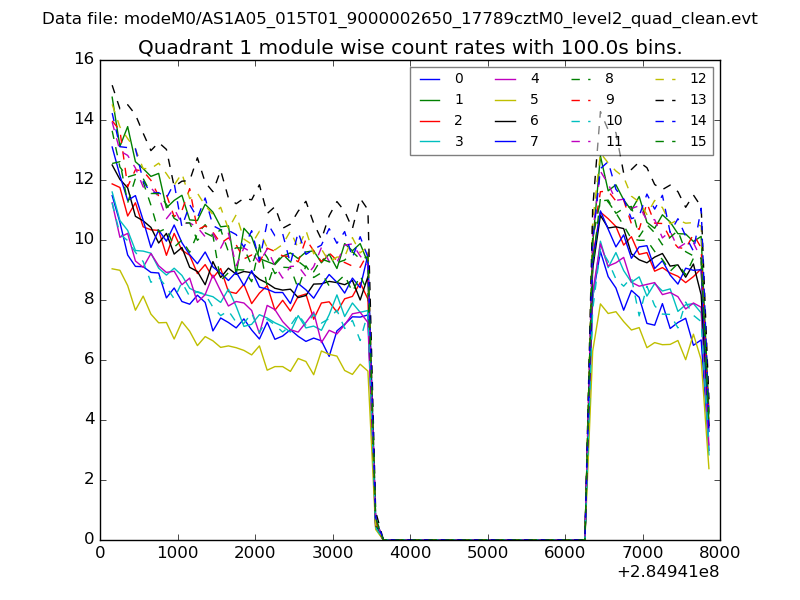 |
 |
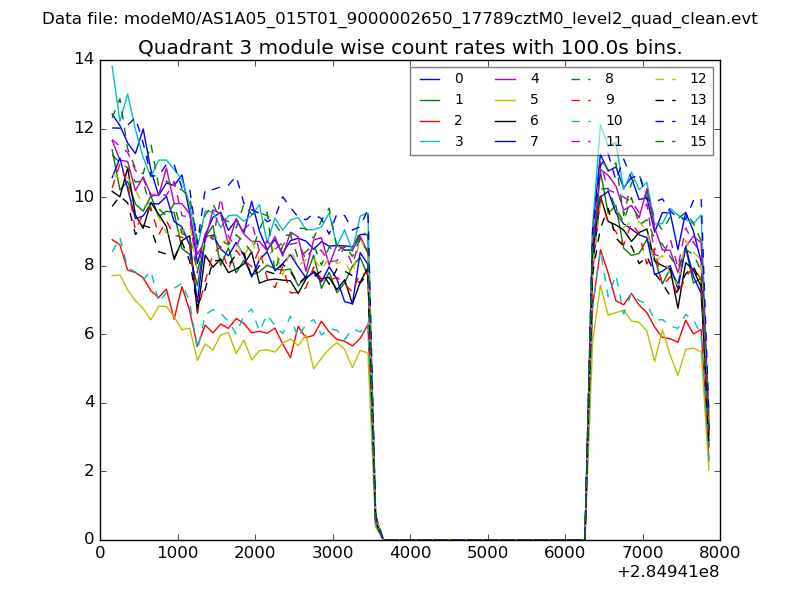
| Module-wise count rates for Quadrant C Data is divided into 100 sec bins |
 |
 |
| Module-wise count rates for Quadrant D Data is divided into 100 sec bins |
 |
 |
| Parameter | Plot |
|---|---|
| CZT HV Monitor | 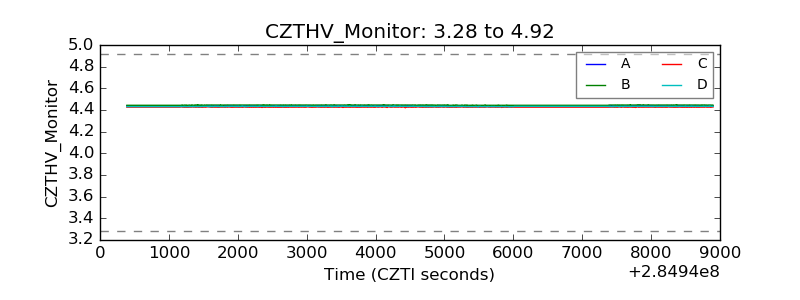 |
| D_VDD | 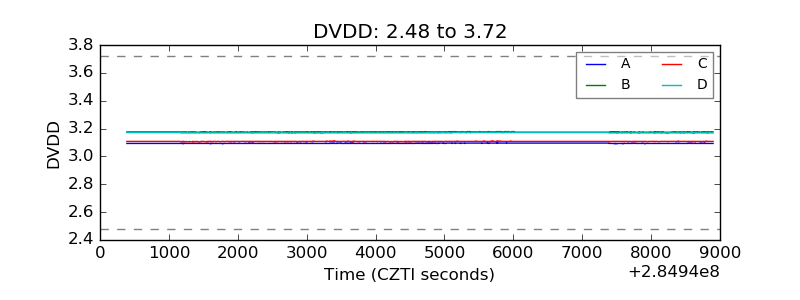 |
| Temperature 1 | 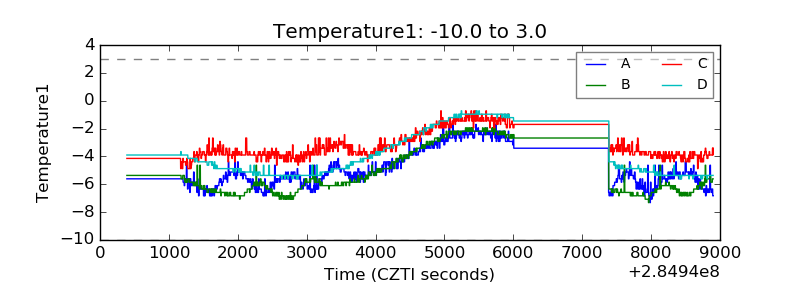 |
| Veto HV Monitor | 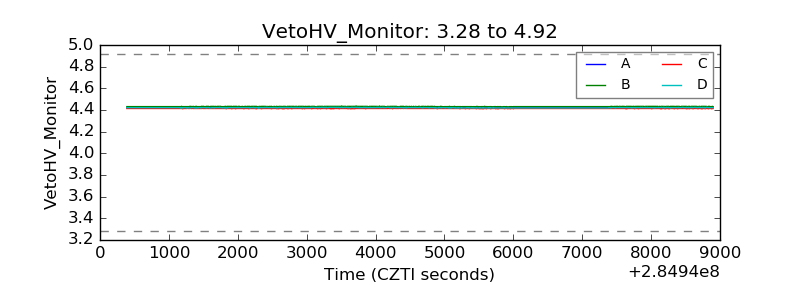 |
| Veto LLD | 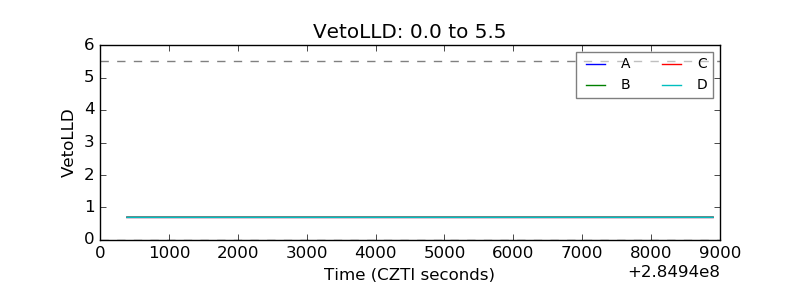 |
| Alpha Counter | 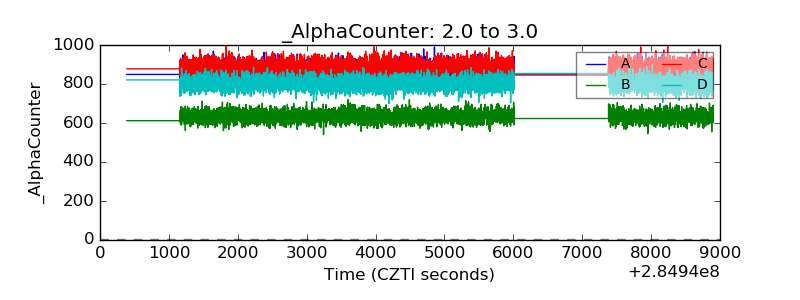 |
| _CPM_Rate | 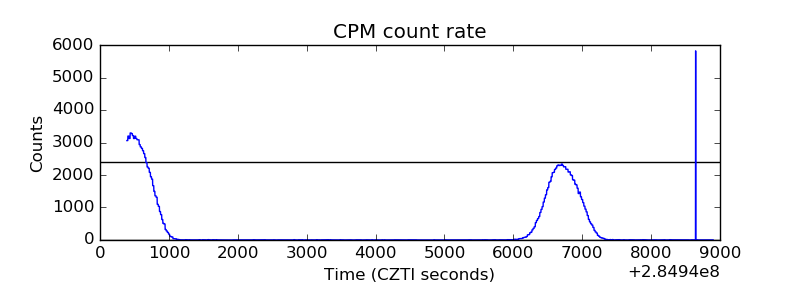 |
| CZT Counter | 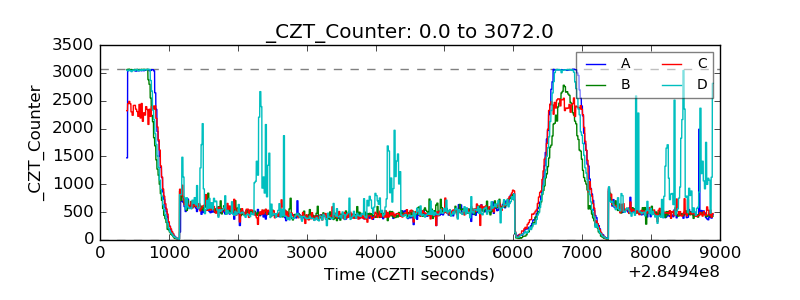 |
| +2.5 Volts monitor |  |
| +5 Volts monitor |  |
| _ROLL_ROT | 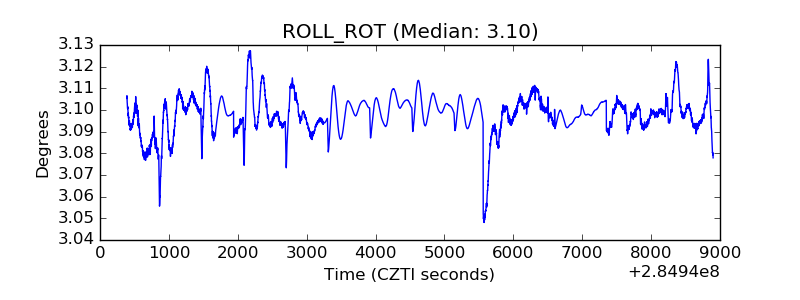 |
| _Roll_DEC | 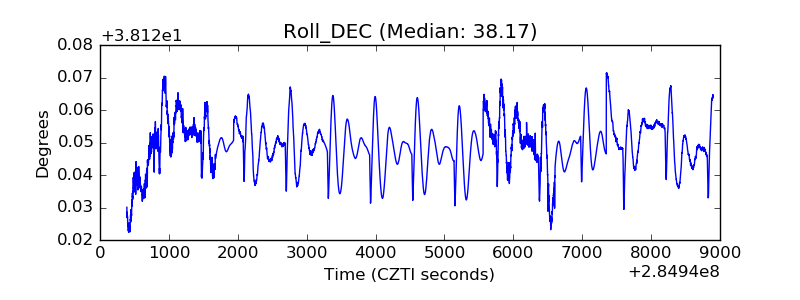 |
| _Roll_RA | 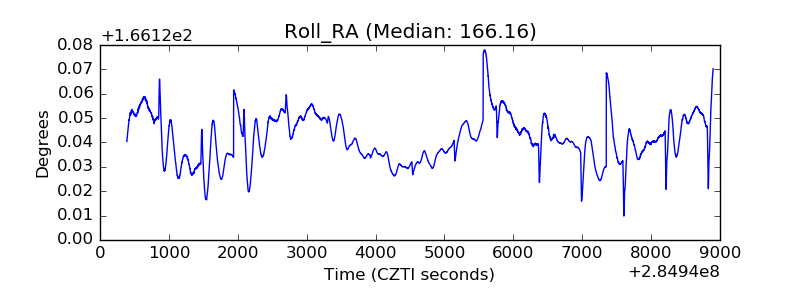 |
| Veto Counter | 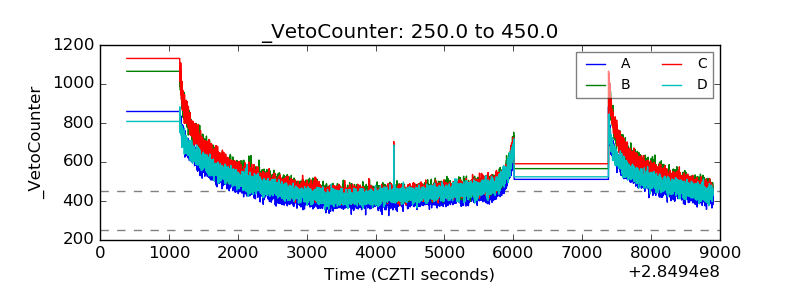 |