| Param | Original file | Final file |
|---|---|---|
| Filename | modeM0/AS1A05_015T01_9000002650_17790cztM0_level2.evt | modeM0/AS1A05_015T01_9000002650_17790cztM0_level2_quad_clean.evt |
| Size (bytes) | 466,966,080 | 100,241,280 |
| Size | 445.3 MB | 95.6 MB |
| Events in quadrant A | 3,187,927 | 651,802 |
| Events in quadrant B | 3,254,924 | 673,327 |
| Events in quadrant C | 3,234,815 | 640,233 |
| Events in quadrant D | 4,019,837 | 613,971 |
| Mode SS | |||
|---|---|---|---|
| Quadrant | BADHDUFLAG | Total packets | Discarded packets |
| A | 0 | 132 | 0 |
| B | 0 | 132 | 0 |
| C | 0 | 132 | 0 |
| D | 0 | 132 | 0 |
| Mode M9 | |||
|---|---|---|---|
| Quadrant | BADHDUFLAG | Total packets | Discarded packets |
| A | 0 | 20 | 0 |
| B | 0 | 21 | 0 |
| C | 0 | 21 | 0 |
| D | 0 | 21 | 0 |
| Mode M0 | |||
|---|---|---|---|
| Quadrant | BADHDUFLAG | Total packets | Discarded packets |
| A | 0 | 13761 | 2 |
| B | 0 | 13838 | 2 |
| C | 0 | 13747 | 2 |
| D | 0 | 16319 | 2 |
| Quadrant | Total seconds | Saturated seconds | Saturation percentage |
|---|---|---|---|
| A | 6548 | 29 | 0.442883% |
| B | 6547 | 28 | 0.427677% |
| C | 6547 | 57 | 0.870628% |
| D | 6547 | 137 | 2.092561% |
Noise dominated data is calculated using 1-second bins in cleaned event files. If a bin has >2000 counts, and if more than 50% of those come from <1% of pixels, then it is considered to be noise-dominated and hence unusable.
| Quadrant | # 1 sec bins | Bins with >0 counts | Bins with >2000 counts | High rate bins dominated by noise | Noise dominated (total time) | Noise dominated (detector-on time) | Marked lightcurve |
|---|---|---|---|---|---|---|---|
| A | 7873 | 6549 | 3 | 3 | 0.04% | 0.05% | 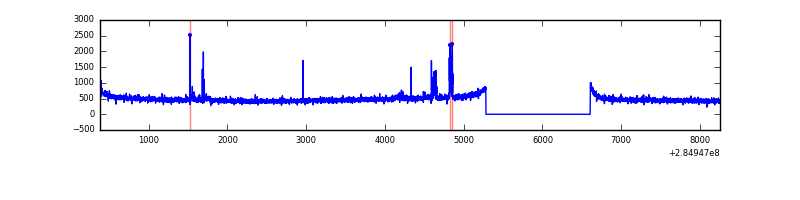 |
| B | 7872 | 6548 | 0 | 0 | 0.00% | 0.00% | 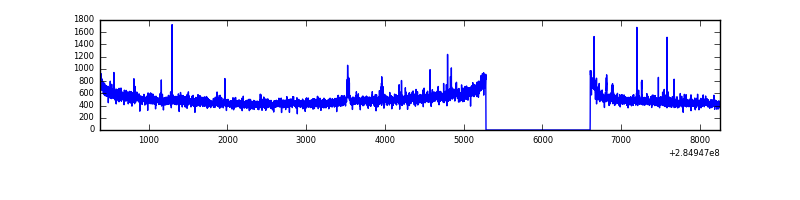 |
| C | 7872 | 6548 | 0 | 0 | 0.00% | 0.00% | 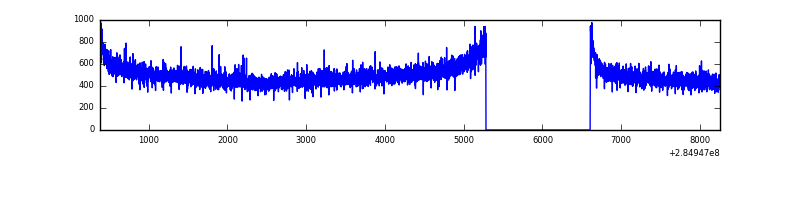 |
| D | 7872 | 6548 | 124 | 124 | 1.58% | 1.89% | 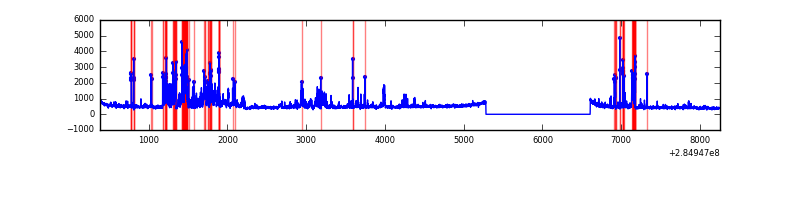 |
Top three noisy pixels from each quadrant. If the there are fewer than three noisy pixels in the level2.evt file, extra rows are filled as -1
| Pixel properties | Quadrant properties | ||||||
|---|---|---|---|---|---|---|---|
| Quadrant | DetID | PixID | Counts | Sigma | Mean | Median | Sigma |
| A | 15 | 174 | 80146 | 486.91 | 807 | 792 | 163.0 |
| A | 0 | 226 | 7262 | 39.7 | 807 | 792 | 163.0 |
| A | 13 | 210 | 5939 | 31.58 | 807 | 792 | 163.0 |
| B | 10 | 245 | 38220 | 243.14 | 817 | 799 | 153.9 |
| B | 12 | 111 | 17688 | 109.74 | 817 | 799 | 153.9 |
| B | 11 | 111 | 15355 | 94.58 | 817 | 799 | 153.9 |
| C | 14 | 238 | 123361 | 679.66 | 776 | 781 | 180.4 |
| C | 3 | 233 | 38167 | 207.29 | 776 | 781 | 180.4 |
| C | 5 | 218 | 30644 | 165.58 | 776 | 781 | 180.4 |
| D | 7 | 238 | 1035100 | 5584.03 | 770 | 753 | 185.2 |
| D | 10 | 70 | 38178 | 202.04 | 770 | 753 | 185.2 |
| D | 2 | 234 | 25456 | 133.36 | 770 | 753 | 185.2 |
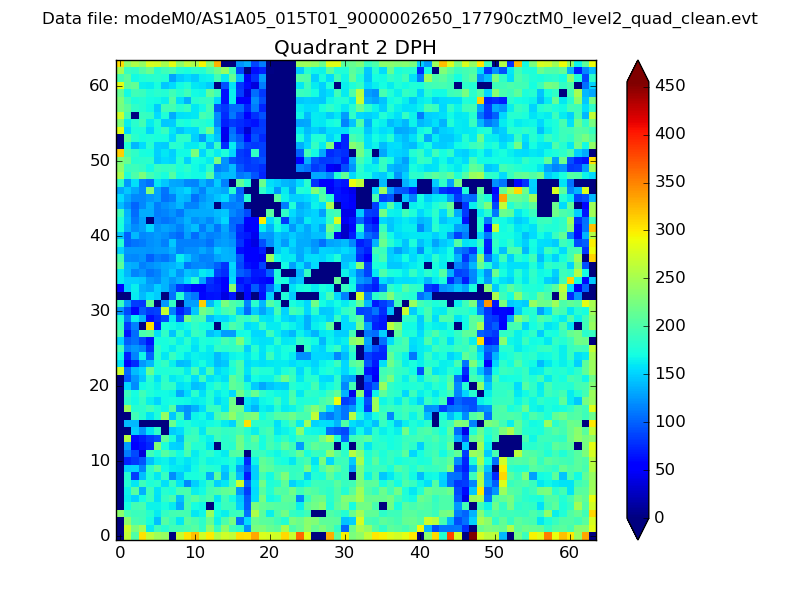
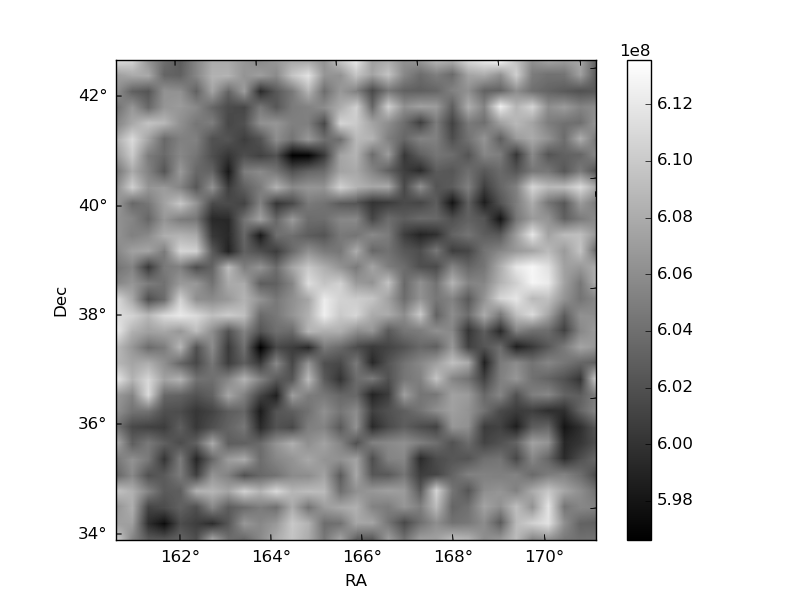
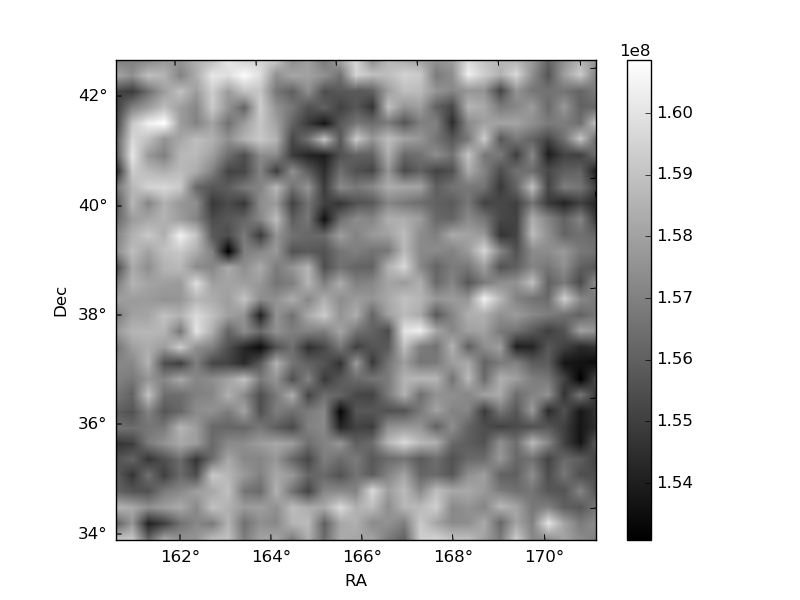
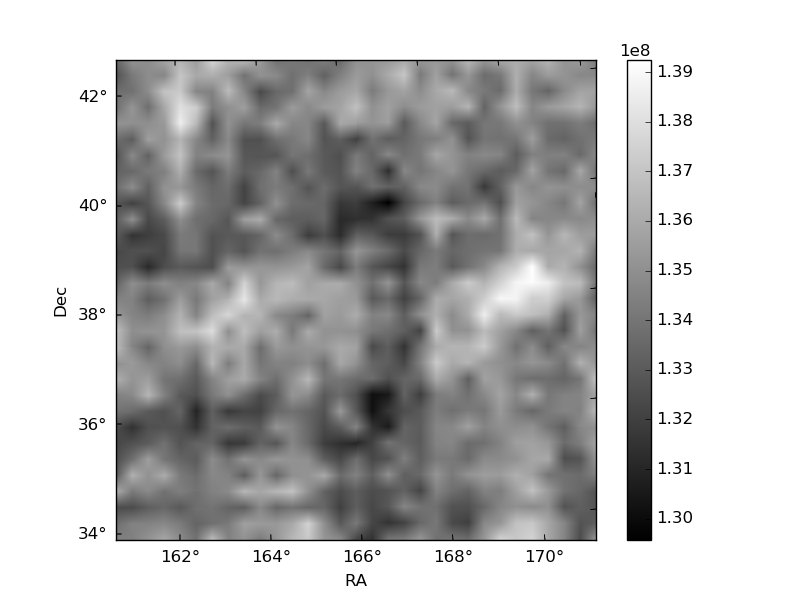
Histogram calculated using DETX and DETY for each event in the final _common_clean file
| Quadrant A | 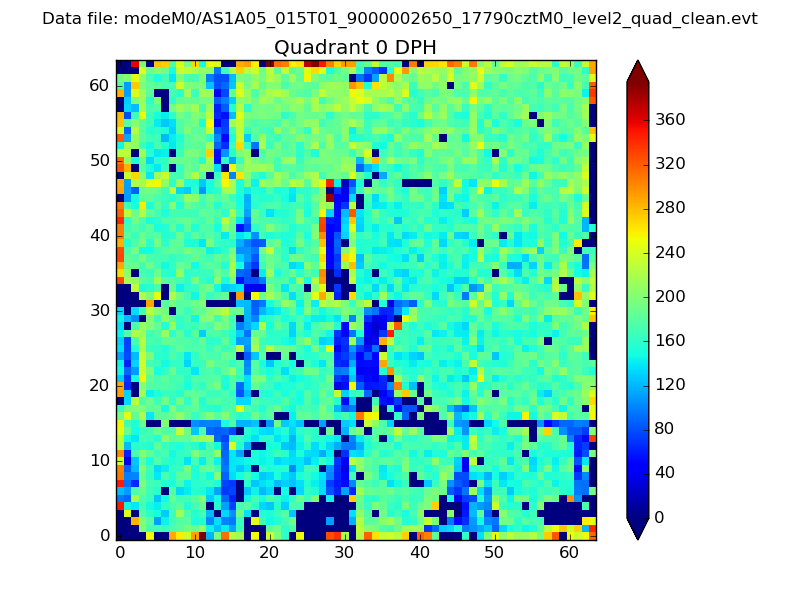 |
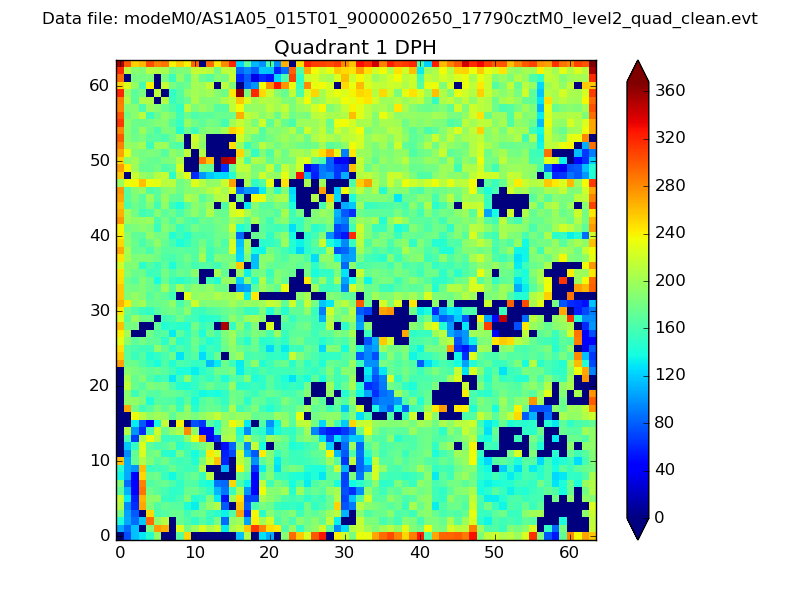 |
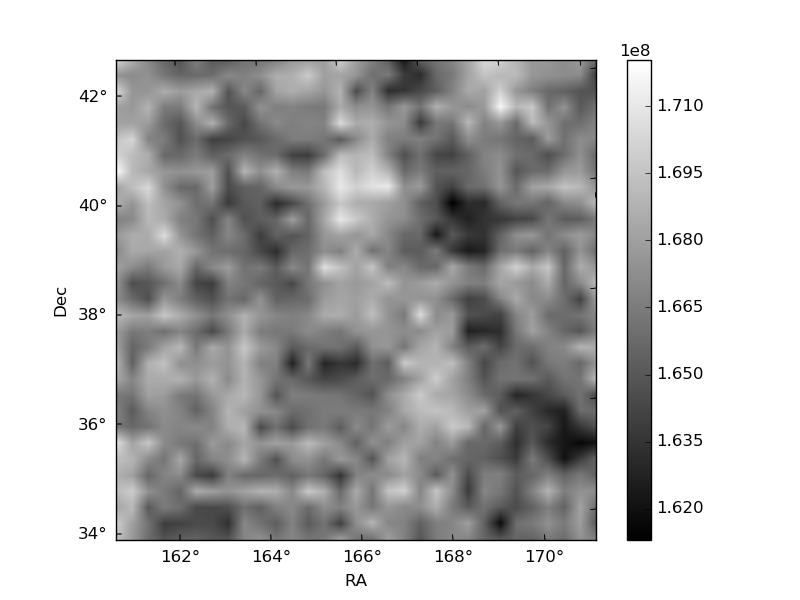
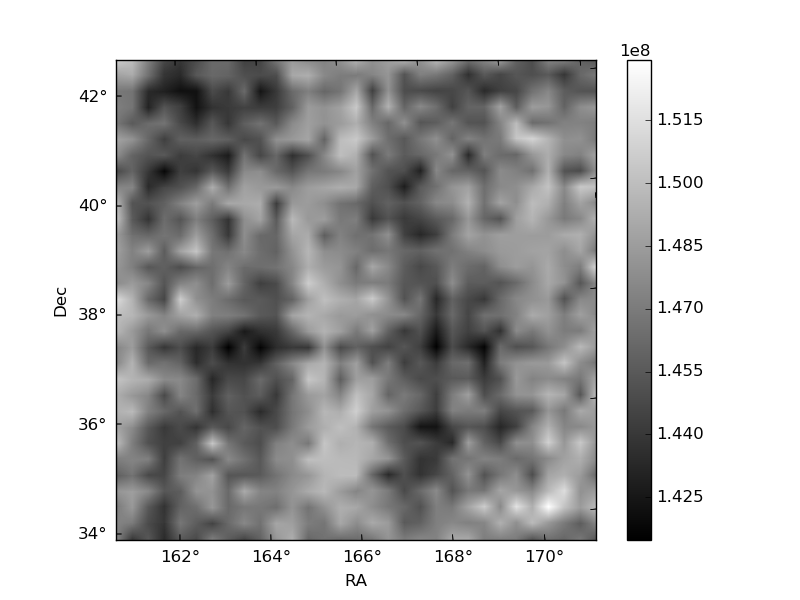
Quadrant B |
|---|---|---|---|
| Quadrant D | 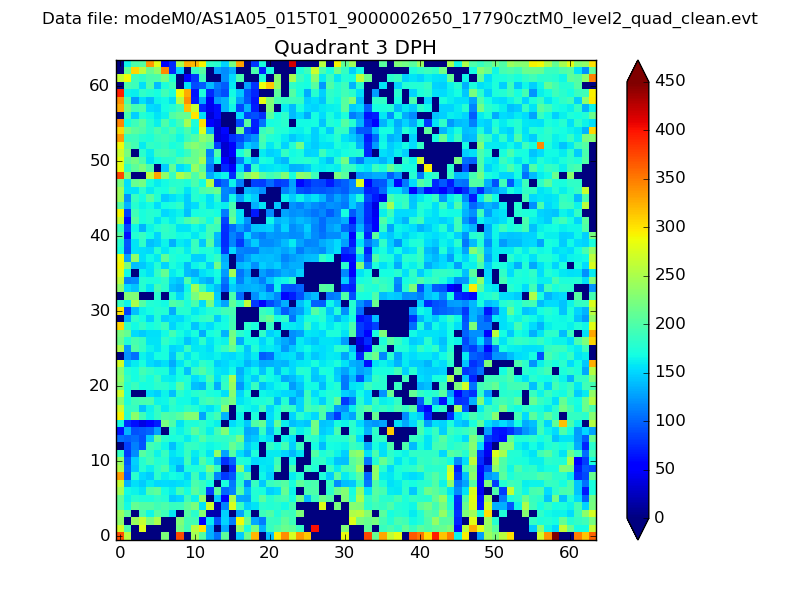 |
 |
Quadrant C |
| Plot type | Count rate plots | Images |
|---|---|---|
| Comparison with Poisson distribution Blue bars denote a histogram of data divided into 1 sec bins. Red curve is a Poisson curve with rate = median count rate of data. |
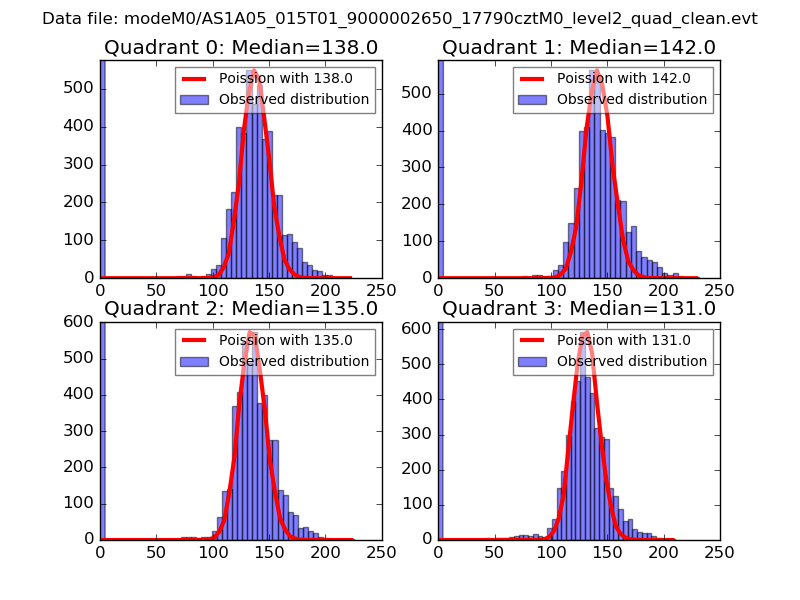 |
 |
| Quadrant-wise count rates Data is divided into 100 sec bins |
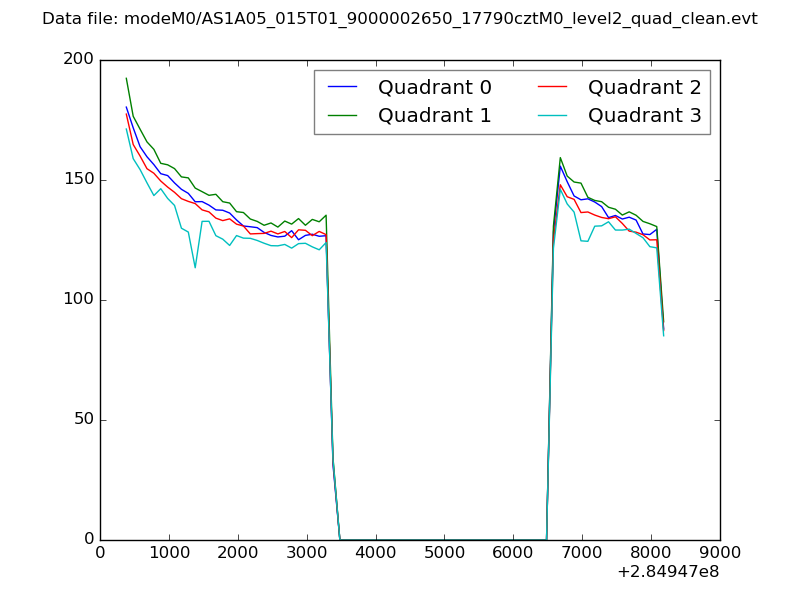 |
|
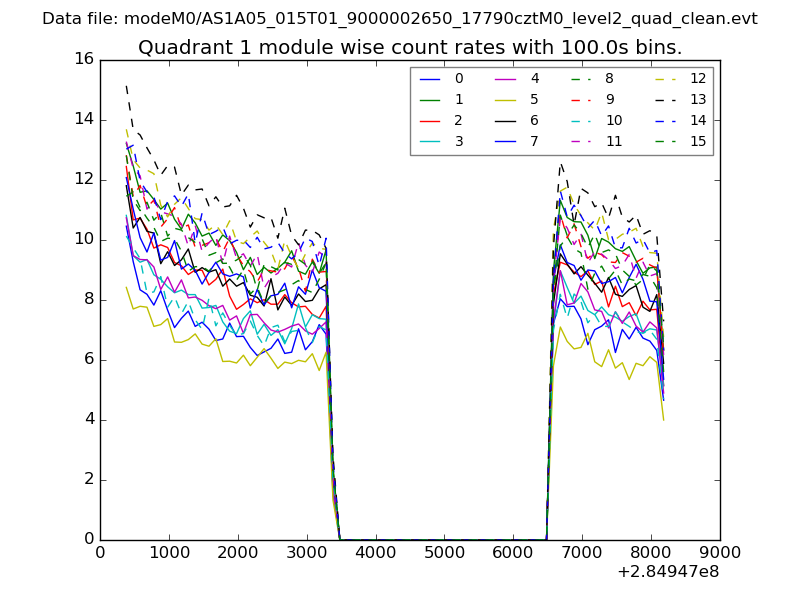
| Module-wise count rates for Quadrant A Data is divided into 100 sec bins |
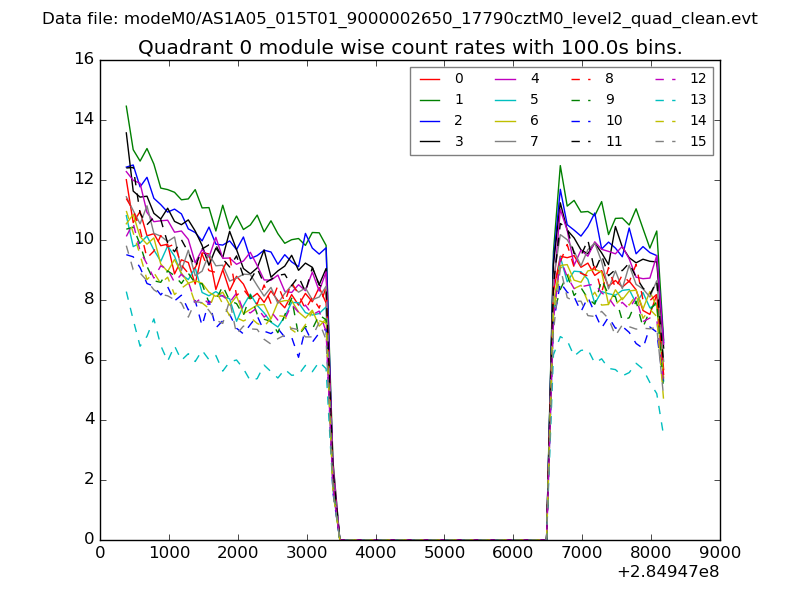 |
 |
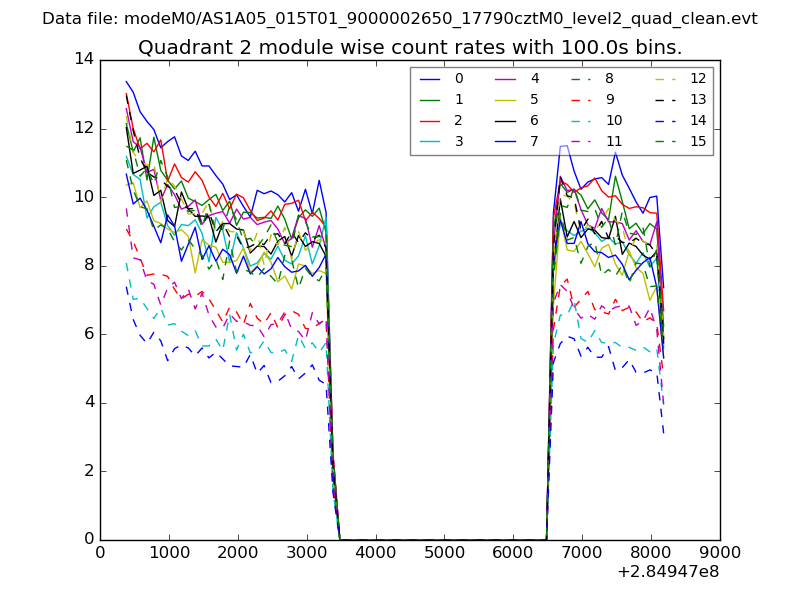
| Module-wise count rates for Quadrant B Data is divided into 100 sec bins |
 |
 |
| Module-wise count rates for Quadrant C Data is divided into 100 sec bins |
 |
 |
| Module-wise count rates for Quadrant D Data is divided into 100 sec bins |
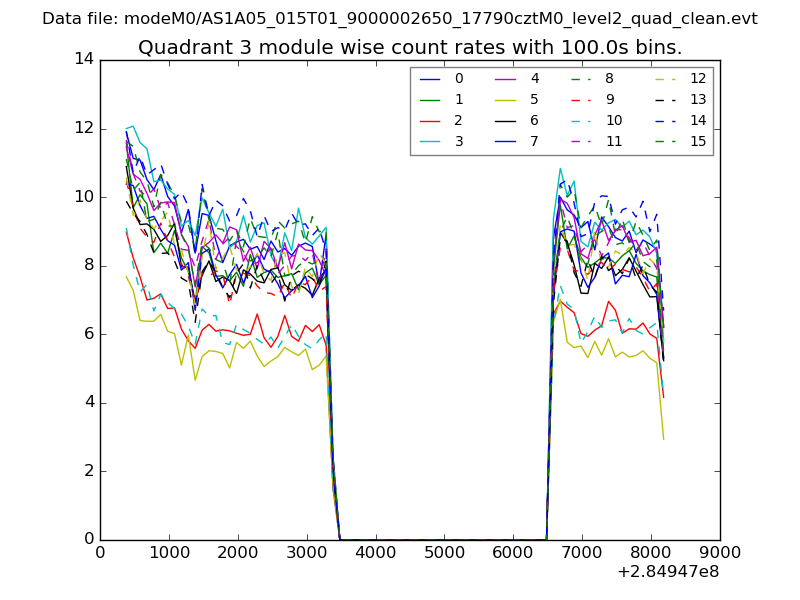 |
 |
| Parameter | Plot |
|---|---|
| CZT HV Monitor | 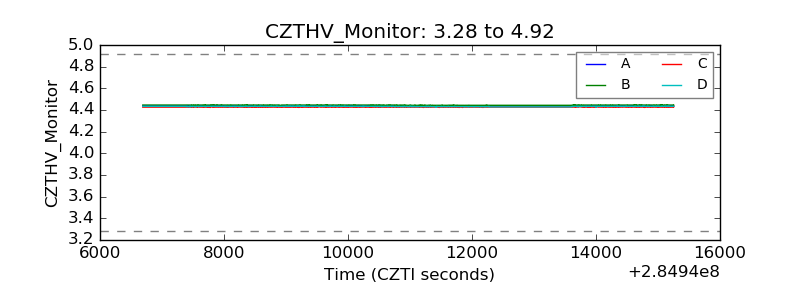 |
| D_VDD | 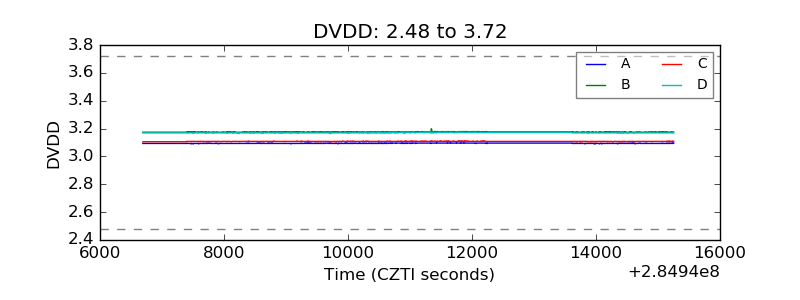 |
| Temperature 1 | 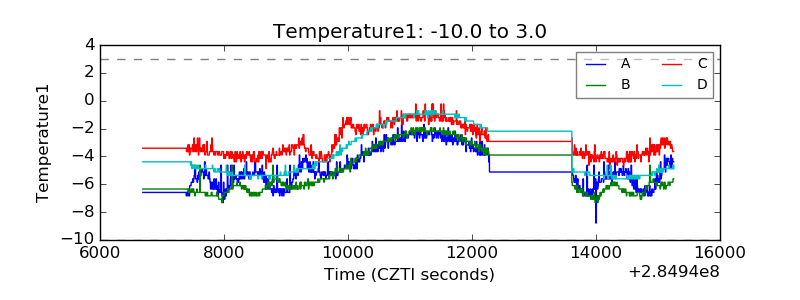 |
| Veto HV Monitor | 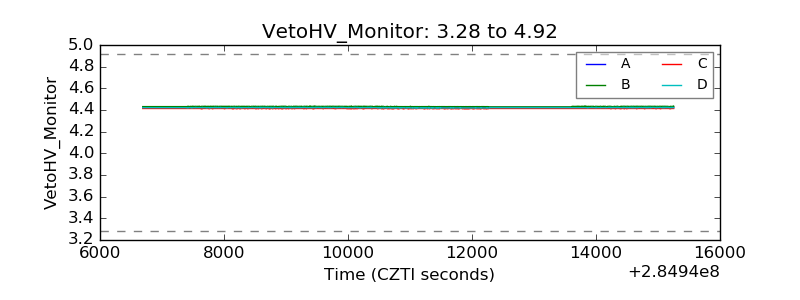 |
| Veto LLD | 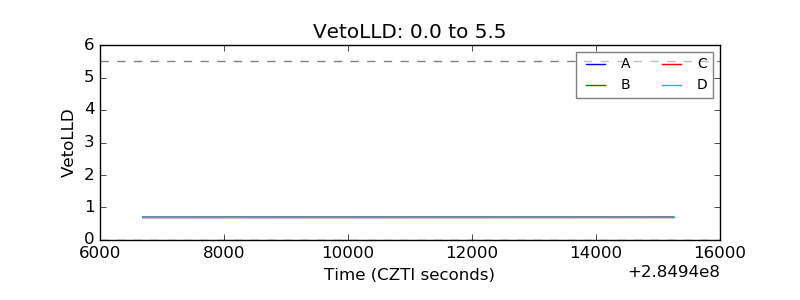 |
| Alpha Counter | 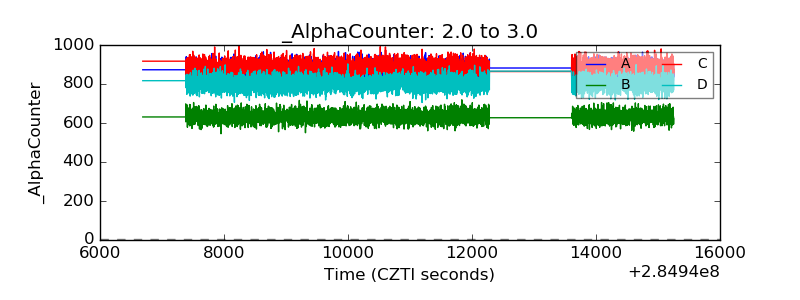 |
| _CPM_Rate | 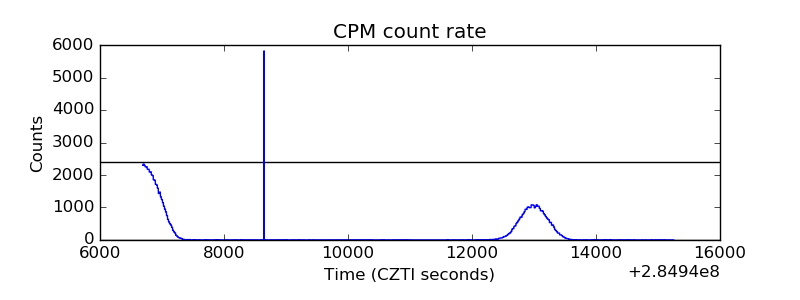 |
| CZT Counter | 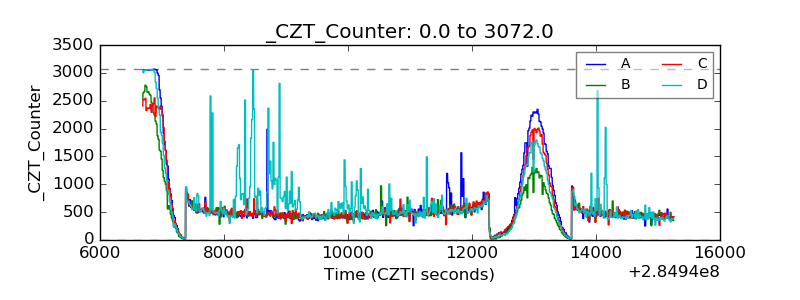 |
| +2.5 Volts monitor |  |
| +5 Volts monitor | 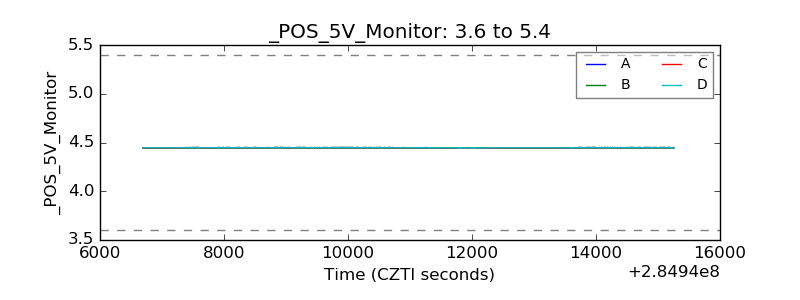 |
| _ROLL_ROT | 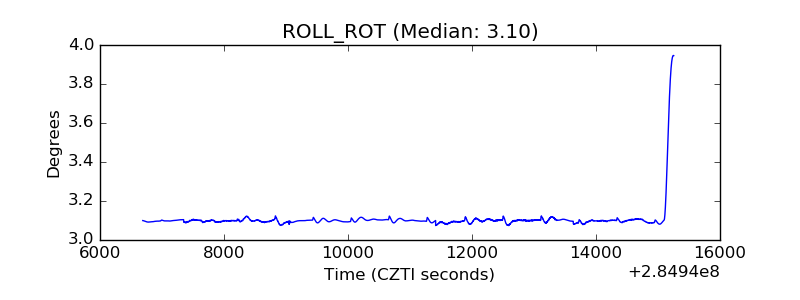 |
| _Roll_DEC | 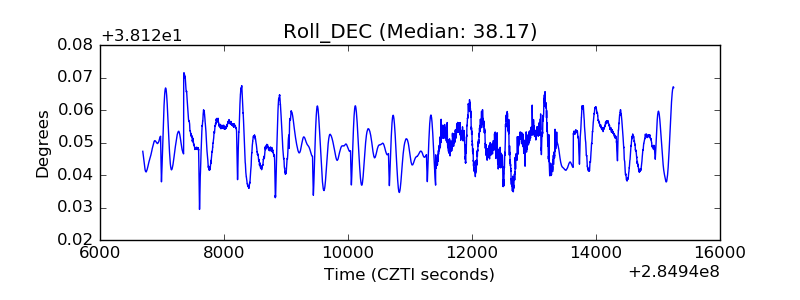 |
| _Roll_RA | 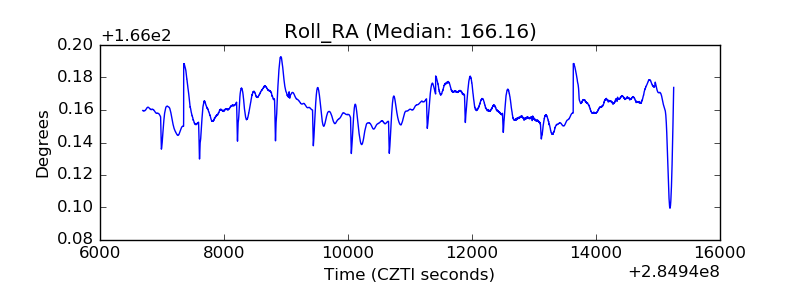 |
| Veto Counter |  |