| Param | Original file | Final file |
|---|---|---|
| Filename | modeM0/AS1A05_015T01_9000002650_17793cztM0_level2.evt | modeM0/AS1A05_015T01_9000002650_17793cztM0_level2_quad_clean.evt |
| Size (bytes) | 469,008,000 | 96,575,040 |
| Size | 447.3 MB | 92.1 MB |
| Events in quadrant A | 3,280,605 | 610,599 |
| Events in quadrant B | 3,446,114 | 625,667 |
| Events in quadrant C | 3,536,734 | 599,768 |
| Events in quadrant D | 3,456,141 | 592,448 |
| Mode SS | |||
|---|---|---|---|
| Quadrant | BADHDUFLAG | Total packets | Discarded packets |
| A | 0 | 144 | 0 |
| B | 0 | 144 | 0 |
| C | 0 | 144 | 0 |
| D | 0 | 144 | 0 |
| Mode M0 | |||
|---|---|---|---|
| Quadrant | BADHDUFLAG | Total packets | Discarded packets |
| A | 0 | 14706 | 2 |
| B | 0 | 14979 | 1 |
| C | 0 | 14947 | 1 |
| D | 0 | 15343 | 1 |
| Quadrant | Total seconds | Saturated seconds | Saturation percentage |
|---|---|---|---|
| A | 7113 | 267 | 3.753690% |
| B | 7114 | 285 | 4.006185% |
| C | 7114 | 257 | 3.612595% |
| D | 7114 | 227 | 3.190891% |
Noise dominated data is calculated using 1-second bins in cleaned event files. If a bin has >2000 counts, and if more than 50% of those come from <1% of pixels, then it is considered to be noise-dominated and hence unusable.
| Quadrant | # 1 sec bins | Bins with >0 counts | Bins with >2000 counts | High rate bins dominated by noise | Noise dominated (total time) | Noise dominated (detector-on time) | Marked lightcurve |
|---|---|---|---|---|---|---|---|
| A | 7128 | 7114 | 0 | 0 | 0.00% | 0.00% | 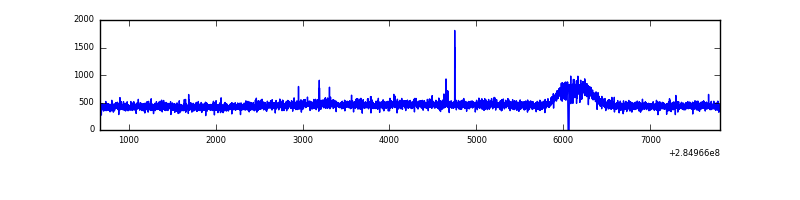 |
| B | 7129 | 7115 | 13 | 13 | 0.18% | 0.18% | 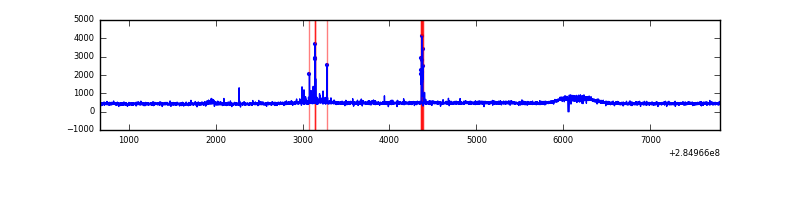 |
| C | 7129 | 7115 | 0 | 0 | 0.00% | 0.00% | 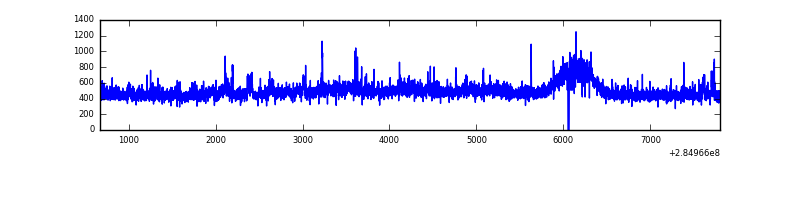 |
| D | 7129 | 7115 | 11 | 11 | 0.15% | 0.15% |  |
Top three noisy pixels from each quadrant. If the there are fewer than three noisy pixels in the level2.evt file, extra rows are filled as -1
| Pixel properties | Quadrant properties | ||||||
|---|---|---|---|---|---|---|---|
| Quadrant | DetID | PixID | Counts | Sigma | Mean | Median | Sigma |
| A | 15 | 174 | 9637 | 50.38 | 851 | 832 | 174.8 |
| A | 0 | 226 | 7380 | 37.47 | 851 | 832 | 174.8 |
| A | 3 | 137 | 6506 | 32.47 | 851 | 832 | 174.8 |
| B | 7 | 220 | 51783 | 309.97 | 849 | 827 | 164.4 |
| B | 6 | 36 | 37873 | 225.36 | 849 | 827 | 164.4 |
| B | 12 | 111 | 19733 | 115.01 | 849 | 827 | 164.4 |
| C | 14 | 238 | 126177 | 654.41 | 812 | 814 | 191.6 |
| C | 9 | 160 | 96172 | 497.78 | 812 | 814 | 191.6 |
| C | 9 | 176 | 69180 | 356.88 | 812 | 814 | 191.6 |
| D | 7 | 238 | 216318 | 1077.88 | 824 | 800 | 199.9 |
| D | 1 | 52 | 59348 | 292.82 | 824 | 800 | 199.9 |
| D | 10 | 70 | 33960 | 165.84 | 824 | 800 | 199.9 |
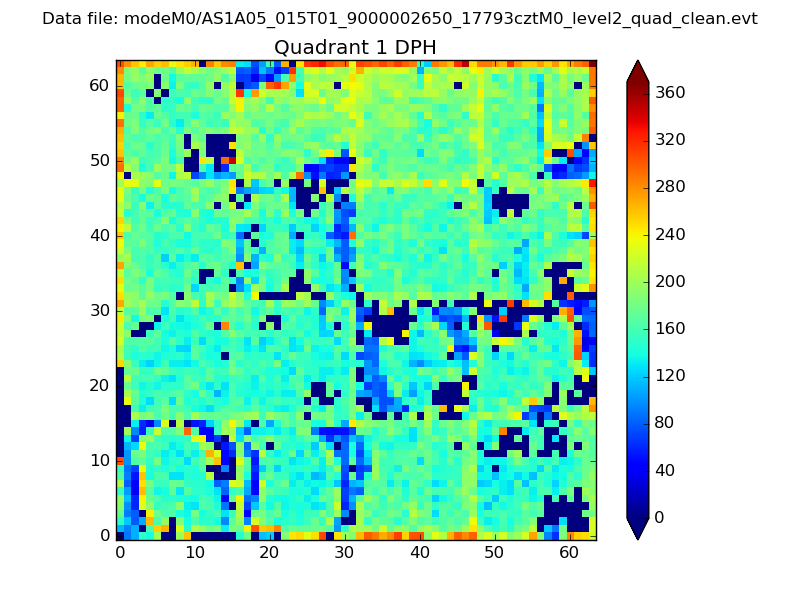
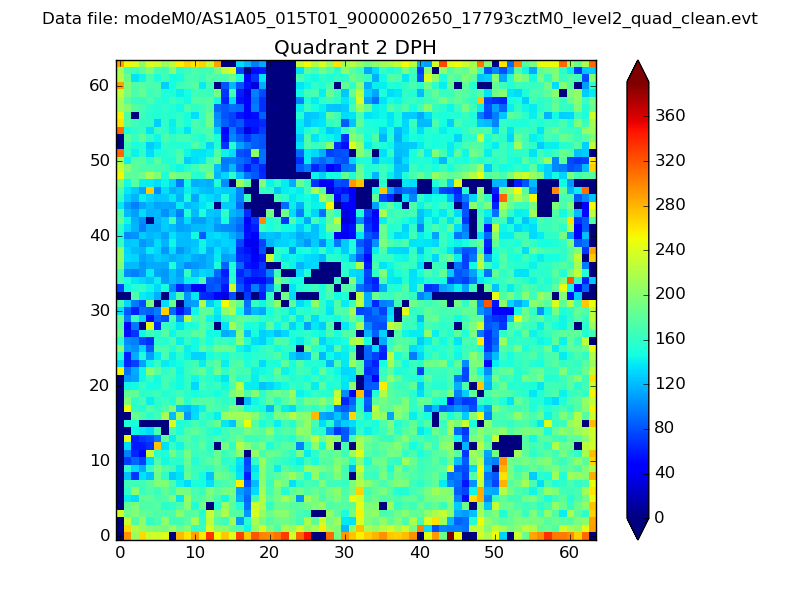
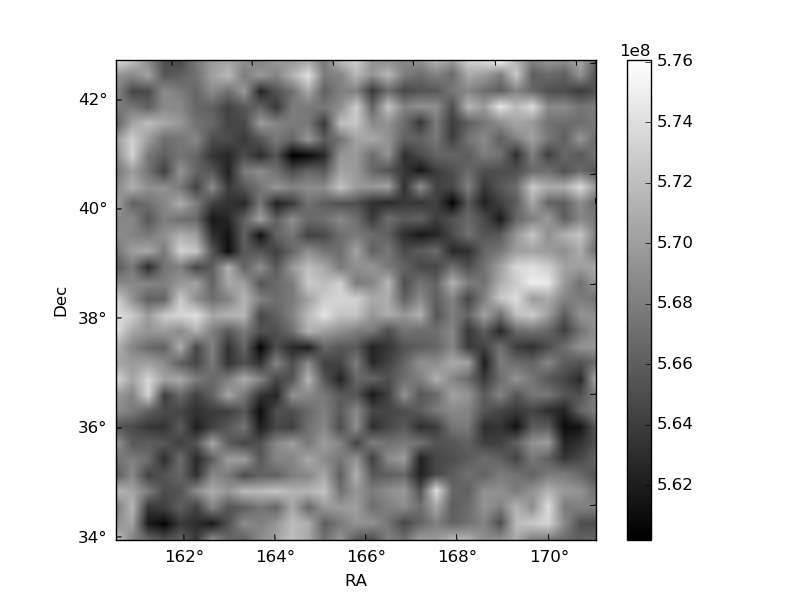
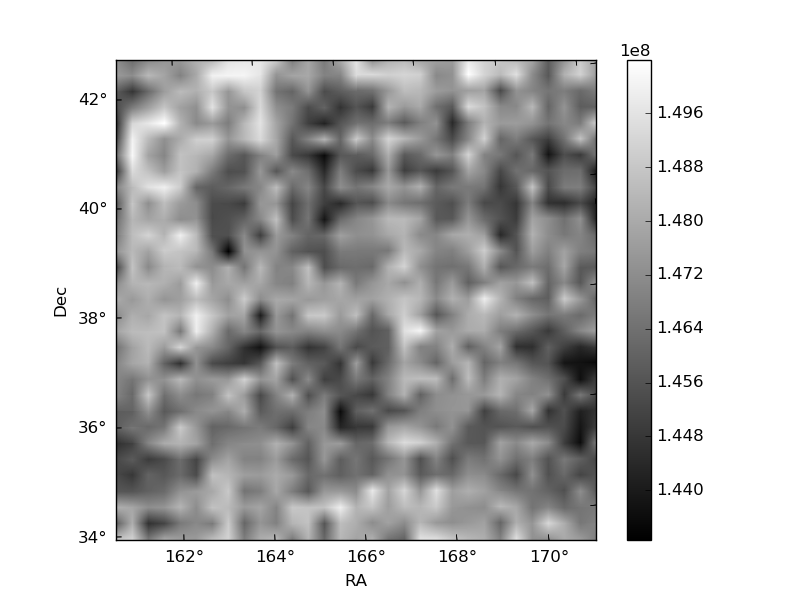
Histogram calculated using DETX and DETY for each event in the final _common_clean file
| Quadrant A | 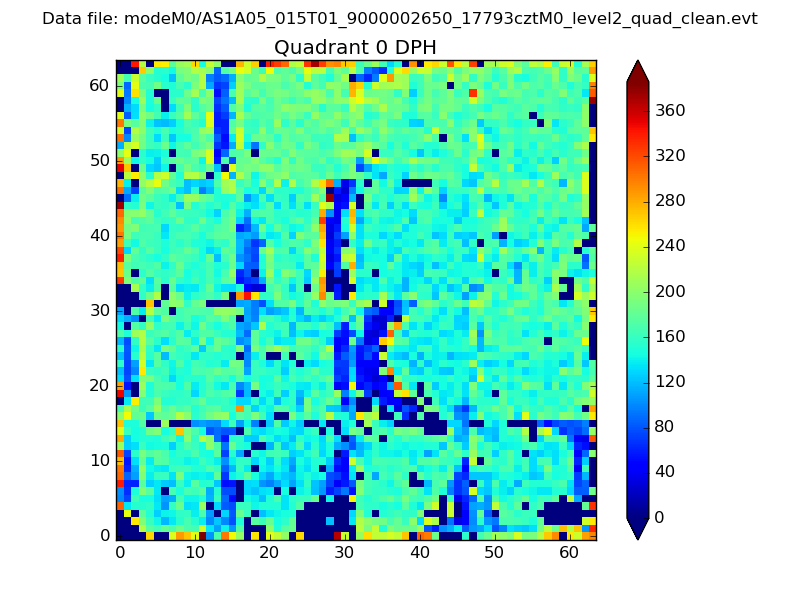 |
 |
Quadrant B |
|---|---|---|---|
| Quadrant D | 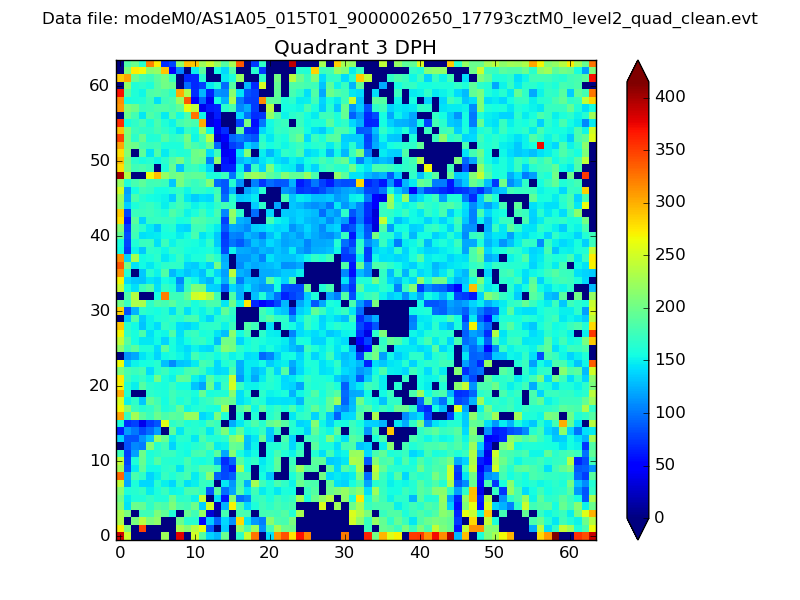 |
 |
Quadrant C |
| Plot type | Count rate plots | Images |
|---|---|---|
| Comparison with Poisson distribution Blue bars denote a histogram of data divided into 1 sec bins. Red curve is a Poisson curve with rate = median count rate of data. |
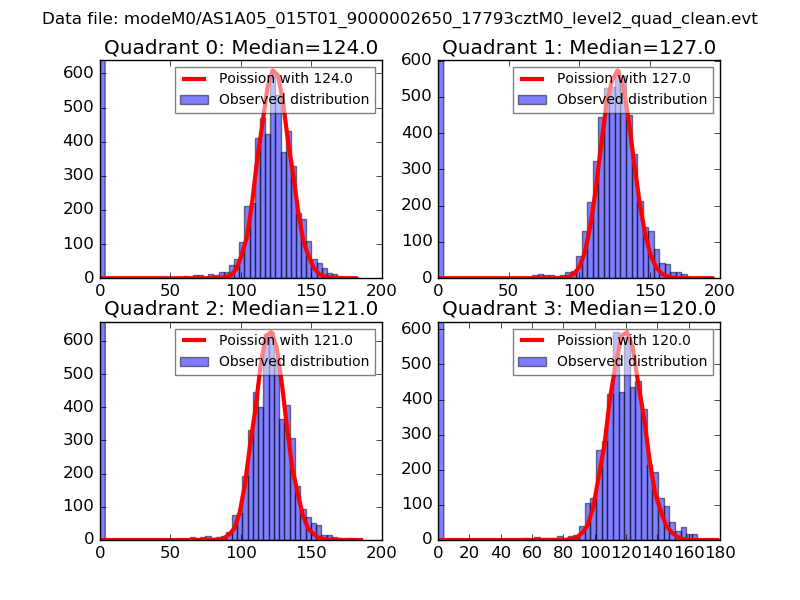 |
 |
| Quadrant-wise count rates Data is divided into 100 sec bins |
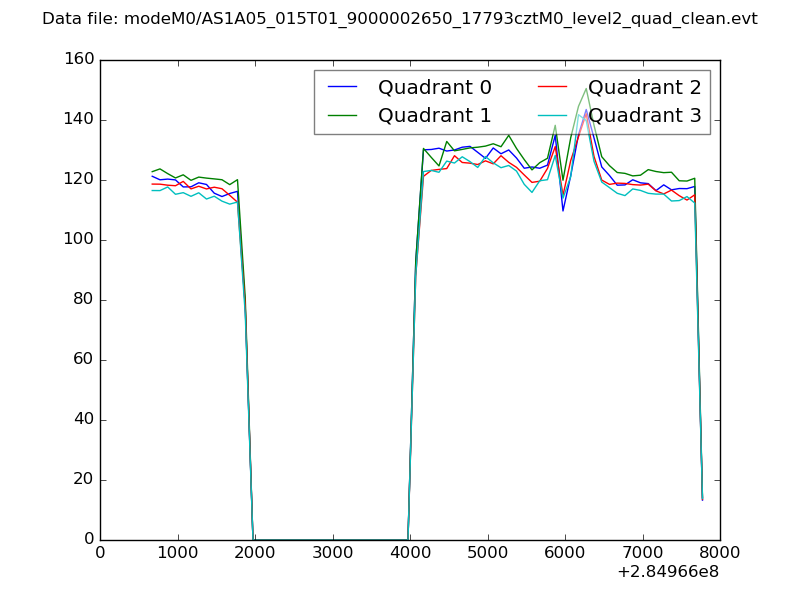 |
|
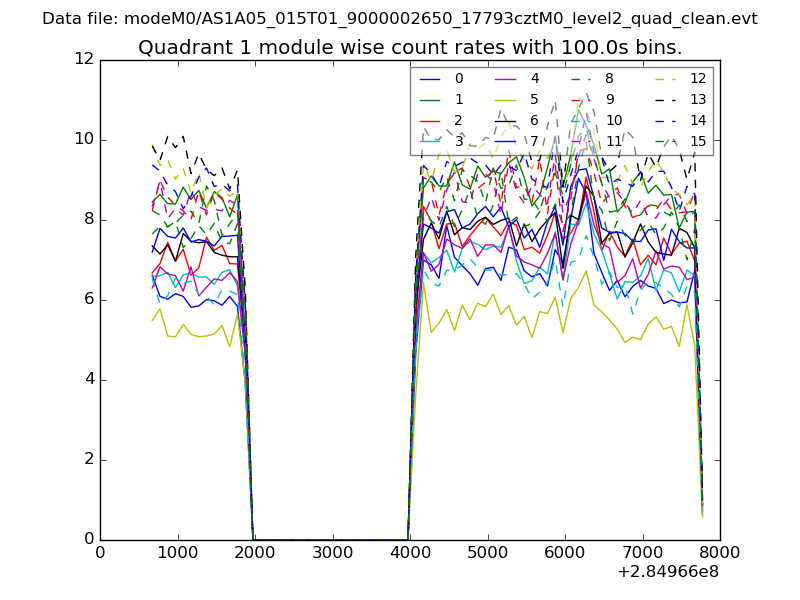
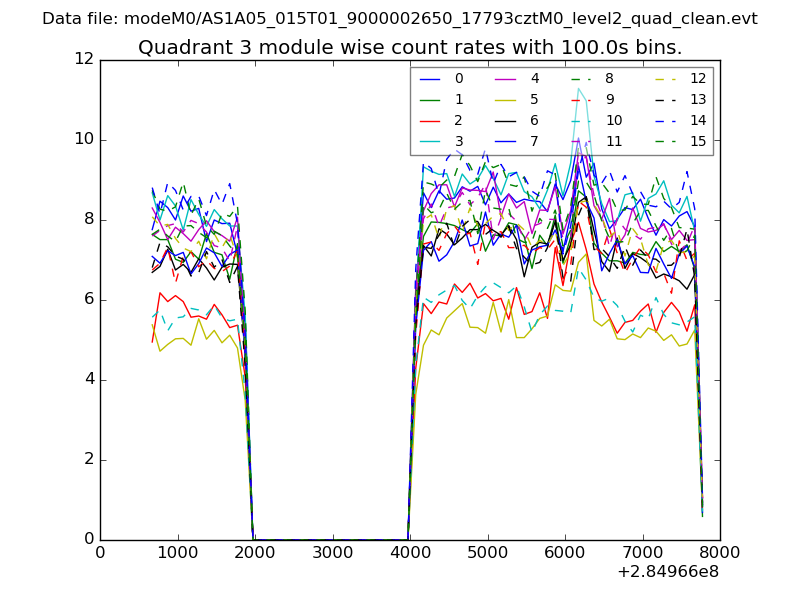
| Module-wise count rates for Quadrant A Data is divided into 100 sec bins |
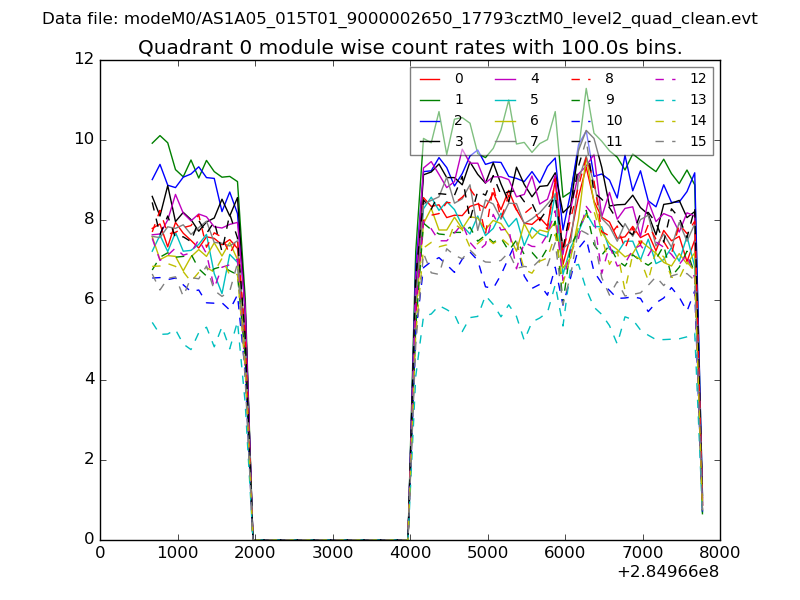 |
 |
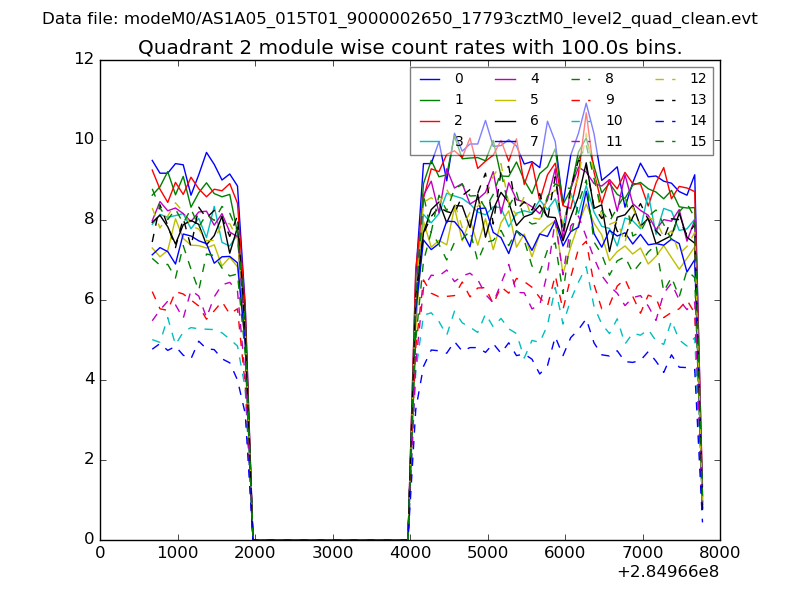
| Module-wise count rates for Quadrant B Data is divided into 100 sec bins |
 |
 |
| Module-wise count rates for Quadrant C Data is divided into 100 sec bins |
 |
 |
| Module-wise count rates for Quadrant D Data is divided into 100 sec bins |
 |
 |
| Parameter | Plot |
|---|---|
| CZT HV Monitor | 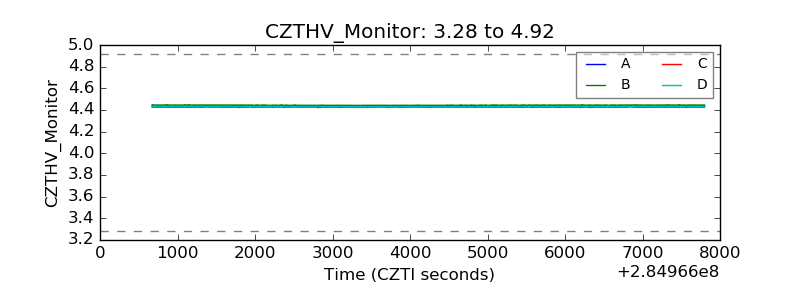 |
| D_VDD | 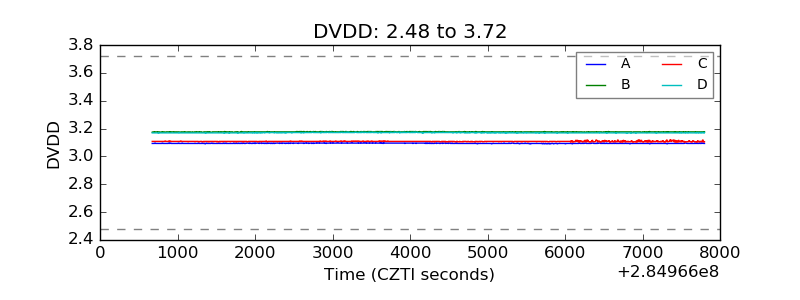 |
| Temperature 1 | 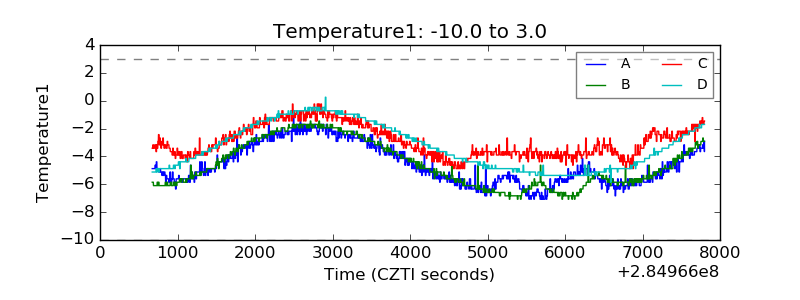 |
| Veto HV Monitor | 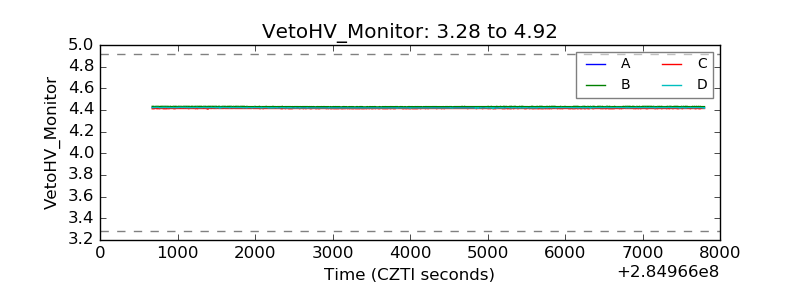 |
| Veto LLD | 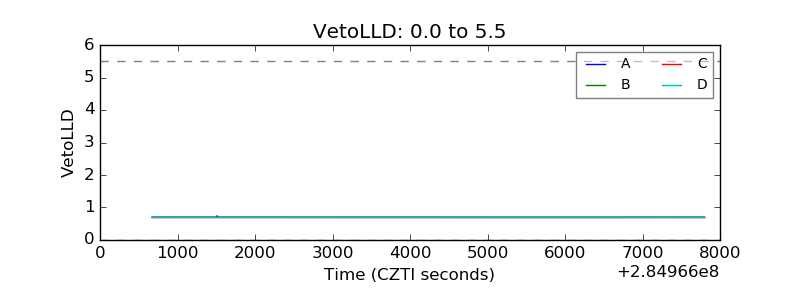 |
| Alpha Counter | 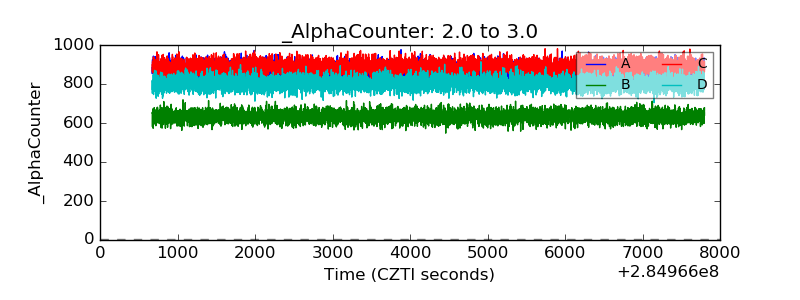 |
| _CPM_Rate | 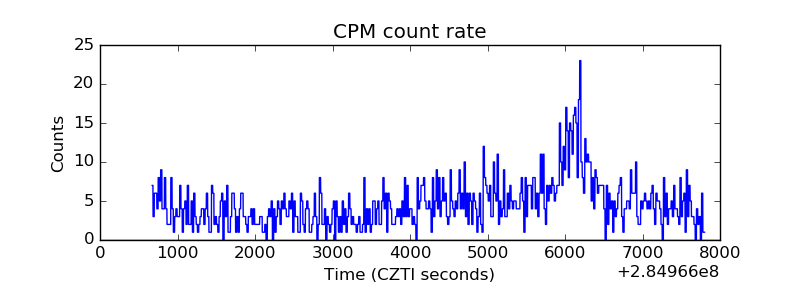 |
| CZT Counter | 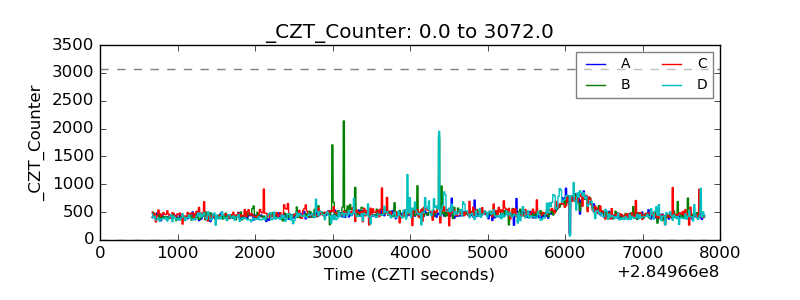 |
| +2.5 Volts monitor |  |
| +5 Volts monitor | 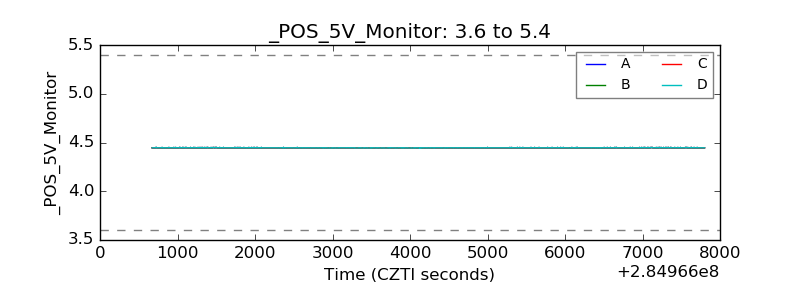 |
| _ROLL_ROT | 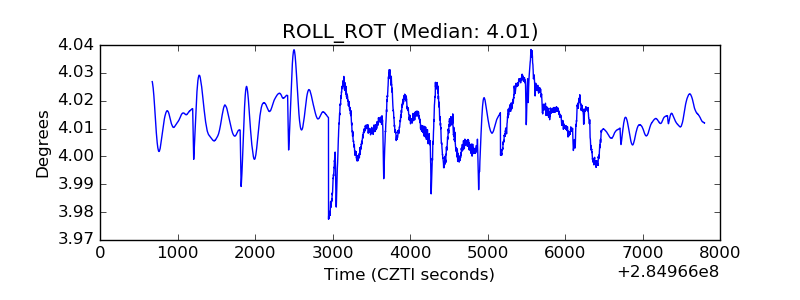 |
| _Roll_DEC | 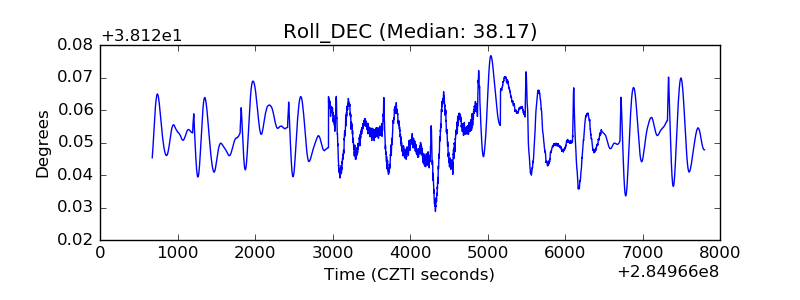 |
| _Roll_RA | 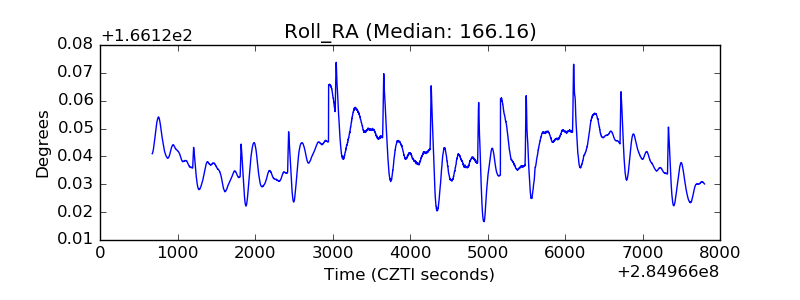 |
| Veto Counter | 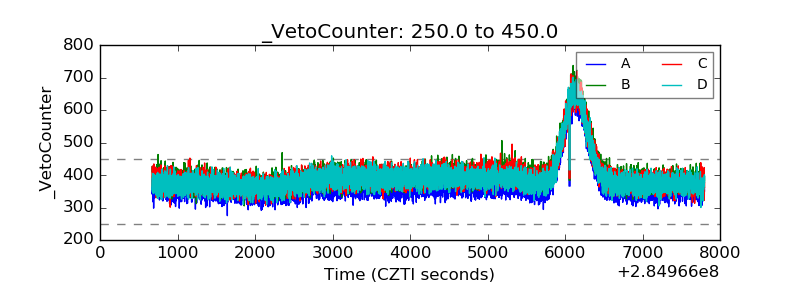 |