| Param | Original file | Final file |
|---|---|---|
| Filename | modeM0/AS1A05_015T01_9000002650_17794cztM0_level2.evt | modeM0/AS1A05_015T01_9000002650_17794cztM0_level2_quad_clean.evt |
| Size (bytes) | 483,966,720 | 89,688,960 |
| Size | 461.5 MB | 85.5 MB |
| Events in quadrant A | 3,344,512 | 557,908 |
| Events in quadrant B | 3,612,484 | 568,266 |
| Events in quadrant C | 3,469,241 | 545,003 |
| Events in quadrant D | 3,738,468 | 540,593 |
| Mode SS | |||
|---|---|---|---|
| Quadrant | BADHDUFLAG | Total packets | Discarded packets |
| A | 0 | 146 | 0 |
| B | 0 | 146 | 0 |
| C | 0 | 146 | 0 |
| D | 0 | 146 | 0 |
| Mode M0 | |||
|---|---|---|---|
| Quadrant | BADHDUFLAG | Total packets | Discarded packets |
| A | 0 | 14930 | 1 |
| B | 0 | 15492 | 1 |
| C | 0 | 14972 | 1 |
| D | 0 | 16110 | 1 |
| Quadrant | Total seconds | Saturated seconds | Saturation percentage |
|---|---|---|---|
| A | 7233 | 254 | 3.511683% |
| B | 7233 | 295 | 4.078529% |
| C | 7233 | 277 | 3.829670% |
| D | 7233 | 286 | 3.954099% |
Noise dominated data is calculated using 1-second bins in cleaned event files. If a bin has >2000 counts, and if more than 50% of those come from <1% of pixels, then it is considered to be noise-dominated and hence unusable.
| Quadrant | # 1 sec bins | Bins with >0 counts | Bins with >2000 counts | High rate bins dominated by noise | Noise dominated (total time) | Noise dominated (detector-on time) | Marked lightcurve |
|---|---|---|---|---|---|---|---|
| A | 7268 | 7234 | 1 | 1 | 0.01% | 0.01% |  |
| B | 7268 | 7234 | 14 | 14 | 0.19% | 0.19% |  |
| C | 7268 | 7234 | 0 | 0 | 0.00% | 0.00% |  |
| D | 7268 | 7234 | 66 | 66 | 0.91% | 0.91% |  |
Top three noisy pixels from each quadrant. If the there are fewer than three noisy pixels in the level2.evt file, extra rows are filled as -1
| Pixel properties | Quadrant properties | ||||||
|---|---|---|---|---|---|---|---|
| Quadrant | DetID | PixID | Counts | Sigma | Mean | Median | Sigma |
| A | 15 | 174 | 22853 | 125.18 | 864 | 844 | 175.8 |
| A | 0 | 226 | 7417 | 37.39 | 864 | 844 | 175.8 |
| A | 3 | 137 | 6630 | 32.91 | 864 | 844 | 175.8 |
| B | 7 | 220 | 128835 | 760.3 | 862 | 840 | 168.3 |
| B | 0 | 229 | 38419 | 223.22 | 862 | 840 | 168.3 |
| B | 0 | 219 | 22948 | 131.32 | 862 | 840 | 168.3 |
| C | 14 | 238 | 126139 | 643.88 | 825 | 827 | 194.6 |
| C | 3 | 233 | 66975 | 339.88 | 825 | 827 | 194.6 |
| C | 9 | 160 | 21131 | 104.32 | 825 | 827 | 194.6 |
| D | 7 | 238 | 424335 | 2050.23 | 839 | 816 | 206.6 |
| D | 1 | 52 | 84952 | 407.3 | 839 | 816 | 206.6 |
| D | 2 | 234 | 32579 | 153.76 | 839 | 816 | 206.6 |
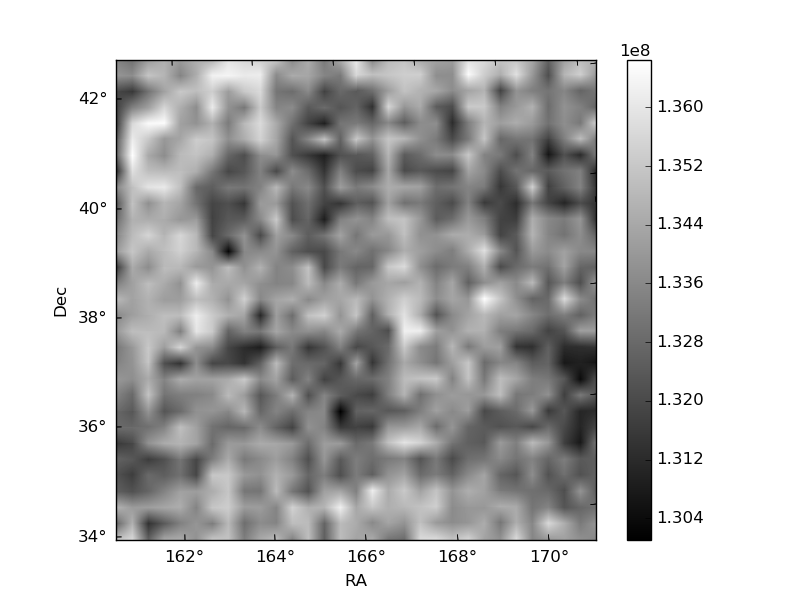
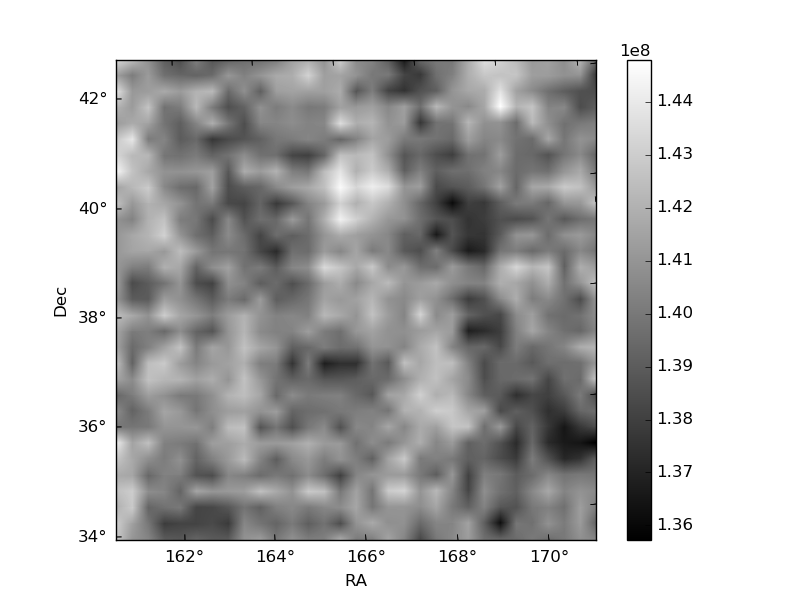
Histogram calculated using DETX and DETY for each event in the final _common_clean file
| Quadrant A | 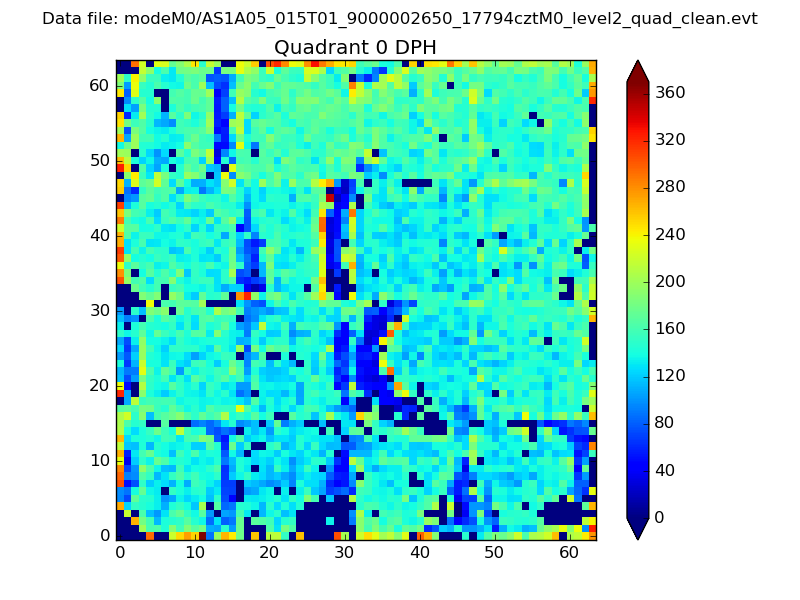 |
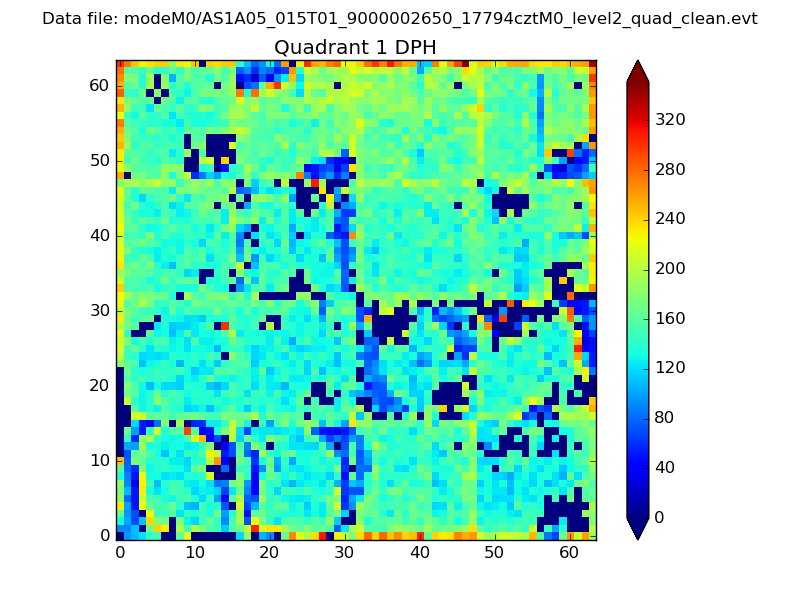 |
Quadrant B |
|---|---|---|---|
| Quadrant D | 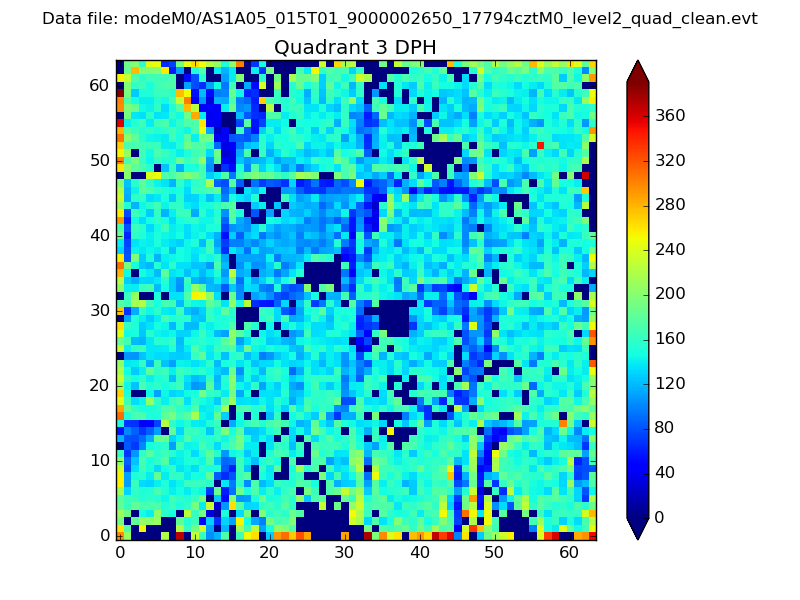 |
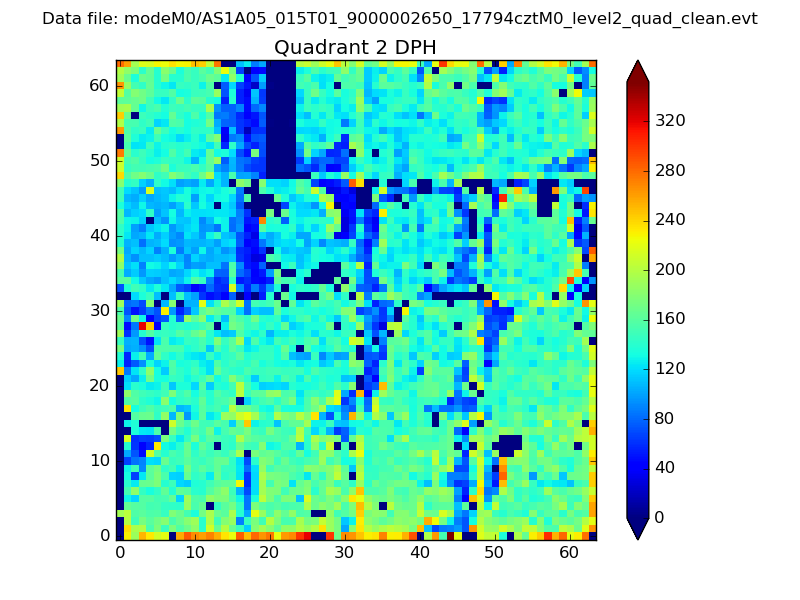 |
Quadrant C |
| Plot type | Count rate plots | Images |
|---|---|---|
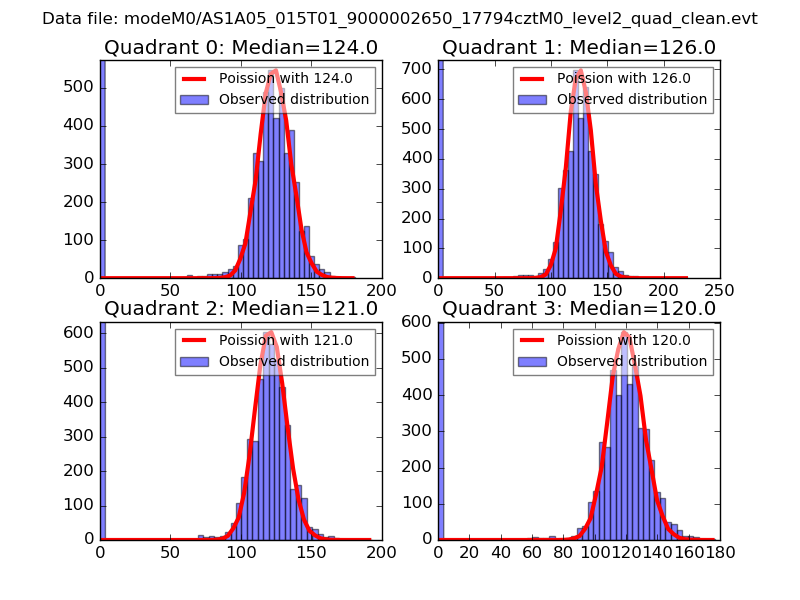
| Comparison with Poisson distribution Blue bars denote a histogram of data divided into 1 sec bins. Red curve is a Poisson curve with rate = median count rate of data. |
 |
 |
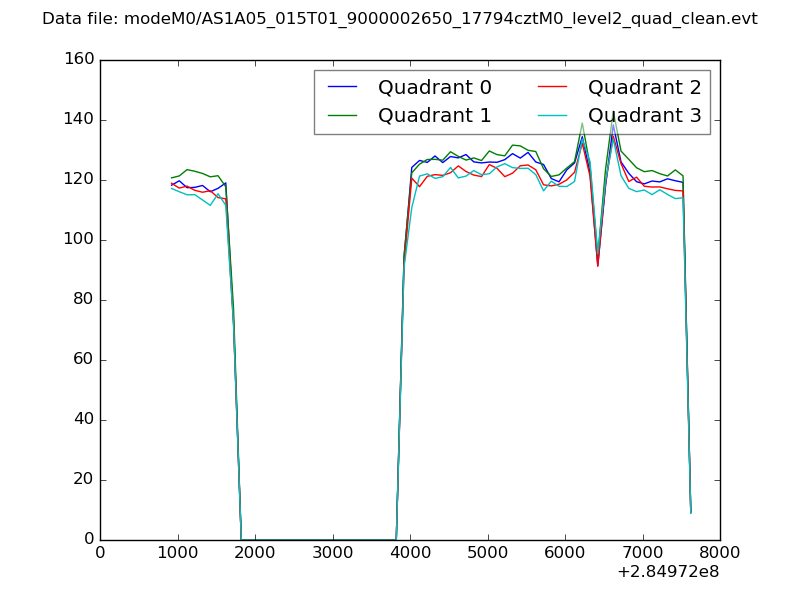
| Quadrant-wise count rates Data is divided into 100 sec bins |
 |
|
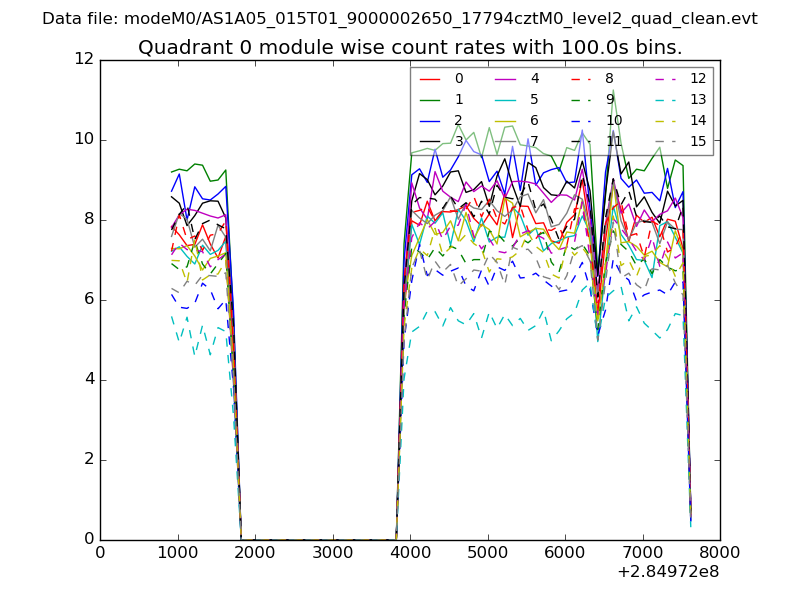
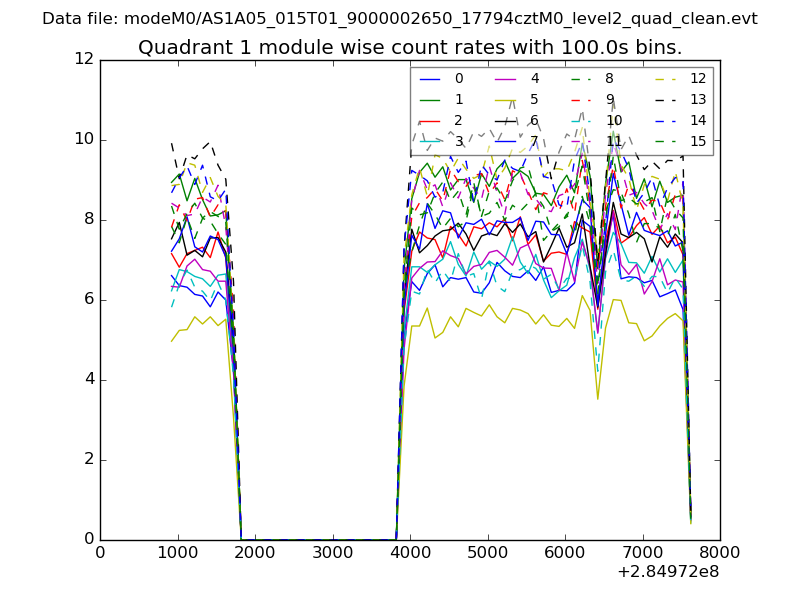
| Module-wise count rates for Quadrant A Data is divided into 100 sec bins |
 |
 |
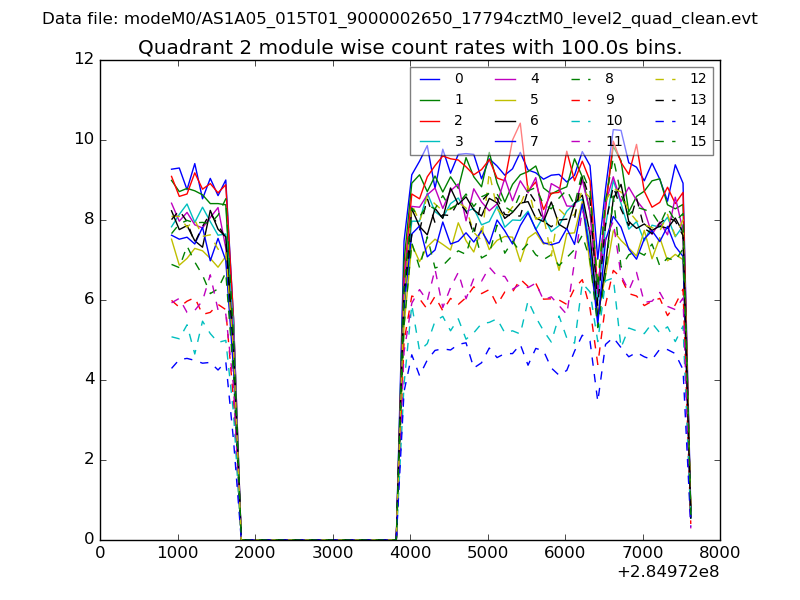
| Module-wise count rates for Quadrant B Data is divided into 100 sec bins |
 |
 |
| Module-wise count rates for Quadrant C Data is divided into 100 sec bins |
 |
 |
| Module-wise count rates for Quadrant D Data is divided into 100 sec bins |
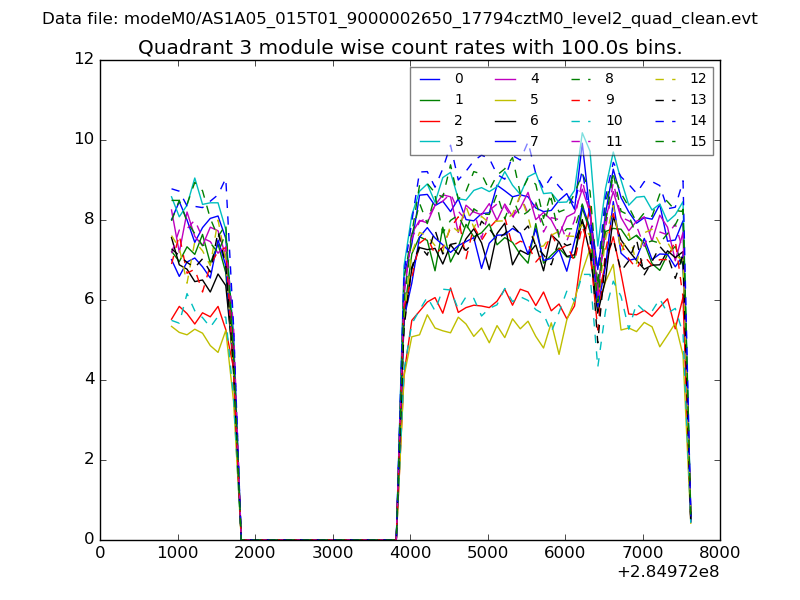 |
 |
| Parameter | Plot |
|---|---|
| CZT HV Monitor | 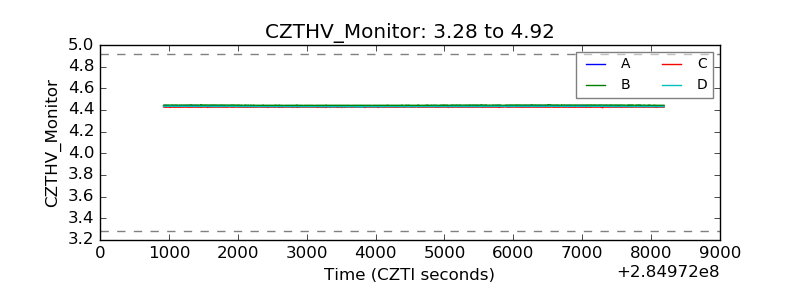 |
| D_VDD | 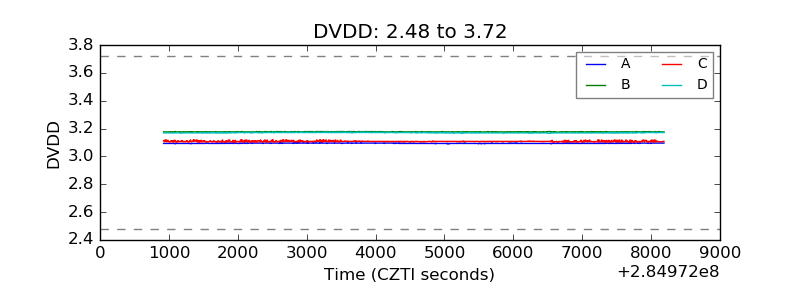 |
| Temperature 1 | 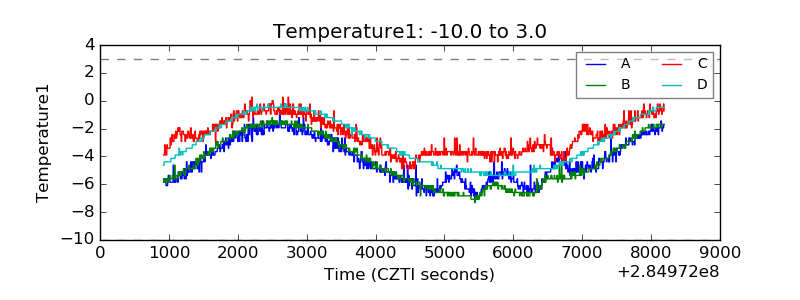 |
| Veto HV Monitor | 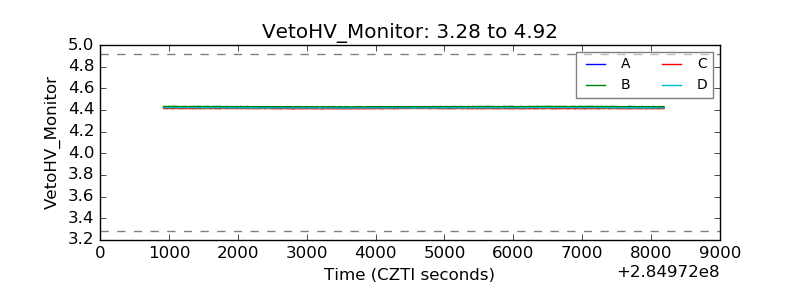 |
| Veto LLD | 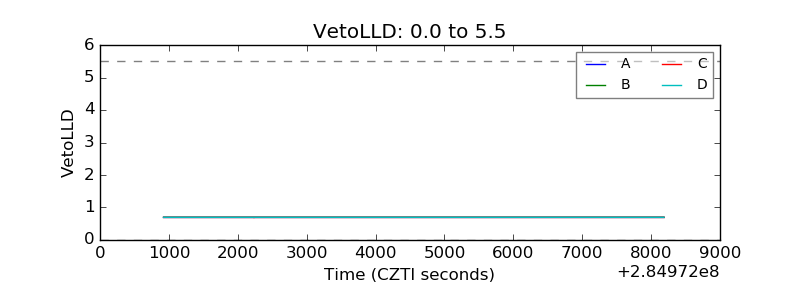 |
| Alpha Counter | 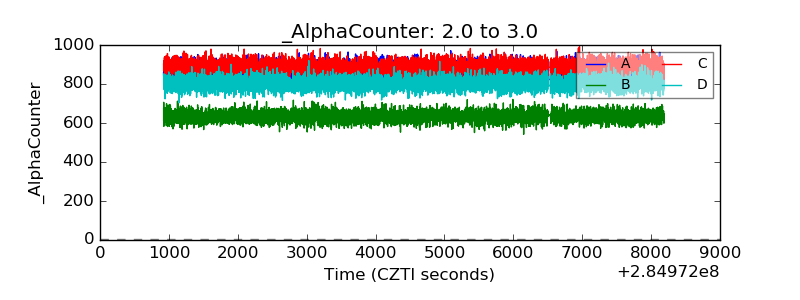 |
| _CPM_Rate | 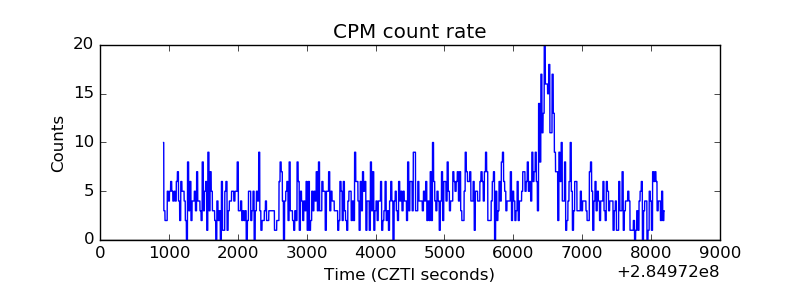 |
| CZT Counter | 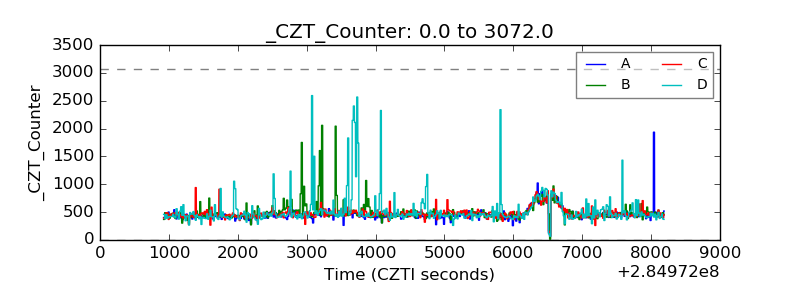 |
| +2.5 Volts monitor |  |
| +5 Volts monitor |  |
| _ROLL_ROT |  |
| _Roll_DEC | 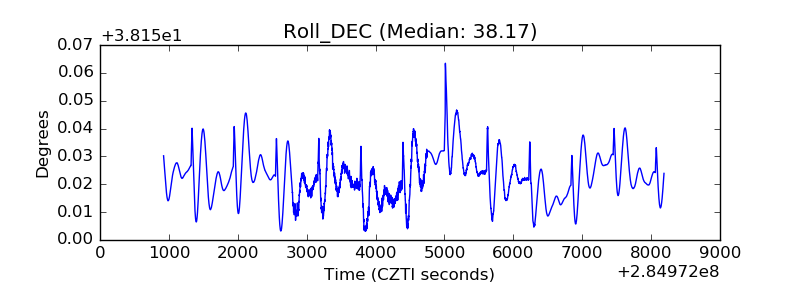 |
| _Roll_RA | 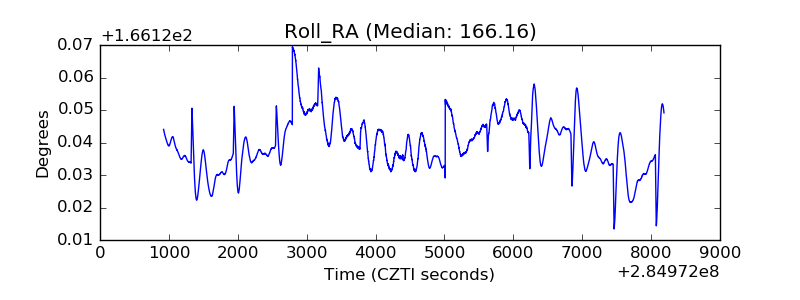 |
| Veto Counter | 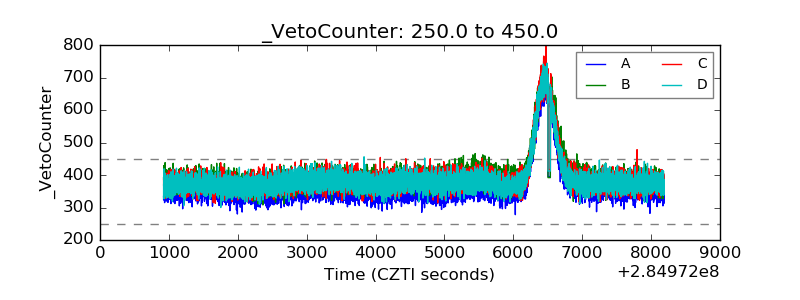 |