| Param | Original file | Final file |
|---|---|---|
| Filename | modeM0/AS1A05_015T01_9000002650_17797cztM0_level2.evt | modeM0/AS1A05_015T01_9000002650_17797cztM0_level2_quad_clean.evt |
| Size (bytes) | 1,293,180,480 | 204,442,560 |
| Size | 1.2 GB | 195.0 MB |
| Events in quadrant A | 8,393,376 | 1,256,763 |
| Events in quadrant B | 8,988,442 | 1,267,409 |
| Events in quadrant C | 8,933,048 | 1,217,661 |
| Events in quadrant D | 11,617,123 | 1,193,562 |
| Mode SS | |||
|---|---|---|---|
| Quadrant | BADHDUFLAG | Total packets | Discarded packets |
| A | 0 | 370 | 0 |
| B | 0 | 370 | 0 |
| C | 0 | 370 | 0 |
| D | 0 | 370 | 0 |
| Mode M9 | |||
|---|---|---|---|
| Quadrant | BADHDUFLAG | Total packets | Discarded packets |
| A | 0 | 18 | 0 |
| B | 0 | 18 | 0 |
| C | 0 | 18 | 0 |
| D | 0 | 18 | 0 |
| Mode M0 | |||
|---|---|---|---|
| Quadrant | BADHDUFLAG | Total packets | Discarded packets |
| A | 0 | 37213 | 3 |
| B | 0 | 38394 | 4 |
| C | 0 | 37812 | 3 |
| D | 0 | 46993 | 3 |
| Quadrant | Total seconds | Saturated seconds | Saturation percentage |
|---|---|---|---|
| A | 18227 | 168 | 0.921710% |
| B | 18227 | 252 | 1.382564% |
| C | 18227 | 263 | 1.442914% |
| D | 18227 | 860 | 4.718275% |
Noise dominated data is calculated using 1-second bins in cleaned event files. If a bin has >2000 counts, and if more than 50% of those come from <1% of pixels, then it is considered to be noise-dominated and hence unusable.
| Quadrant | # 1 sec bins | Bins with >0 counts | Bins with >2000 counts | High rate bins dominated by noise | Noise dominated (total time) | Noise dominated (detector-on time) | Marked lightcurve |
|---|---|---|---|---|---|---|---|
| A | 19977 | 18228 | 2 | 2 | 0.01% | 0.01% | 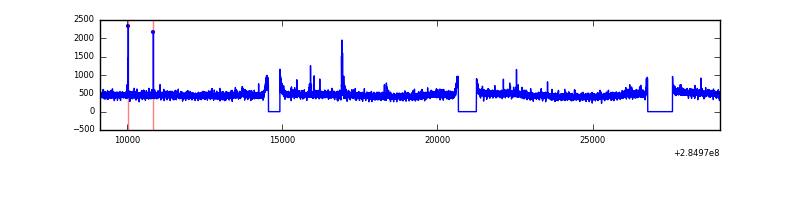 |
| B | 19977 | 18228 | 28 | 28 | 0.14% | 0.15% |  |
| C | 19977 | 18228 | 0 | 0 | 0.00% | 0.00% | 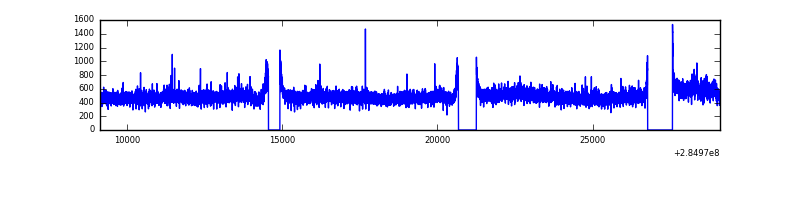 |
| D | 19977 | 18228 | 593 | 593 | 2.97% | 3.25% | 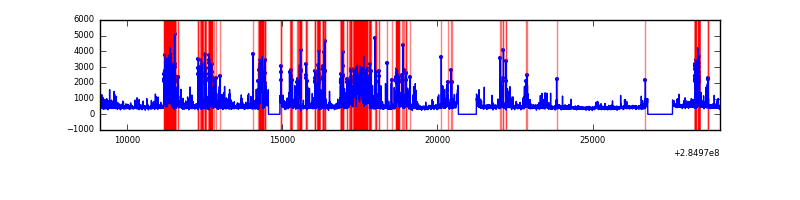 |
Top three noisy pixels from each quadrant. If the there are fewer than three noisy pixels in the level2.evt file, extra rows are filled as -1
| Pixel properties | Quadrant properties | ||||||
|---|---|---|---|---|---|---|---|
| Quadrant | DetID | PixID | Counts | Sigma | Mean | Median | Sigma |
| A | 15 | 174 | 73966 | 163.55 | 2165 | 2113 | 439.3 |
| A | 0 | 226 | 18780 | 37.94 | 2165 | 2113 | 439.3 |
| A | 3 | 137 | 16410 | 32.54 | 2165 | 2113 | 439.3 |
| B | 0 | 229 | 163959 | 396.39 | 2158 | 2100 | 408.3 |
| B | 7 | 220 | 127428 | 306.93 | 2158 | 2100 | 408.3 |
| B | 0 | 219 | 98045 | 234.97 | 2158 | 2100 | 408.3 |
| C | 3 | 233 | 415304 | 848.99 | 2072 | 2085 | 486.7 |
| C | 14 | 238 | 317883 | 648.83 | 2072 | 2085 | 486.7 |
| C | 5 | 218 | 93950 | 188.74 | 2072 | 2085 | 486.7 |
| D | 7 | 238 | 2858264 | 5755.25 | 2067 | 2016 | 496.3 |
| D | 1 | 52 | 296850 | 594.08 | 2067 | 2016 | 496.3 |
| D | 1 | 255 | 230033 | 459.45 | 2067 | 2016 | 496.3 |
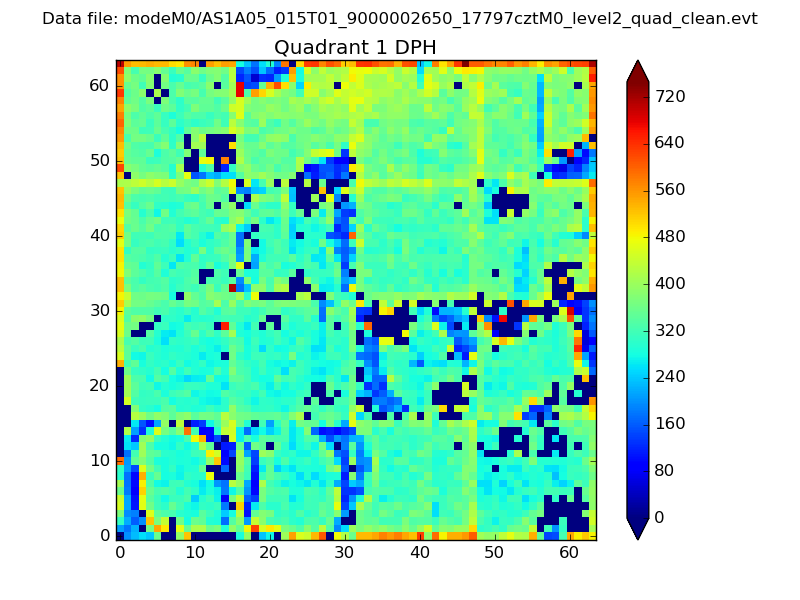
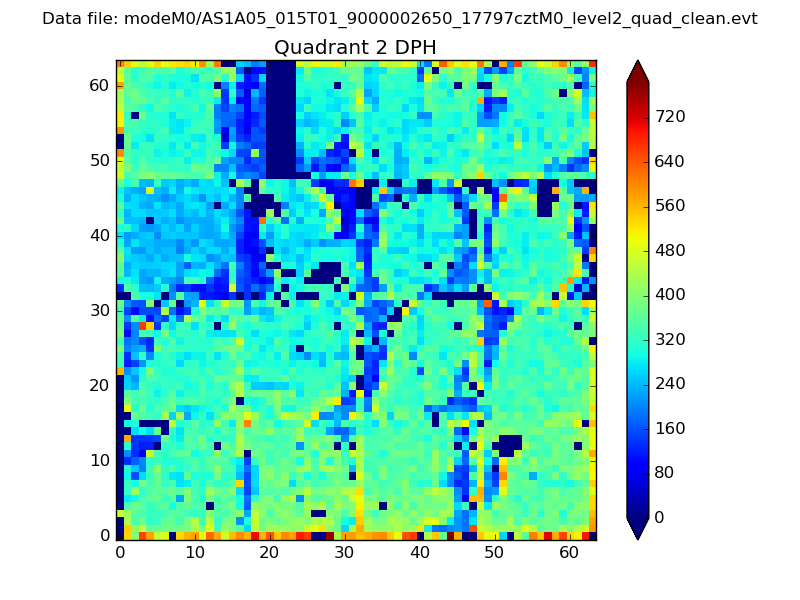
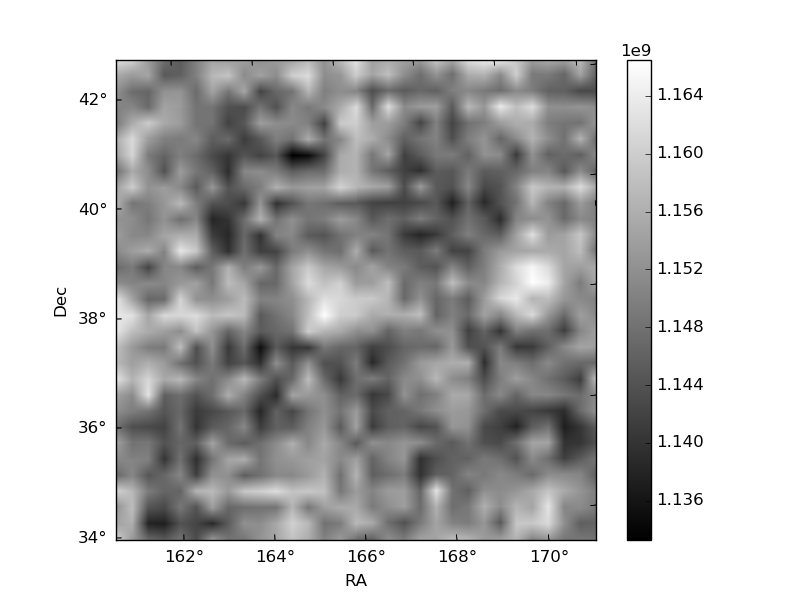
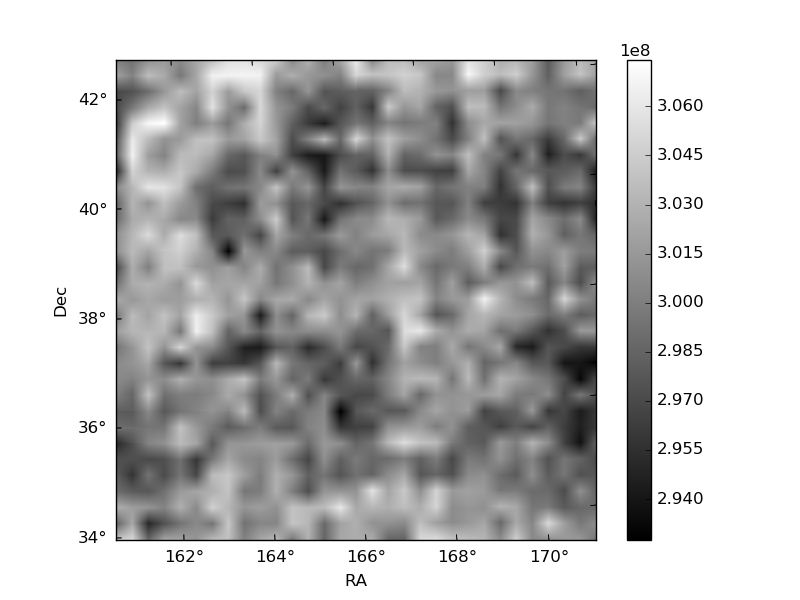
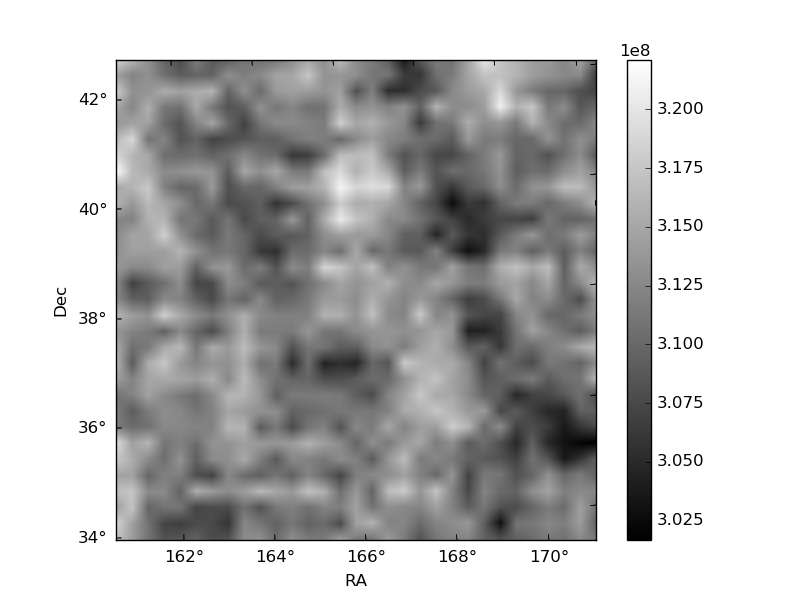
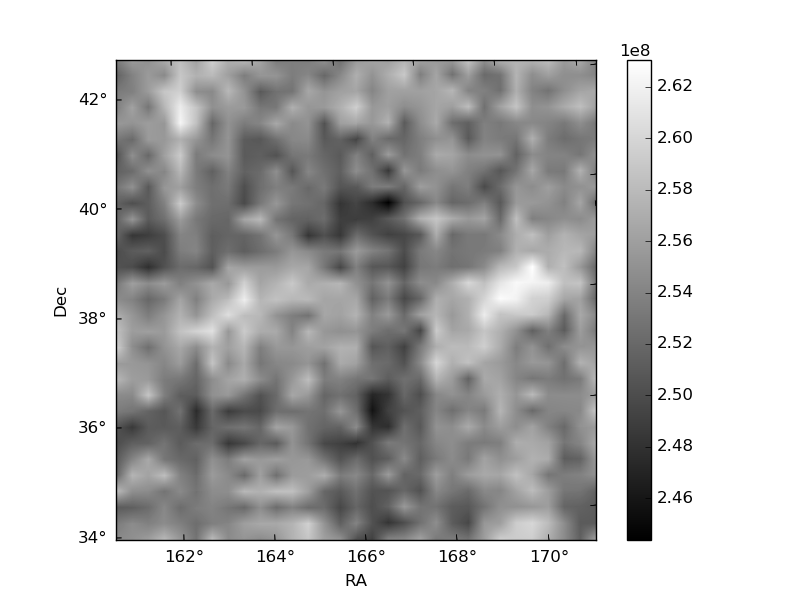
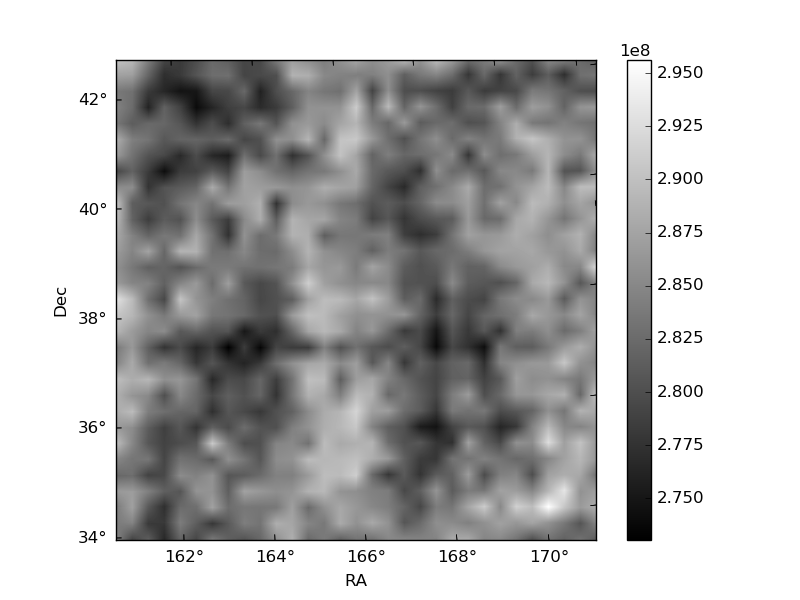
Histogram calculated using DETX and DETY for each event in the final _common_clean file
| Quadrant A | 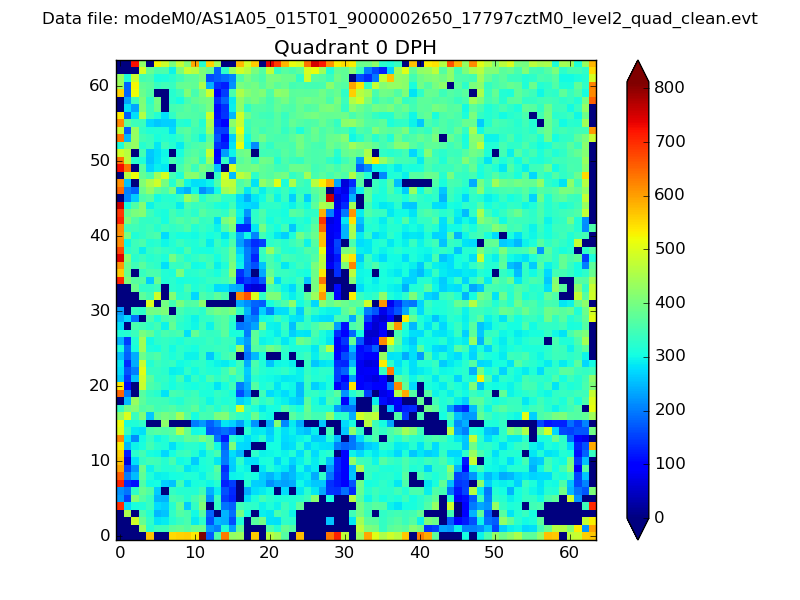 |
 |
Quadrant B |
|---|---|---|---|
| Quadrant D | 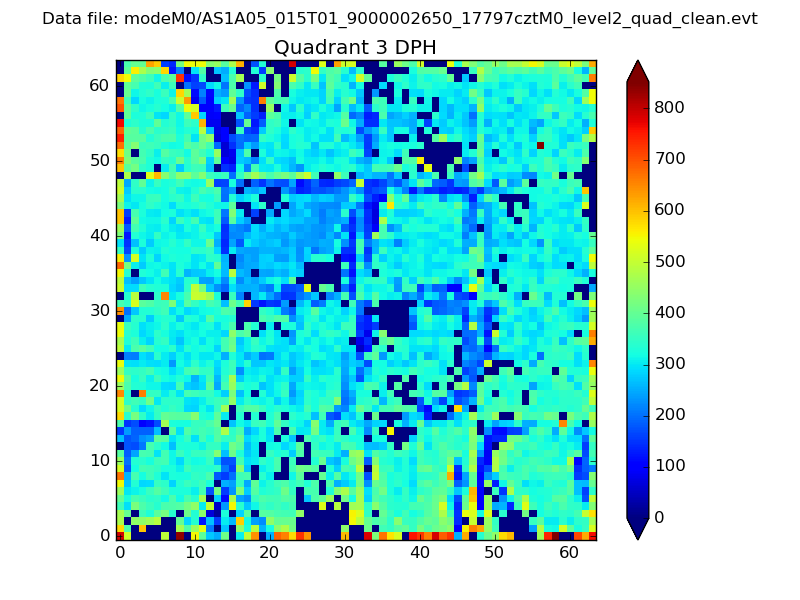 |
 |
Quadrant C |
| Plot type | Count rate plots | Images |
|---|---|---|
| Comparison with Poisson distribution Blue bars denote a histogram of data divided into 1 sec bins. Red curve is a Poisson curve with rate = median count rate of data. |
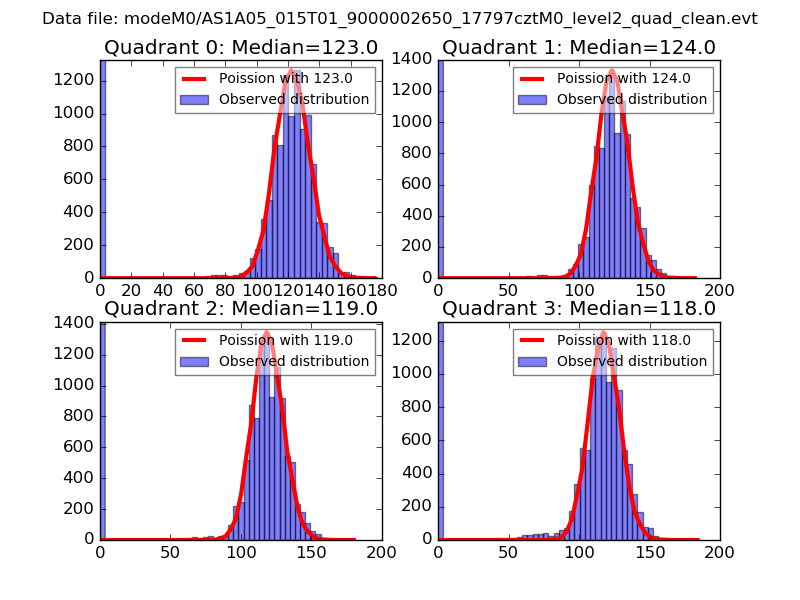 |
 |
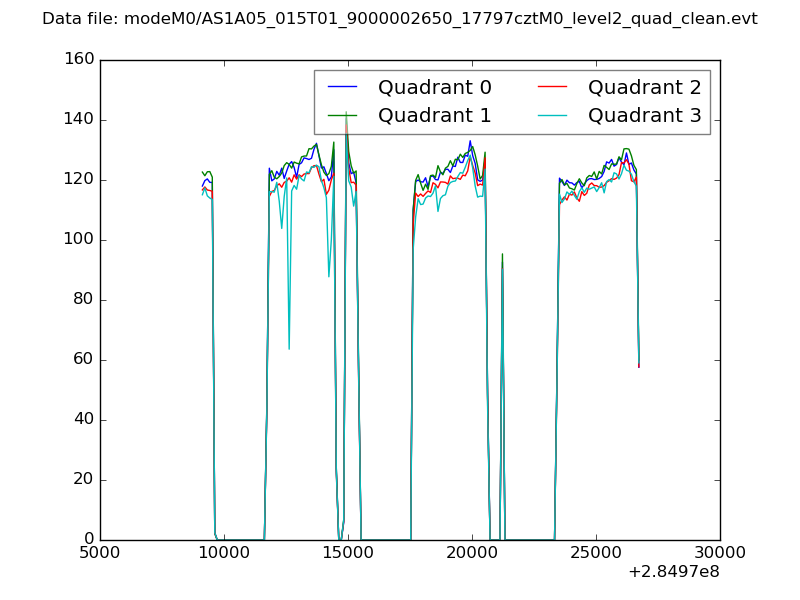
| Quadrant-wise count rates Data is divided into 100 sec bins |
 |
|
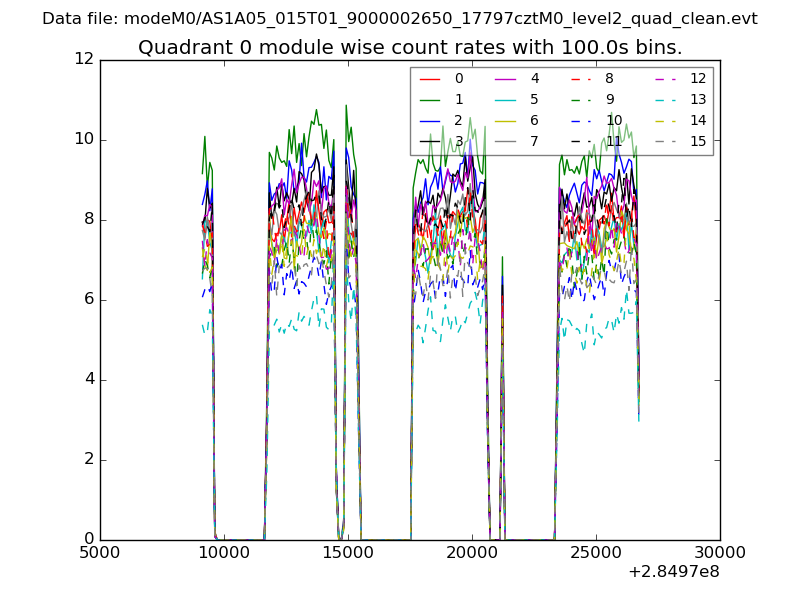
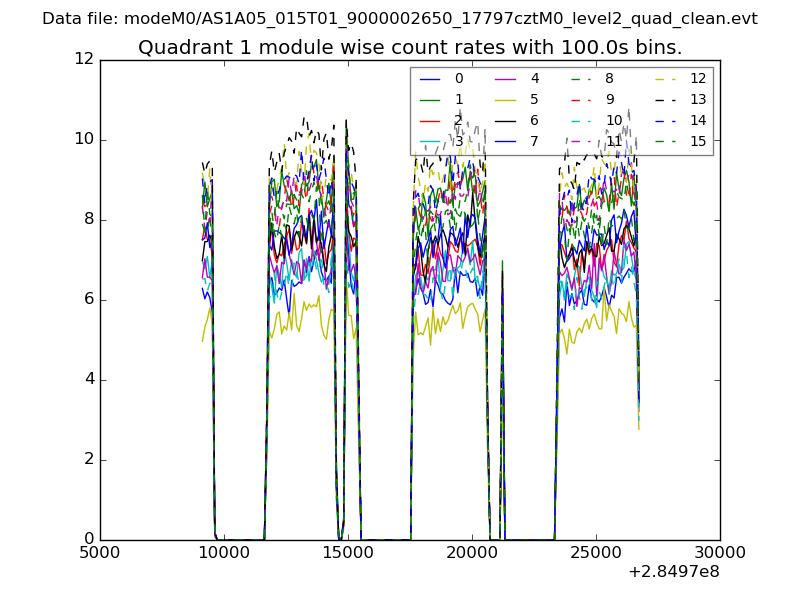
| Module-wise count rates for Quadrant A Data is divided into 100 sec bins |
 |
 |
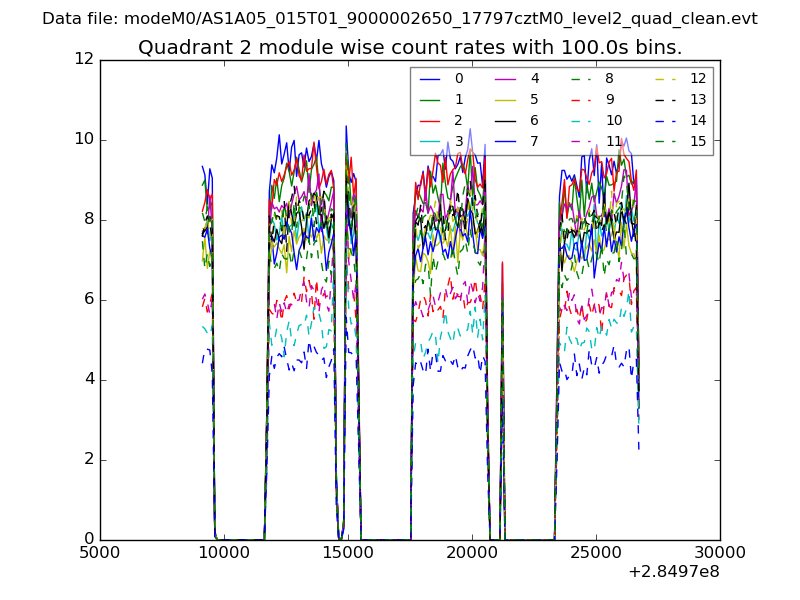
| Module-wise count rates for Quadrant B Data is divided into 100 sec bins |
 |
 |
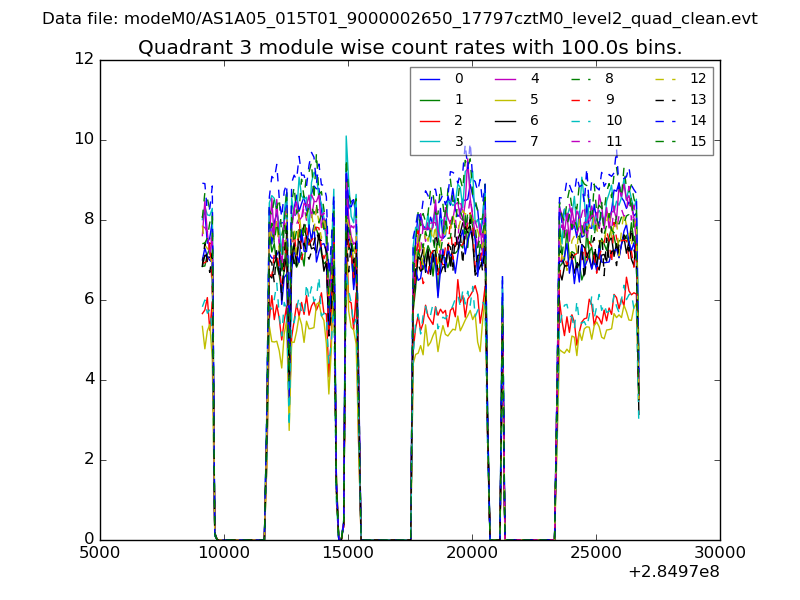
| Module-wise count rates for Quadrant C Data is divided into 100 sec bins |
 |
 |
| Module-wise count rates for Quadrant D Data is divided into 100 sec bins |
 |
 |
| Parameter | Plot |
|---|---|
| CZT HV Monitor | 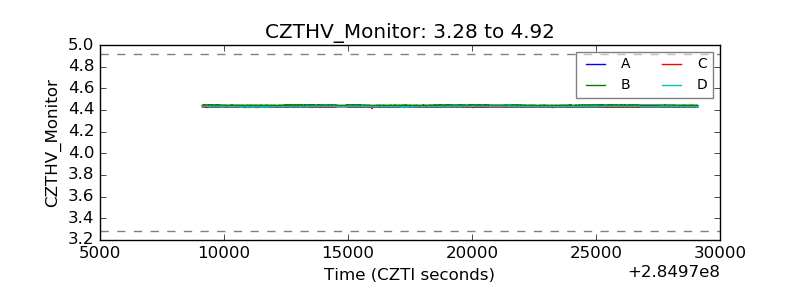 |
| D_VDD |  |
| Temperature 1 | 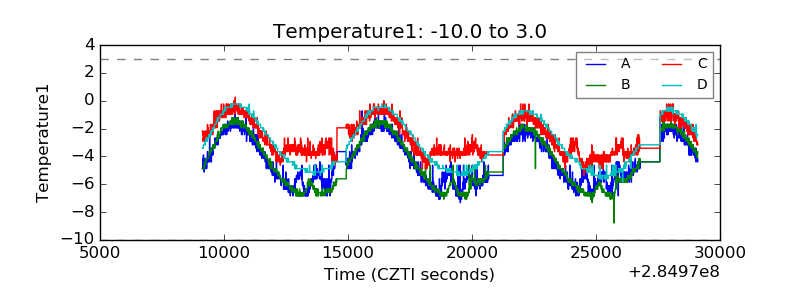 |
| Veto HV Monitor |  |
| Veto LLD | 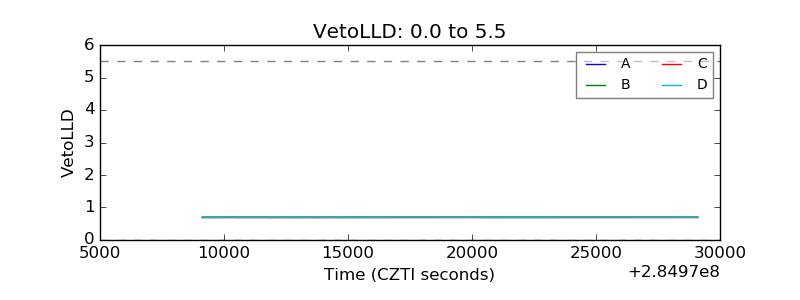 |
| Alpha Counter | 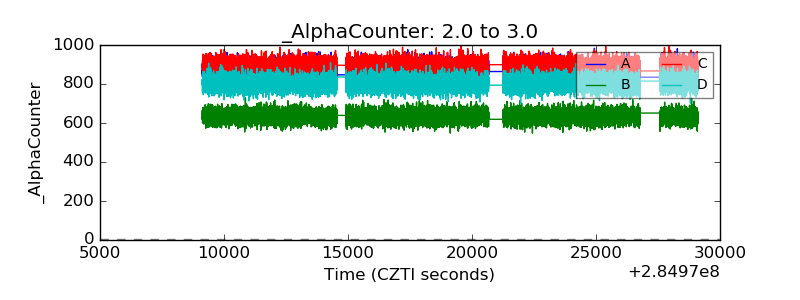 |
| _CPM_Rate | 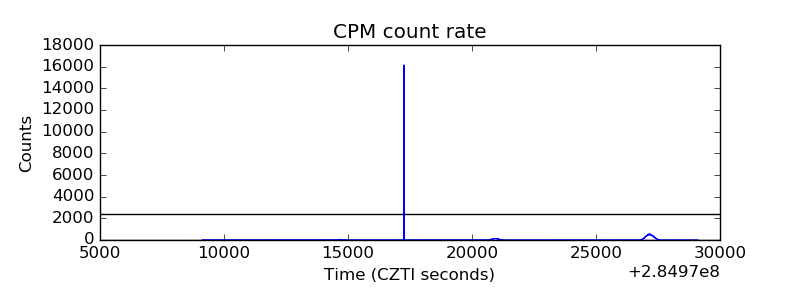 |
| CZT Counter | 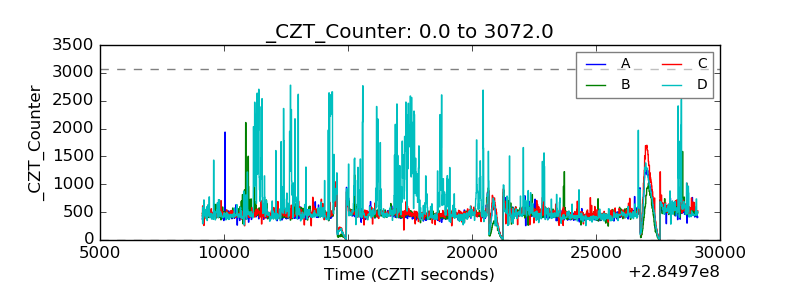 |
| +2.5 Volts monitor |  |
| +5 Volts monitor |  |
| _ROLL_ROT | 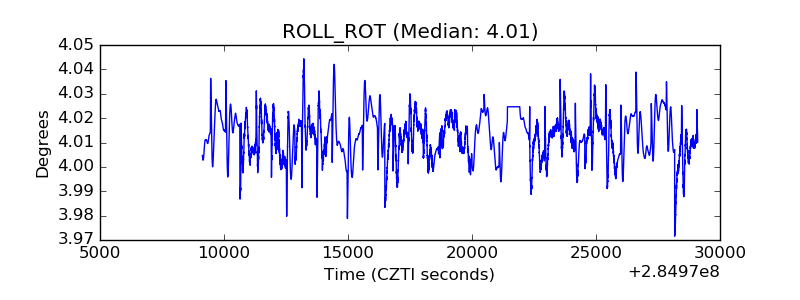 |
| _Roll_DEC | 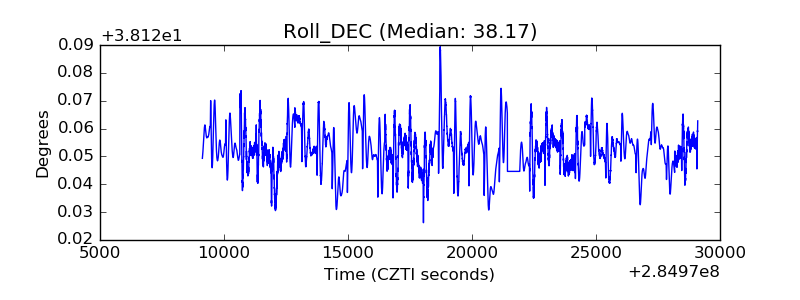 |
| _Roll_RA | 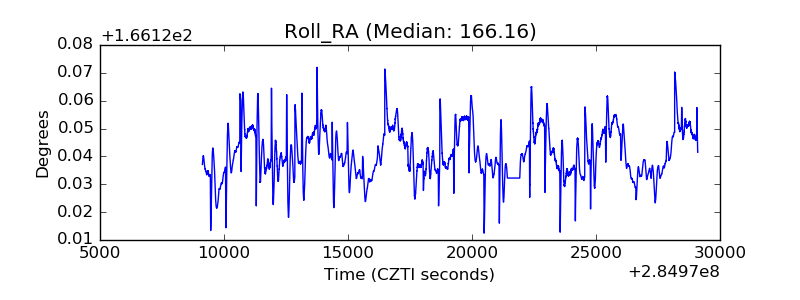 |
| Veto Counter | 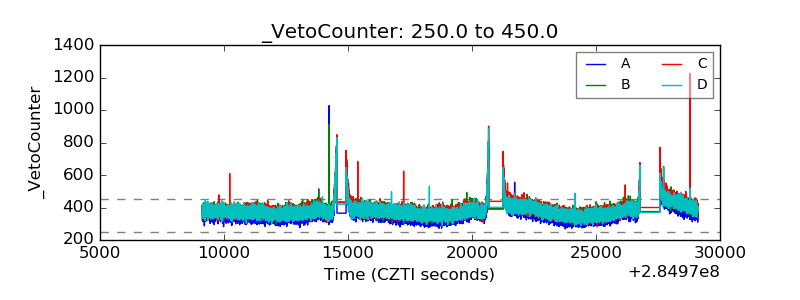 |