| Param | Original file | Final file |
|---|---|---|
| Filename | modeM0/AS1A05_015T01_9000002650_17798cztM0_level2.evt | modeM0/AS1A05_015T01_9000002650_17798cztM0_level2_quad_clean.evt |
| Size (bytes) | 470,646,720 | 73,670,400 |
| Size | 448.8 MB | 70.3 MB |
| Events in quadrant A | 3,196,666 | 447,413 |
| Events in quadrant B | 3,354,086 | 450,573 |
| Events in quadrant C | 3,445,114 | 435,348 |
| Events in quadrant D | 3,800,838 | 428,652 |
| Mode SS | |||
|---|---|---|---|
| Quadrant | BADHDUFLAG | Total packets | Discarded packets |
| A | 0 | 138 | 0 |
| B | 0 | 138 | 0 |
| C | 0 | 138 | 0 |
| D | 0 | 138 | 0 |
| Mode M9 | |||
|---|---|---|---|
| Quadrant | BADHDUFLAG | Total packets | Discarded packets |
| A | 0 | 13 | 0 |
| B | 0 | 14 | 0 |
| C | 0 | 14 | 0 |
| D | 0 | 14 | 0 |
| Mode M0 | |||
|---|---|---|---|
| Quadrant | BADHDUFLAG | Total packets | Discarded packets |
| A | 0 | 13911 | 2 |
| B | 0 | 14330 | 3 |
| C | 0 | 14632 | 2 |
| D | 0 | 15893 | 2 |
| Quadrant | Total seconds | Saturated seconds | Saturation percentage |
|---|---|---|---|
| A | 6720 | 48 | 0.714286% |
| B | 6719 | 59 | 0.878107% |
| C | 6719 | 86 | 1.279952% |
| D | 6719 | 163 | 2.425956% |
Noise dominated data is calculated using 1-second bins in cleaned event files. If a bin has >2000 counts, and if more than 50% of those come from <1% of pixels, then it is considered to be noise-dominated and hence unusable.
| Quadrant | # 1 sec bins | Bins with >0 counts | Bins with >2000 counts | High rate bins dominated by noise | Noise dominated (total time) | Noise dominated (detector-on time) | Marked lightcurve |
|---|---|---|---|---|---|---|---|
| A | 7665 | 6721 | 0 | 0 | 0.00% | 0.00% | 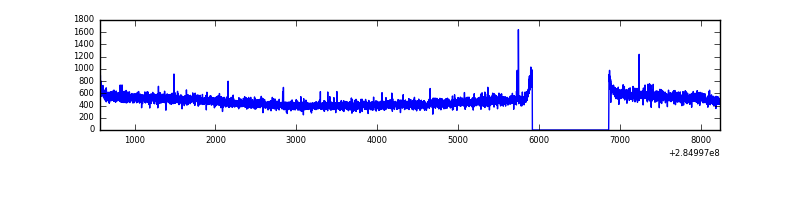 |
| B | 7664 | 6720 | 7 | 7 | 0.09% | 0.10% | 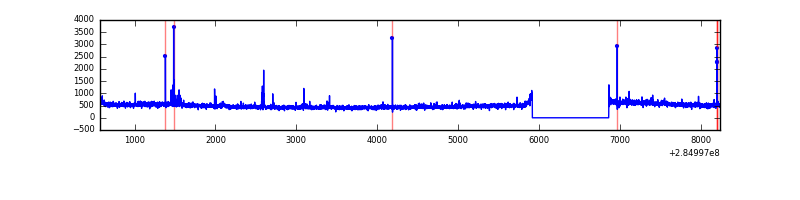 |
| C | 7664 | 6719 | 0 | 0 | 0.00% | 0.00% | 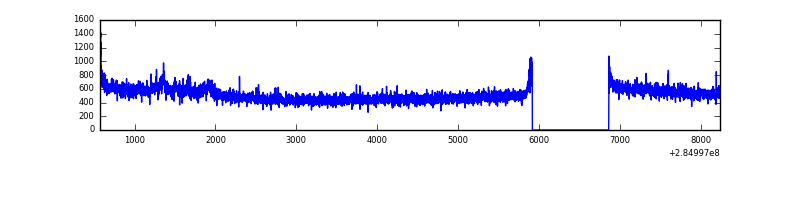 |
| D | 7664 | 6720 | 97 | 97 | 1.27% | 1.44% | 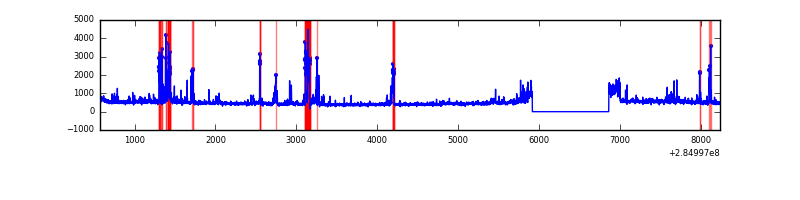 |
Top three noisy pixels from each quadrant. If the there are fewer than three noisy pixels in the level2.evt file, extra rows are filled as -1
| Pixel properties | Quadrant properties | ||||||
|---|---|---|---|---|---|---|---|
| Quadrant | DetID | PixID | Counts | Sigma | Mean | Median | Sigma |
| A | 15 | 174 | 21440 | 123.73 | 825 | 807 | 166.8 |
| A | 0 | 226 | 7186 | 38.25 | 825 | 807 | 166.8 |
| A | 3 | 137 | 6173 | 32.18 | 825 | 807 | 166.8 |
| B | 7 | 220 | 35366 | 217.12 | 826 | 804 | 159.2 |
| B | 0 | 219 | 32834 | 201.21 | 826 | 804 | 159.2 |
| B | 12 | 111 | 18348 | 110.21 | 826 | 804 | 159.2 |
| C | 3 | 233 | 178104 | 954.61 | 793 | 799 | 185.7 |
| C | 14 | 238 | 121859 | 651.79 | 793 | 799 | 185.7 |
| C | 5 | 218 | 46488 | 245.99 | 793 | 799 | 185.7 |
| D | 7 | 238 | 314417 | 1627.63 | 798 | 779 | 192.7 |
| D | 5 | 222 | 188915 | 976.34 | 798 | 779 | 192.7 |
| D | 12 | 233 | 180340 | 931.84 | 798 | 779 | 192.7 |
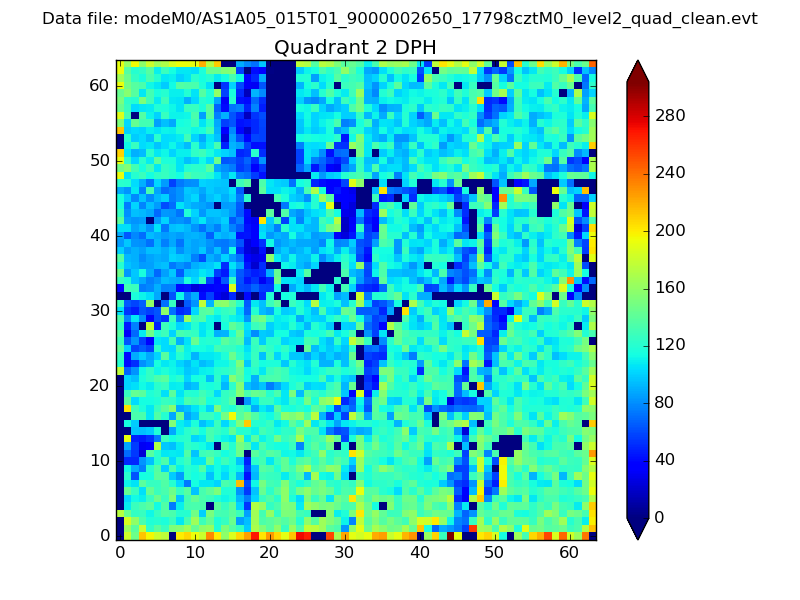
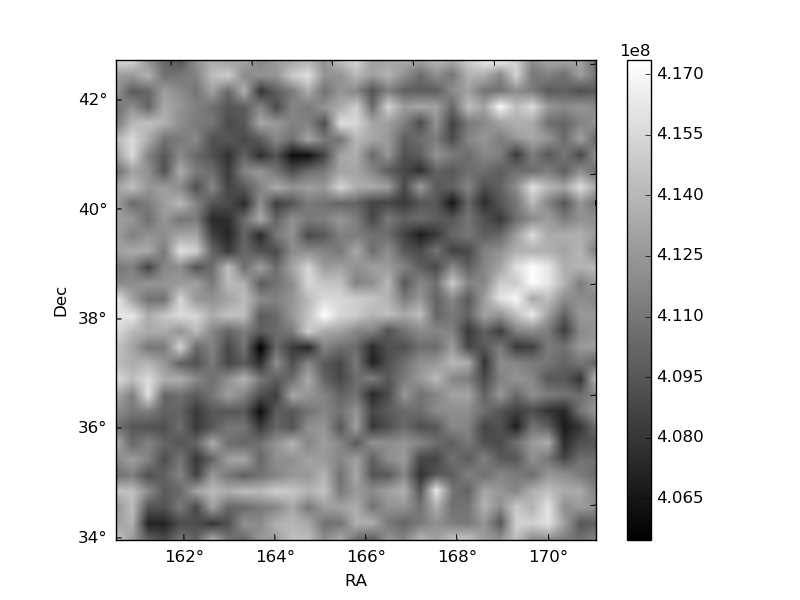
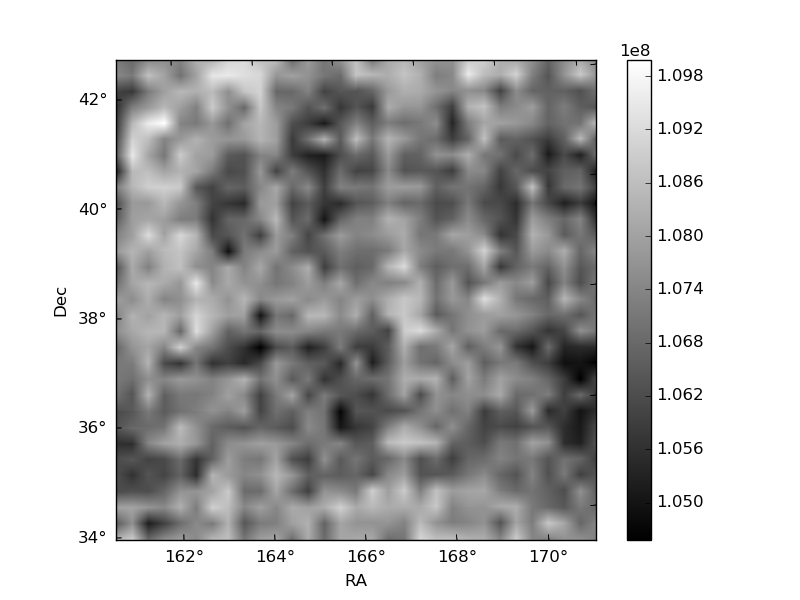
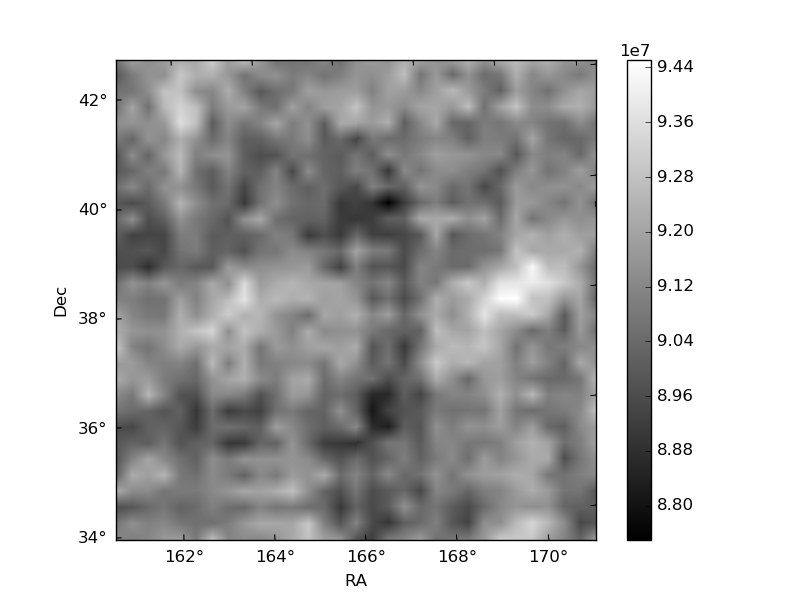
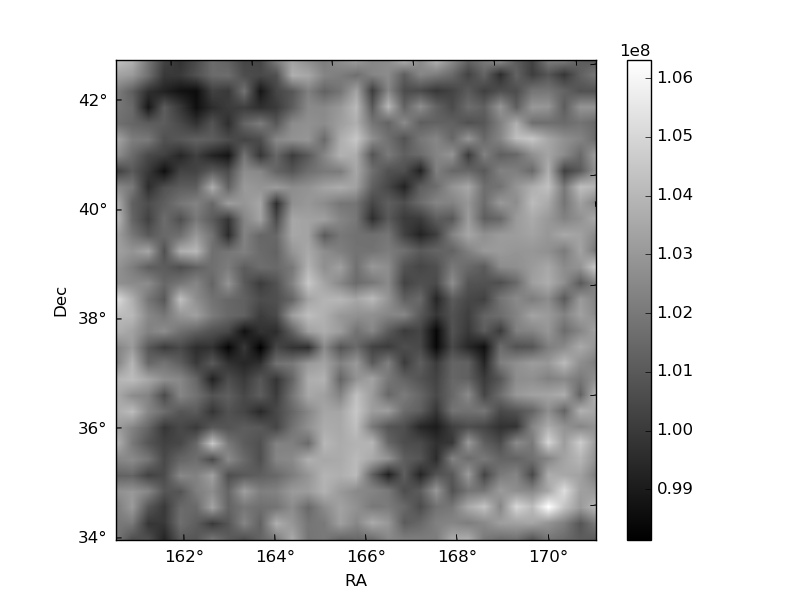
Histogram calculated using DETX and DETY for each event in the final _common_clean file
| Quadrant A | 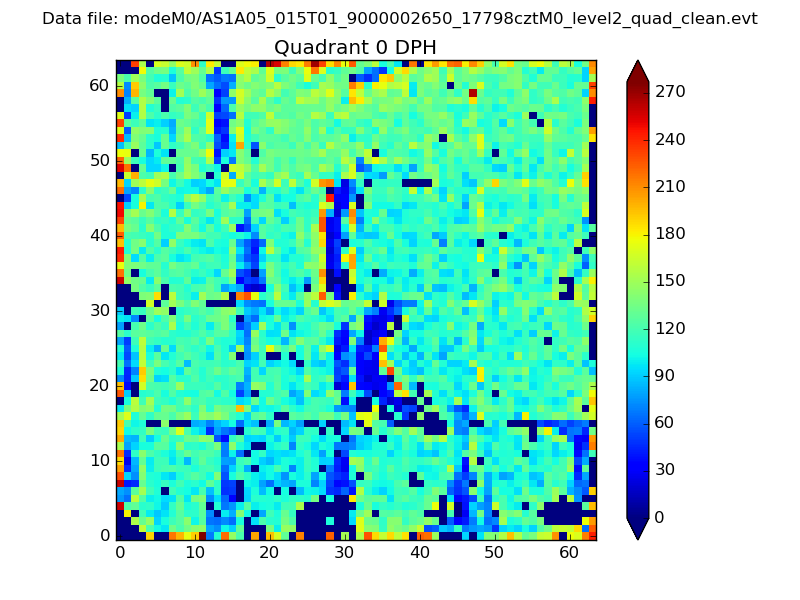 |
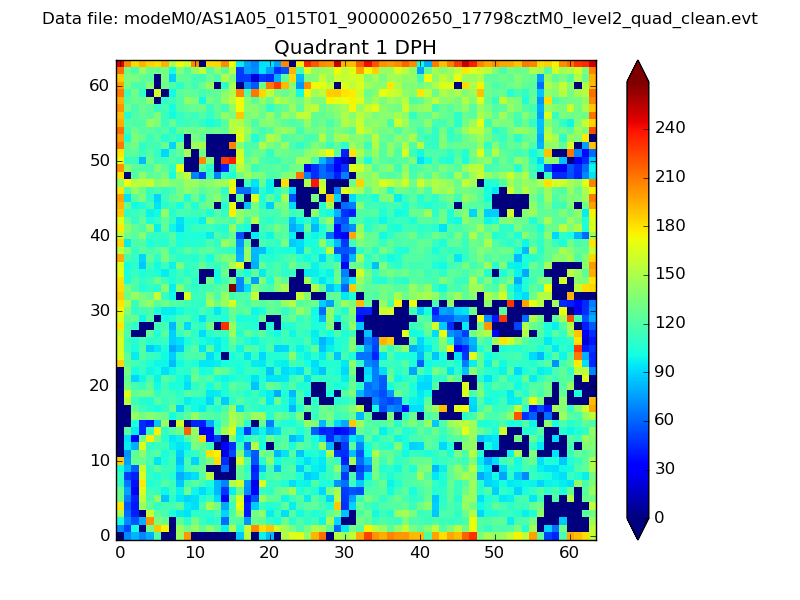 |
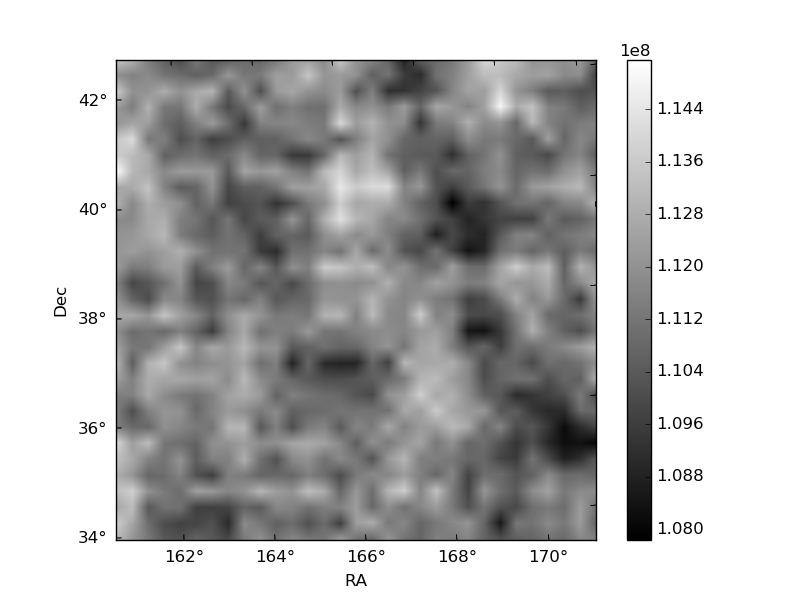
Quadrant B |
|---|---|---|---|
| Quadrant D | 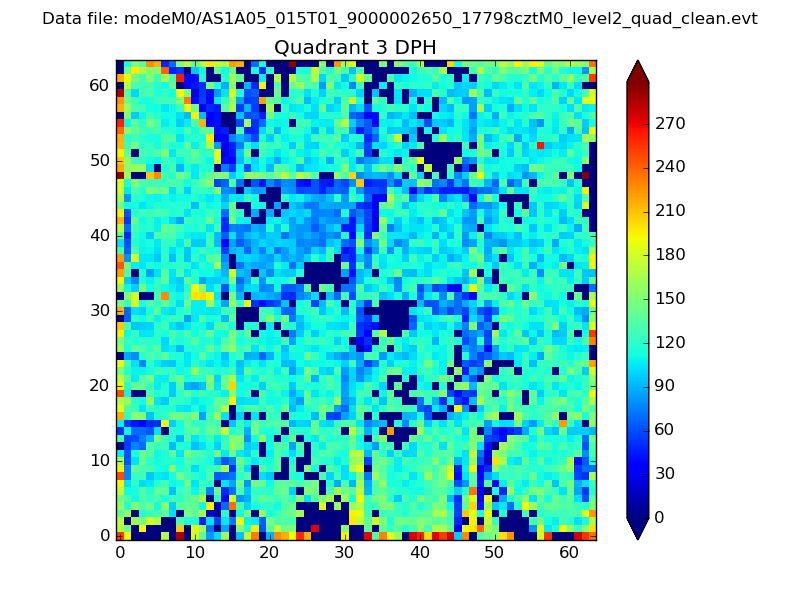 |
 |
Quadrant C |
| Plot type | Count rate plots | Images |
|---|---|---|
| Comparison with Poisson distribution Blue bars denote a histogram of data divided into 1 sec bins. Red curve is a Poisson curve with rate = median count rate of data. |
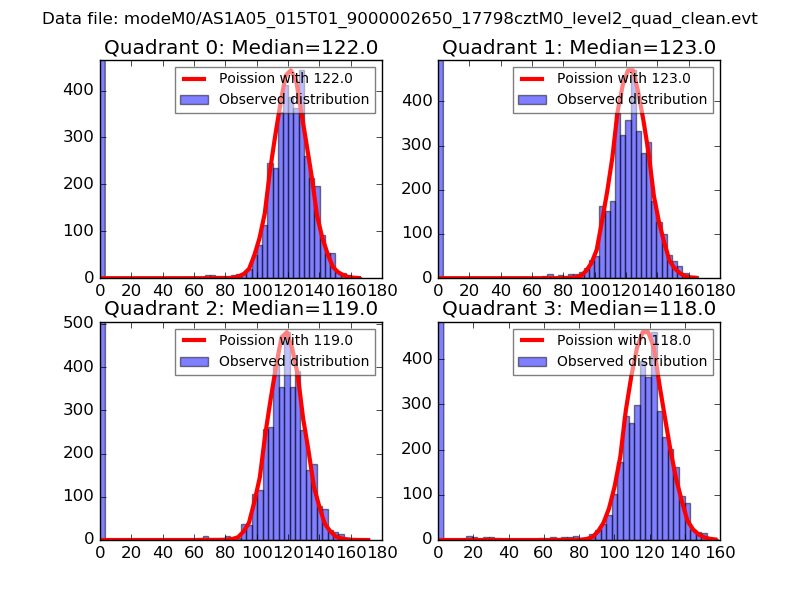 |
 |
| Quadrant-wise count rates Data is divided into 100 sec bins |
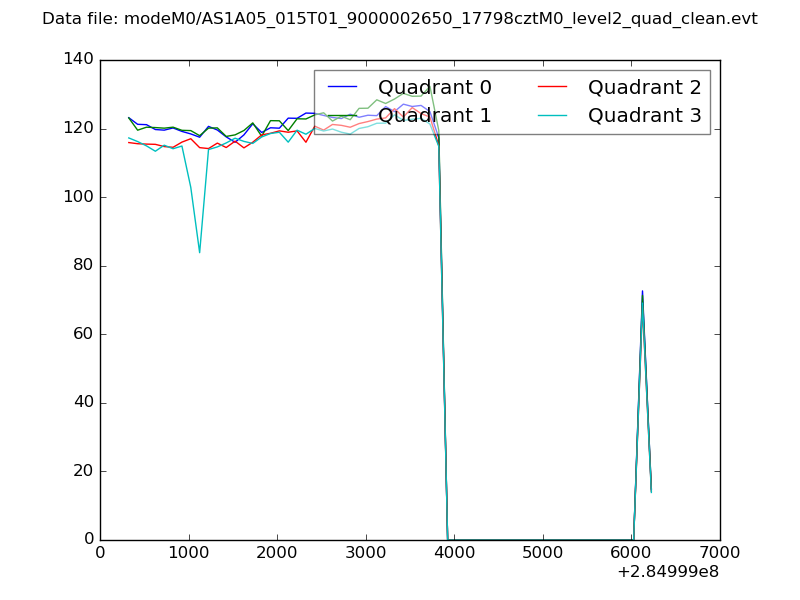 |
|
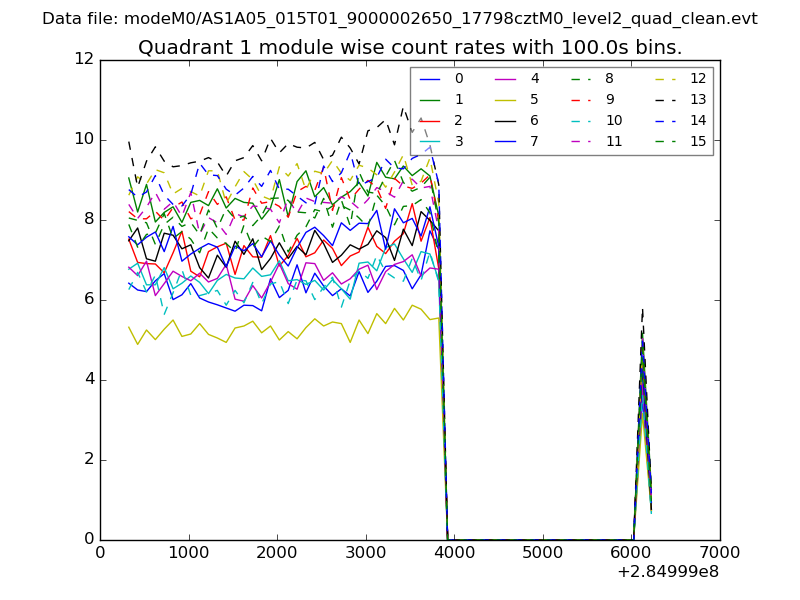
| Module-wise count rates for Quadrant A Data is divided into 100 sec bins |
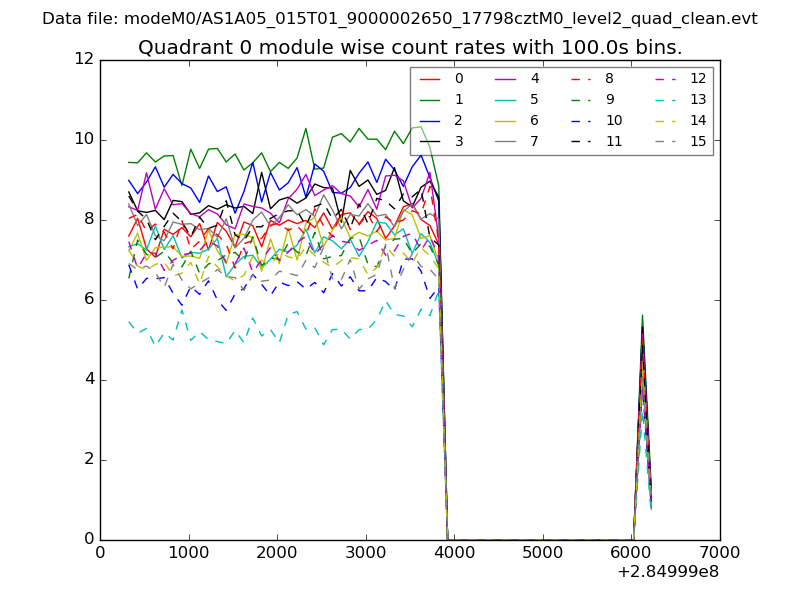 |
 |
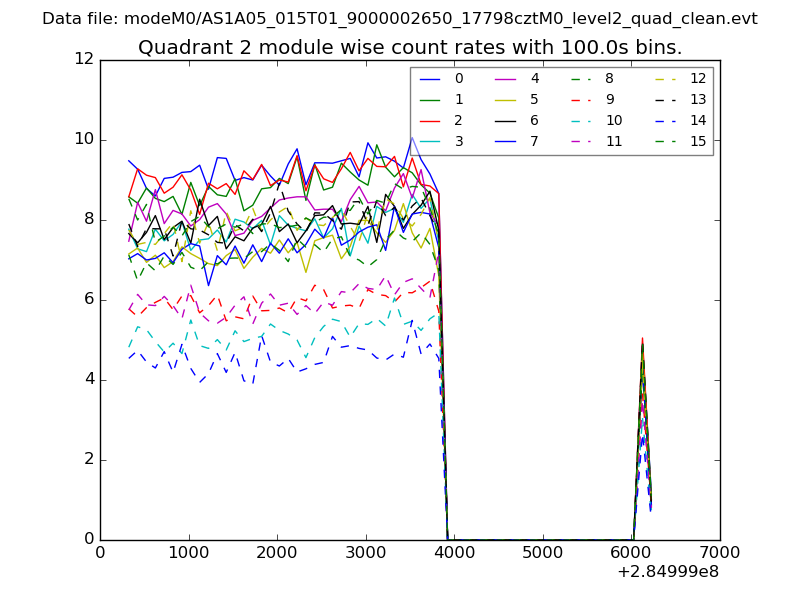
| Module-wise count rates for Quadrant B Data is divided into 100 sec bins |
 |
 |
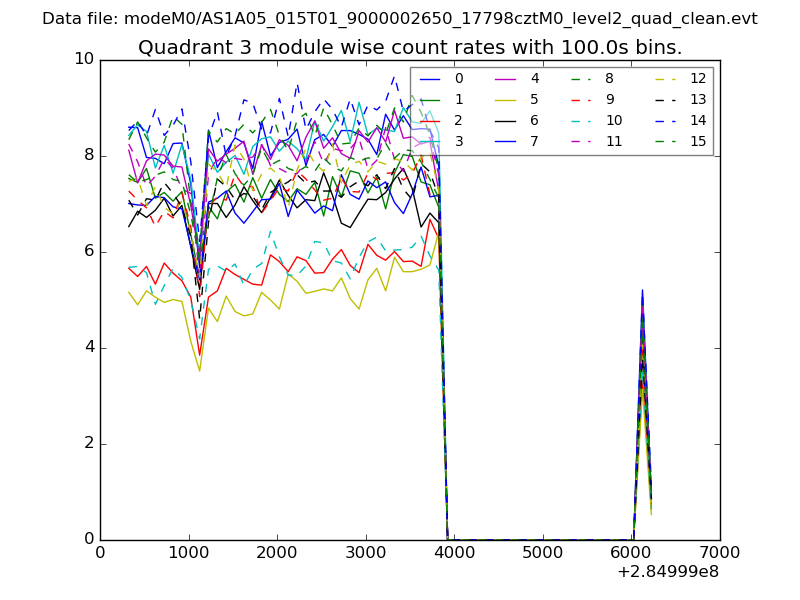
| Module-wise count rates for Quadrant C Data is divided into 100 sec bins |
 |
 |
| Module-wise count rates for Quadrant D Data is divided into 100 sec bins |
 |
 |
| Parameter | Plot |
|---|---|
| CZT HV Monitor | 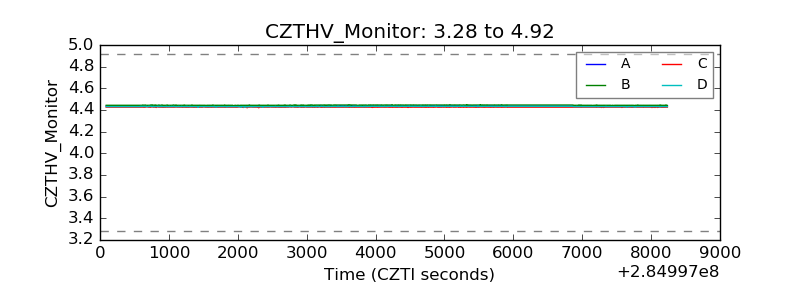 |
| D_VDD | 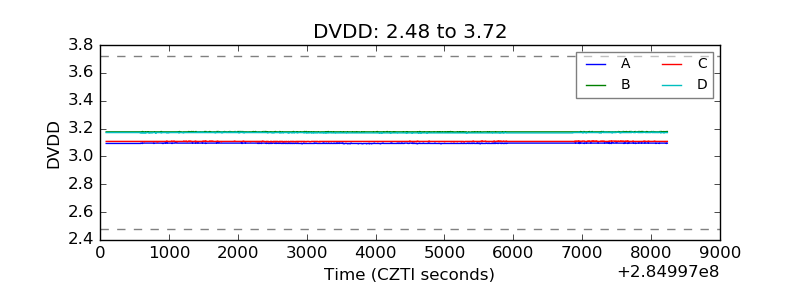 |
| Temperature 1 |  |
| Veto HV Monitor | 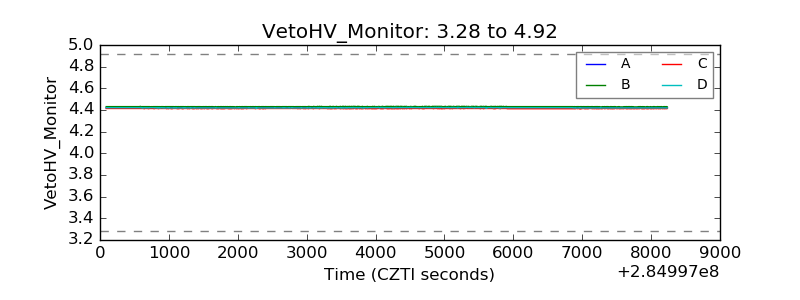 |
| Veto LLD | 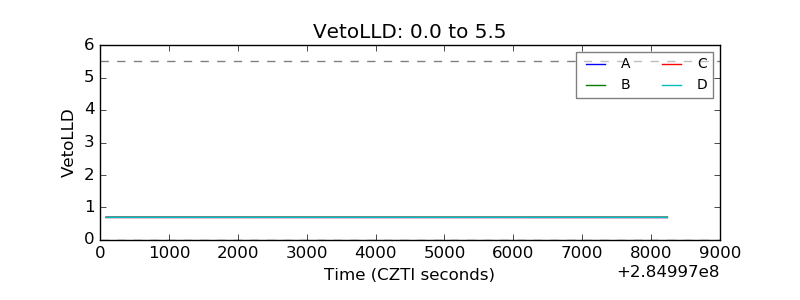 |
| Alpha Counter | 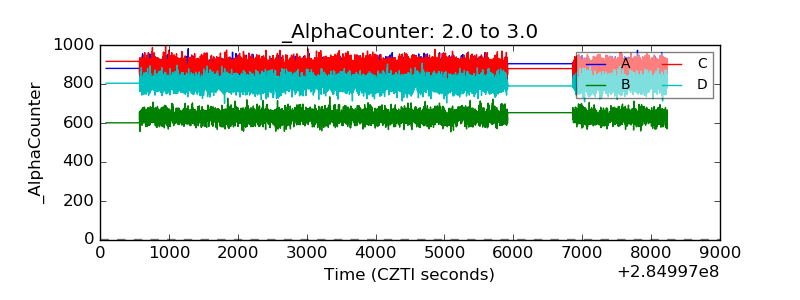 |
| _CPM_Rate | 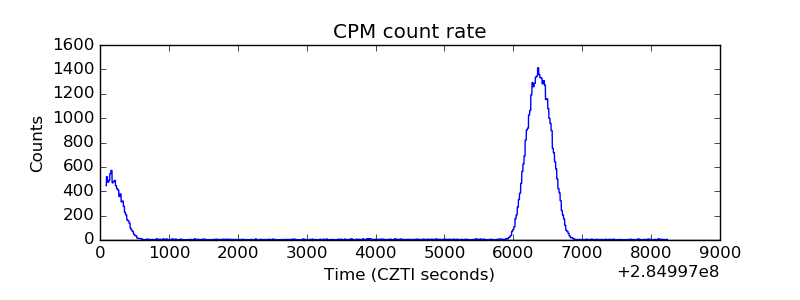 |
| CZT Counter | 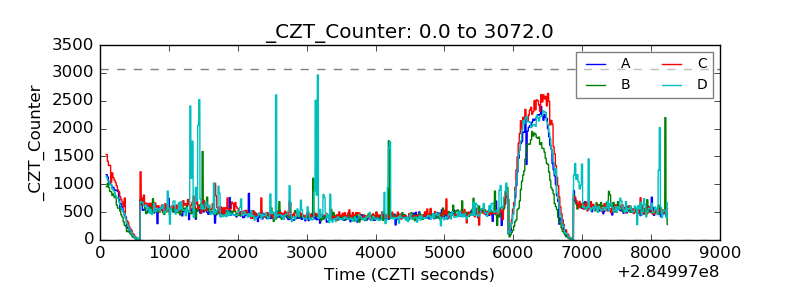 |
| +2.5 Volts monitor |  |
| +5 Volts monitor |  |
| _ROLL_ROT | 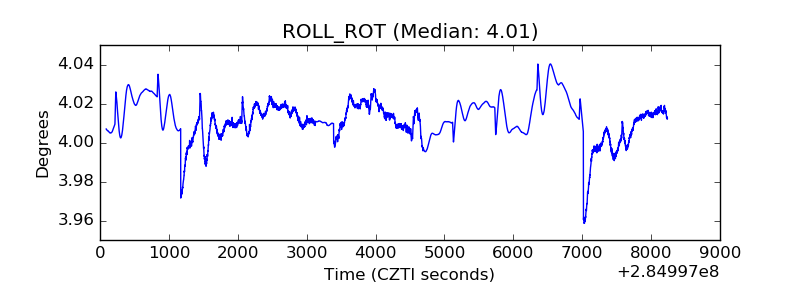 |
| _Roll_DEC | 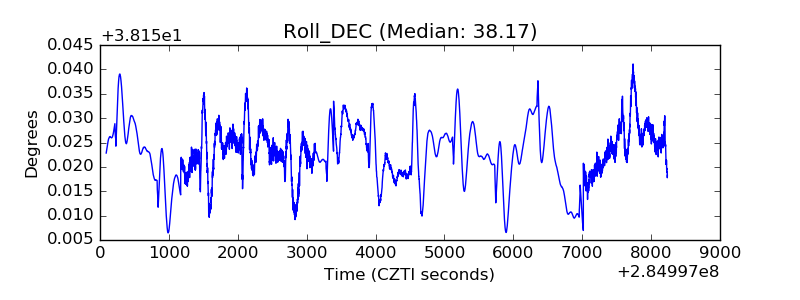 |
| _Roll_RA | 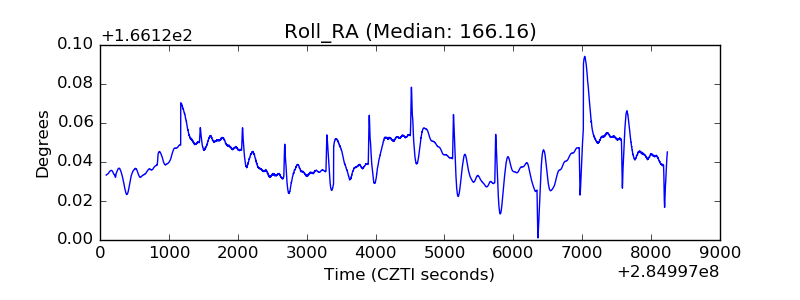 |
| Veto Counter |  |