| Param | Original file | Final file |
|---|---|---|
| Filename | modeM0/AS1A05_015T01_9000002650_17799cztM0_level2.evt | modeM0/AS1A05_015T01_9000002650_17799cztM0_level2_quad_clean.evt |
| Size (bytes) | 492,897,600 | 88,424,640 |
| Size | 470.1 MB | 84.3 MB |
| Events in quadrant A | 3,573,696 | 550,169 |
| Events in quadrant B | 3,526,026 | 565,395 |
| Events in quadrant C | 3,470,994 | 546,296 |
| Events in quadrant D | 3,894,528 | 541,514 |
| Mode SS | |||
|---|---|---|---|
| Quadrant | BADHDUFLAG | Total packets | Discarded packets |
| A | 0 | 142 | 0 |
| B | 0 | 142 | 0 |
| C | 0 | 142 | 0 |
| D | 0 | 142 | 0 |
| Mode M9 | |||
|---|---|---|---|
| Quadrant | BADHDUFLAG | Total packets | Discarded packets |
| A | 0 | 20 | 0 |
| B | 0 | 20 | 0 |
| C | 0 | 20 | 0 |
| D | 0 | 20 | 0 |
| Mode M0 | |||
|---|---|---|---|
| Quadrant | BADHDUFLAG | Total packets | Discarded packets |
| A | 0 | 15154 | 2 |
| B | 0 | 15021 | 2 |
| C | 0 | 14738 | 2 |
| D | 0 | 16289 | 2 |
| Quadrant | Total seconds | Saturated seconds | Saturation percentage |
|---|---|---|---|
| A | 6800 | 161 | 2.367647% |
| B | 6801 | 83 | 1.220409% |
| C | 6801 | 109 | 1.602705% |
| D | 6801 | 169 | 2.484929% |
Noise dominated data is calculated using 1-second bins in cleaned event files. If a bin has >2000 counts, and if more than 50% of those come from <1% of pixels, then it is considered to be noise-dominated and hence unusable.
| Quadrant | # 1 sec bins | Bins with >0 counts | Bins with >2000 counts | High rate bins dominated by noise | Noise dominated (total time) | Noise dominated (detector-on time) | Marked lightcurve |
|---|---|---|---|---|---|---|---|
| A | 8850 | 6802 | 91 | 91 | 1.03% | 1.34% | 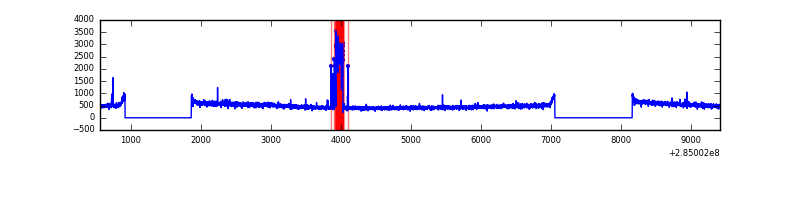 |
| B | 8851 | 6803 | 12 | 12 | 0.14% | 0.18% | 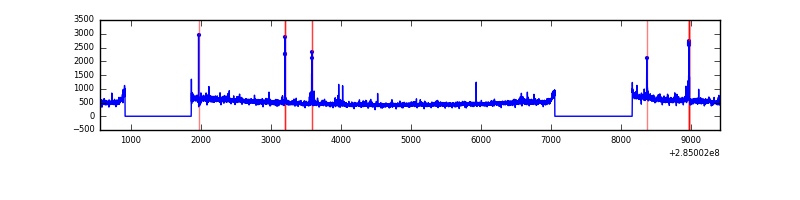 |
| C | 8851 | 6802 | 0 | 0 | 0.00% | 0.00% |  |
| D | 8851 | 6803 | 65 | 65 | 0.73% | 0.96% |  |
Top three noisy pixels from each quadrant. If the there are fewer than three noisy pixels in the level2.evt file, extra rows are filled as -1
| Pixel properties | Quadrant properties | ||||||
|---|---|---|---|---|---|---|---|
| Quadrant | DetID | PixID | Counts | Sigma | Mean | Median | Sigma |
| A | 15 | 174 | 307981 | 1783.98 | 849 | 828 | 172.2 |
| A | 0 | 226 | 7468 | 38.57 | 849 | 828 | 172.2 |
| A | 12 | 194 | 6230 | 31.38 | 849 | 828 | 172.2 |
| B | 0 | 219 | 55681 | 336.71 | 857 | 838 | 162.9 |
| B | 3 | 64 | 27599 | 164.3 | 857 | 838 | 162.9 |
| B | 6 | 36 | 25112 | 149.03 | 857 | 838 | 162.9 |
| C | 14 | 238 | 128498 | 656.59 | 829 | 837 | 194.4 |
| C | 3 | 233 | 68945 | 350.29 | 829 | 837 | 194.4 |
| C | 5 | 218 | 38443 | 193.42 | 829 | 837 | 194.4 |
| D | 7 | 238 | 397521 | 1978.26 | 832 | 812 | 200.5 |
| D | 5 | 222 | 187508 | 930.99 | 832 | 812 | 200.5 |
| D | 10 | 70 | 47879 | 234.71 | 832 | 812 | 200.5 |
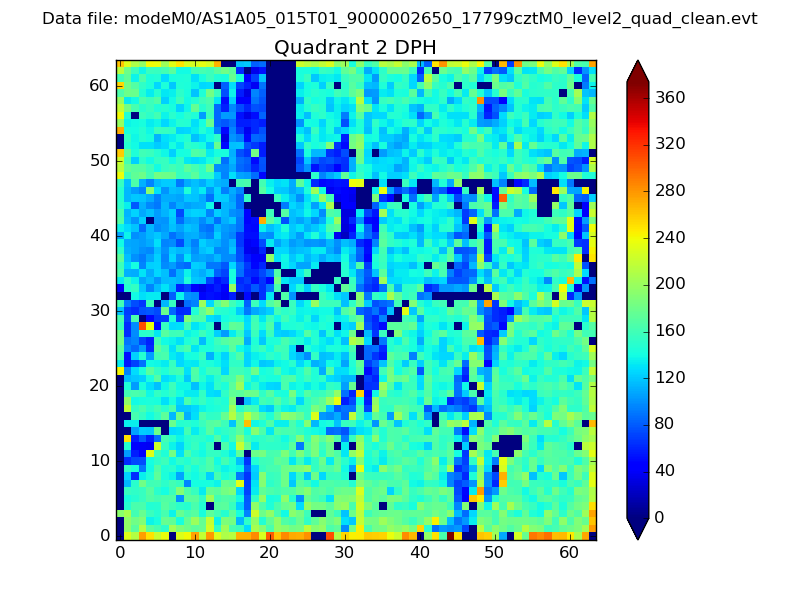
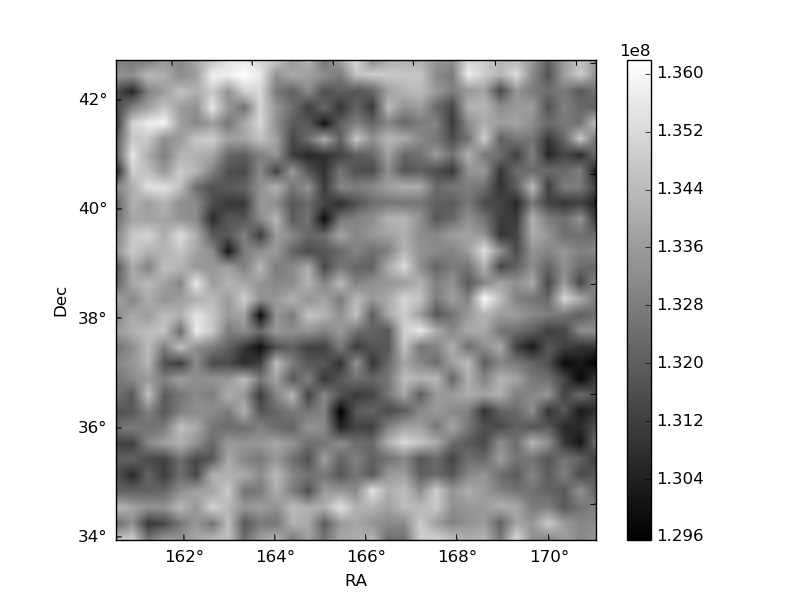
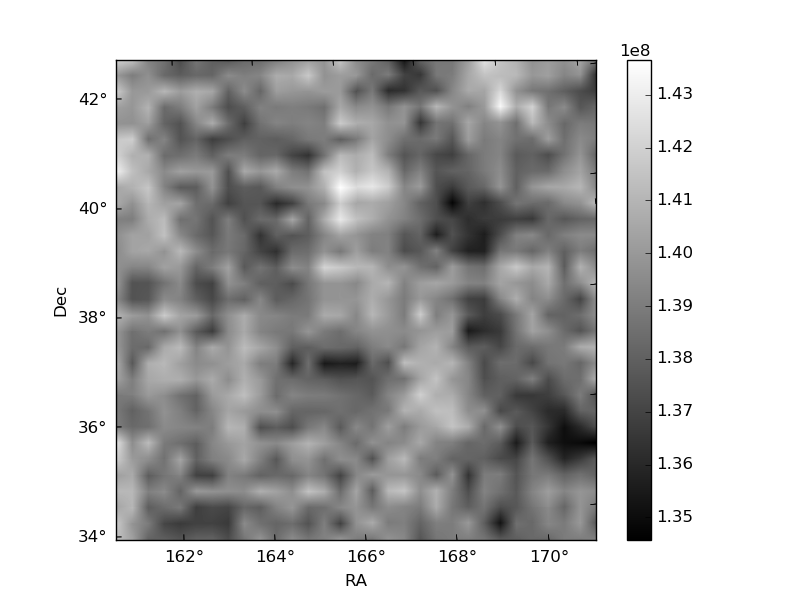
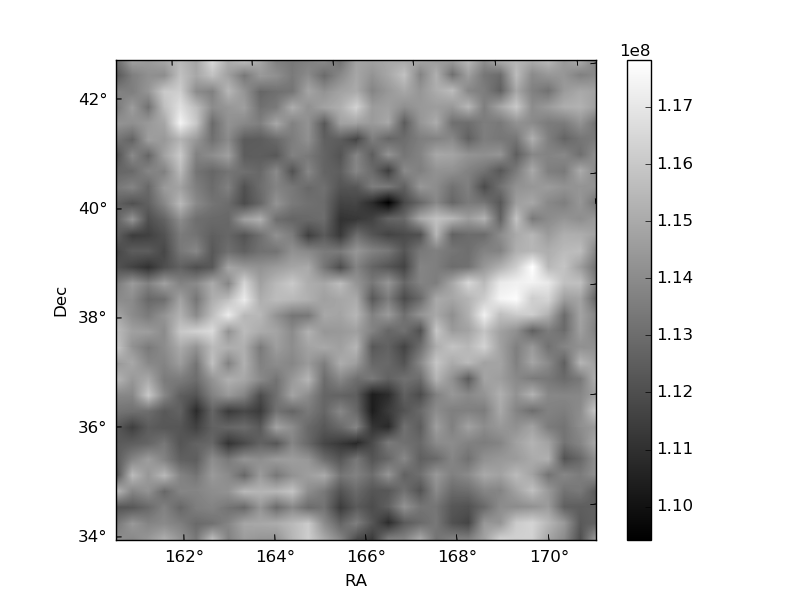
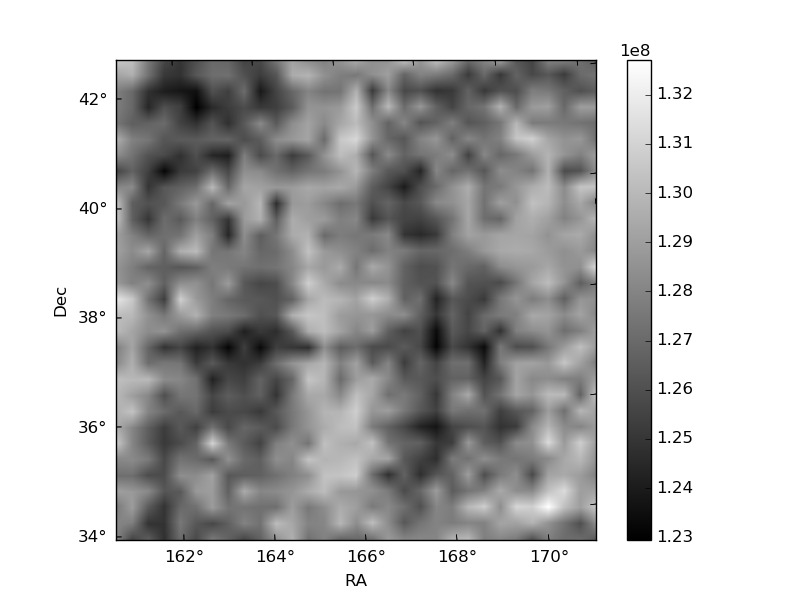
Histogram calculated using DETX and DETY for each event in the final _common_clean file
| Quadrant A | 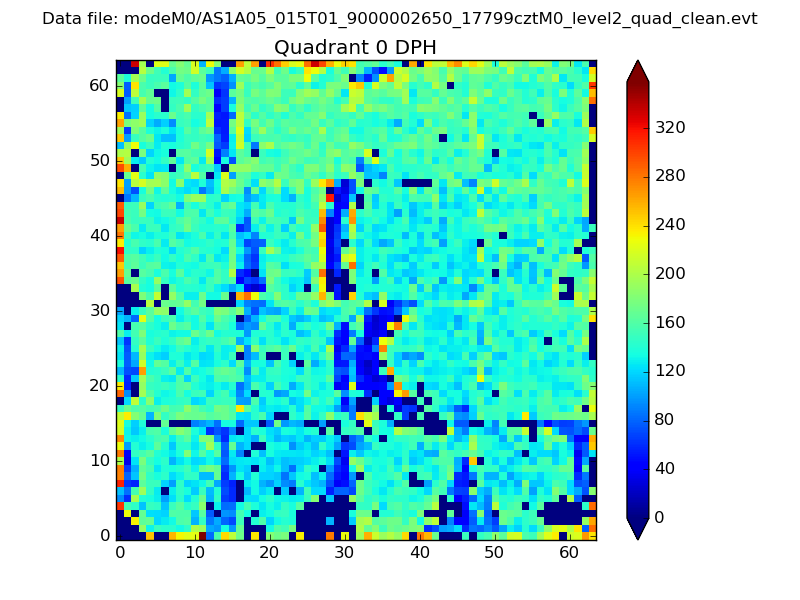 |
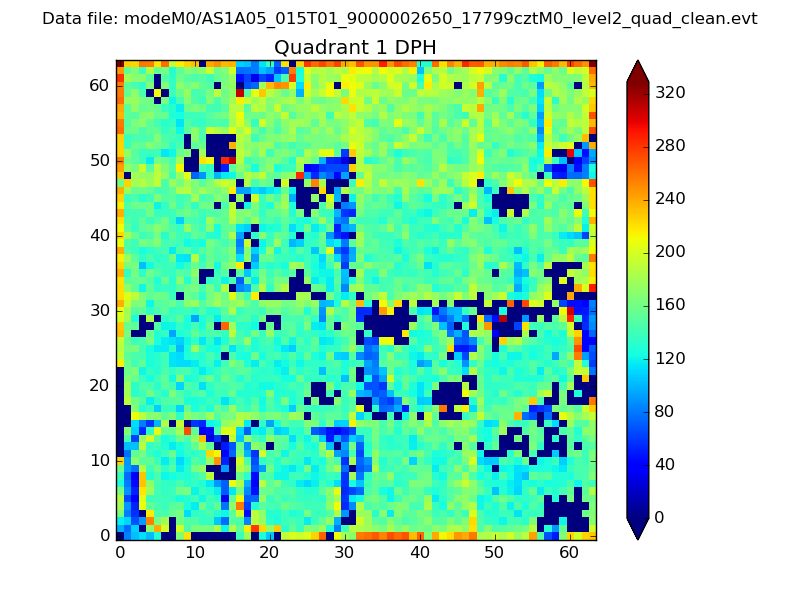 |
Quadrant B |
|---|---|---|---|
| Quadrant D | 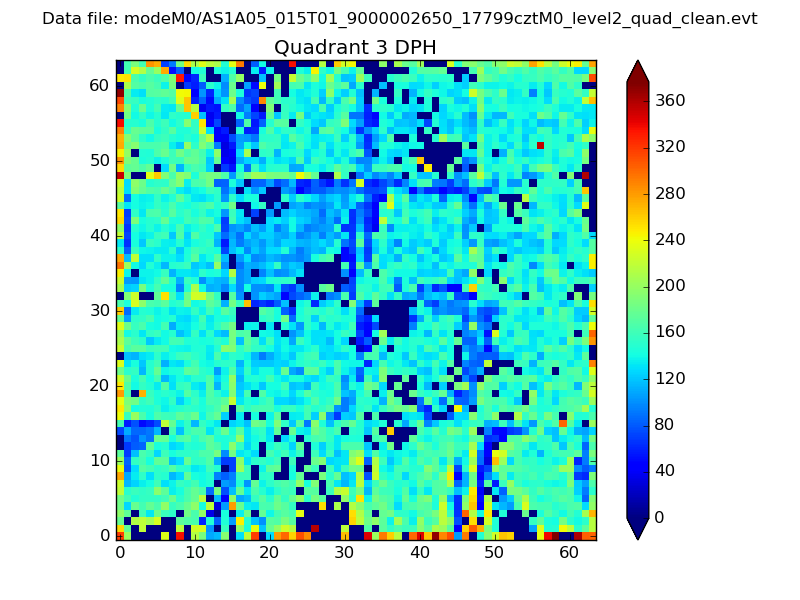 |
 |
Quadrant C |
| Plot type | Count rate plots | Images |
|---|---|---|
| Comparison with Poisson distribution Blue bars denote a histogram of data divided into 1 sec bins. Red curve is a Poisson curve with rate = median count rate of data. |
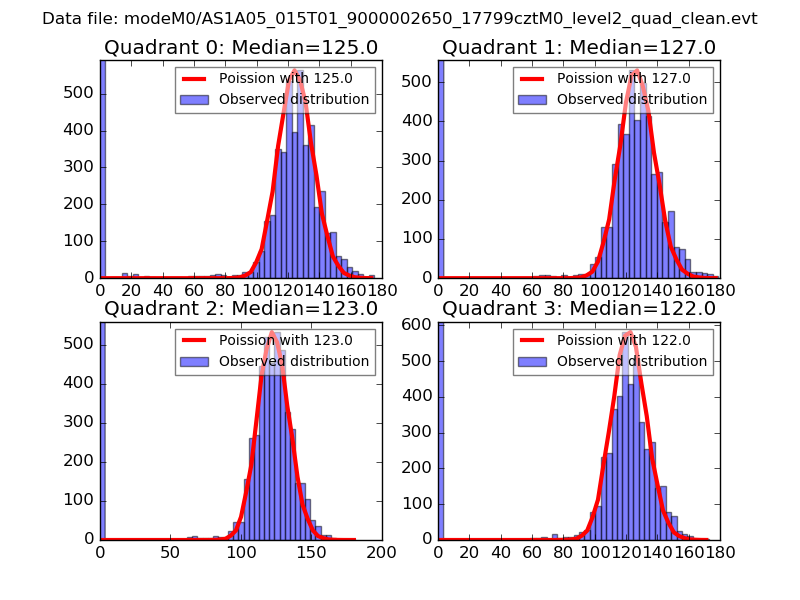 |
 |
| Quadrant-wise count rates Data is divided into 100 sec bins |
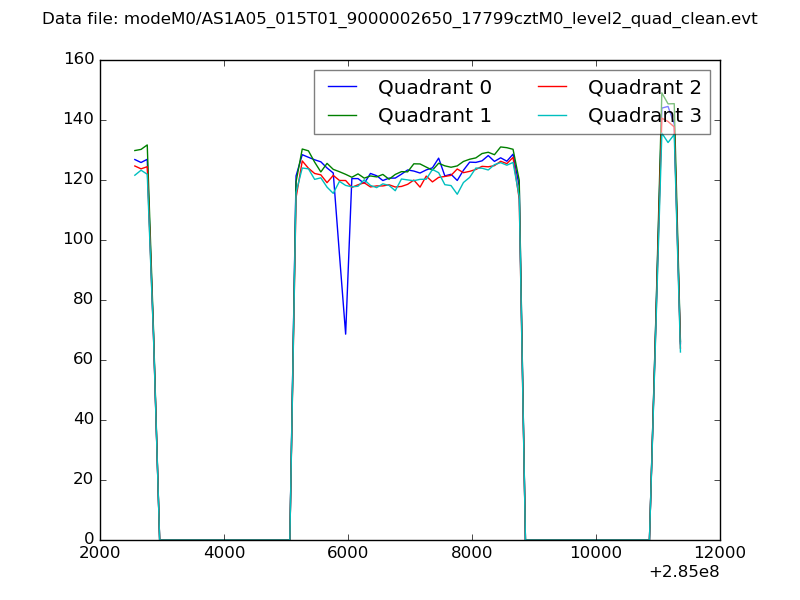 |
|
| Module-wise count rates for Quadrant A Data is divided into 100 sec bins |
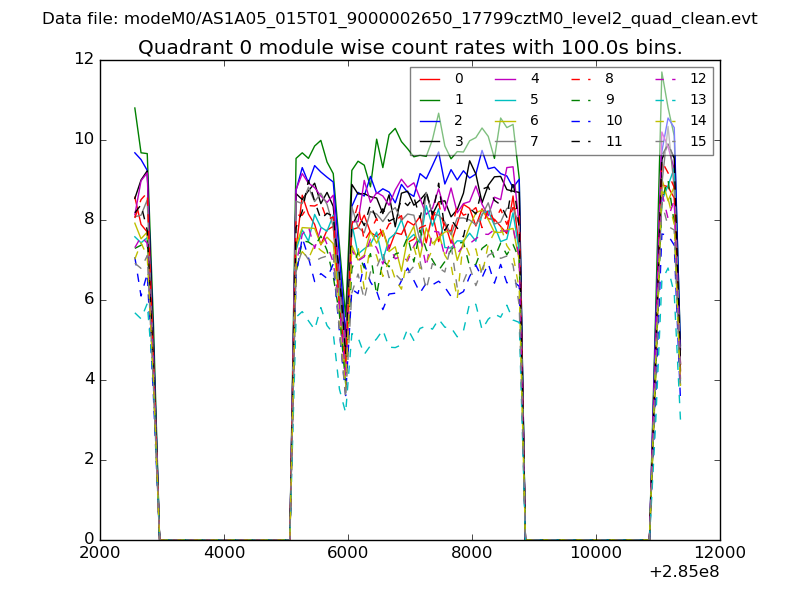 |
 |
| Module-wise count rates for Quadrant B Data is divided into 100 sec bins |
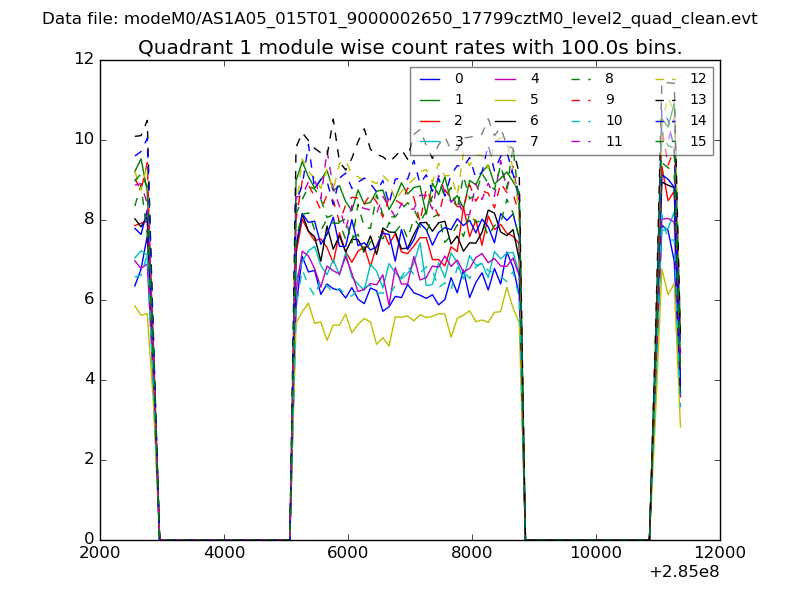 |
 |
| Module-wise count rates for Quadrant C Data is divided into 100 sec bins |
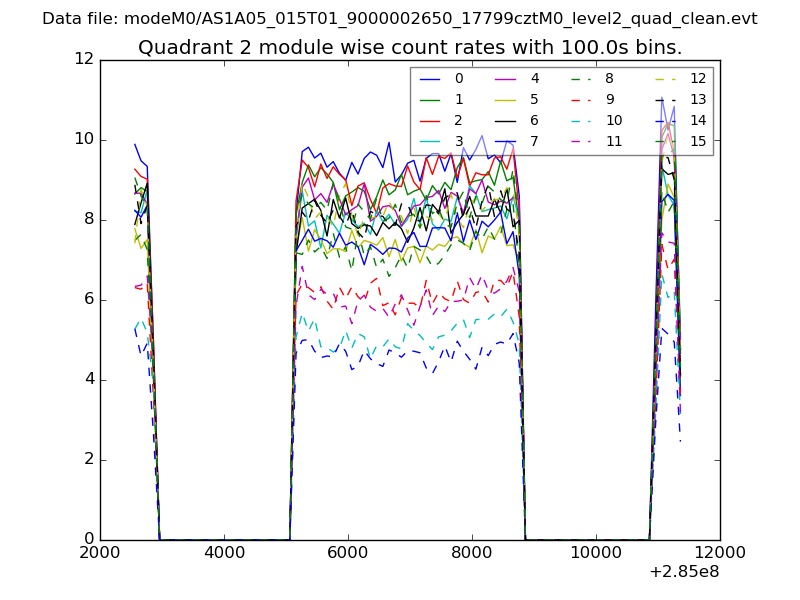 |
 |
| Module-wise count rates for Quadrant D Data is divided into 100 sec bins |
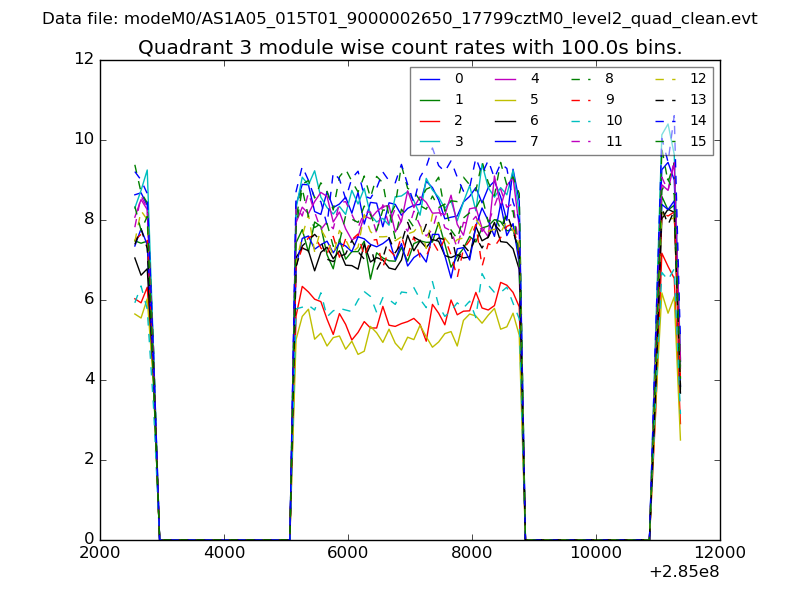 |
 |
| Parameter | Plot |
|---|---|
| CZT HV Monitor | 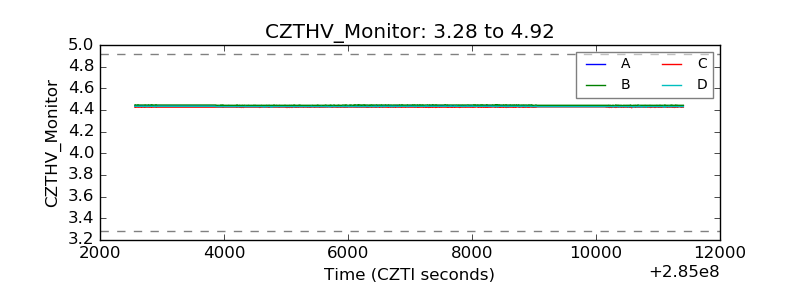 |
| D_VDD | 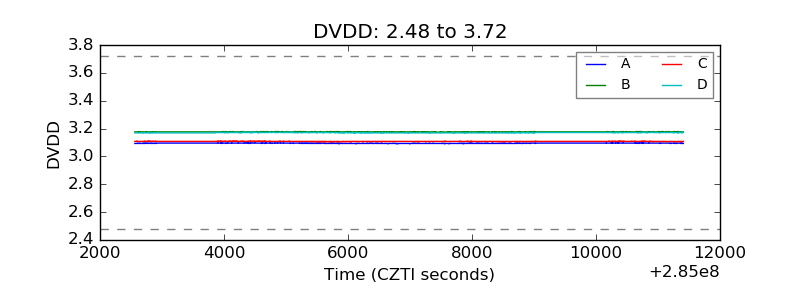 |
| Temperature 1 | 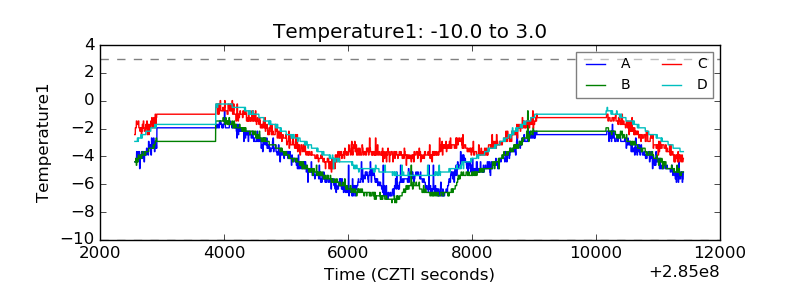 |
| Veto HV Monitor |  |
| Veto LLD | 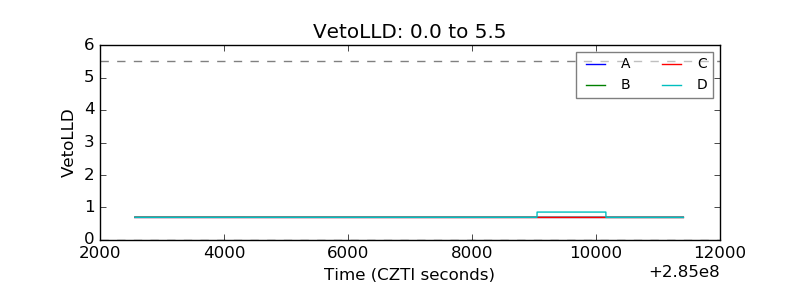 |
| Alpha Counter | 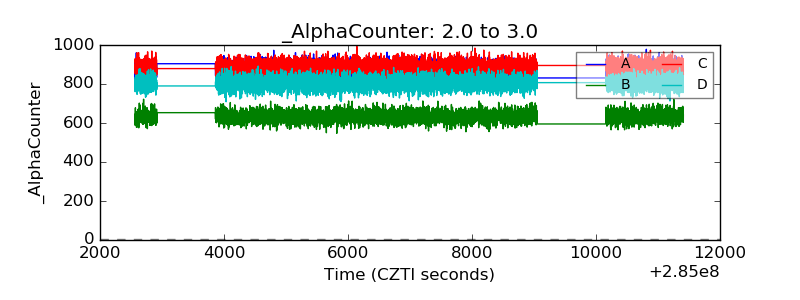 |
| _CPM_Rate | 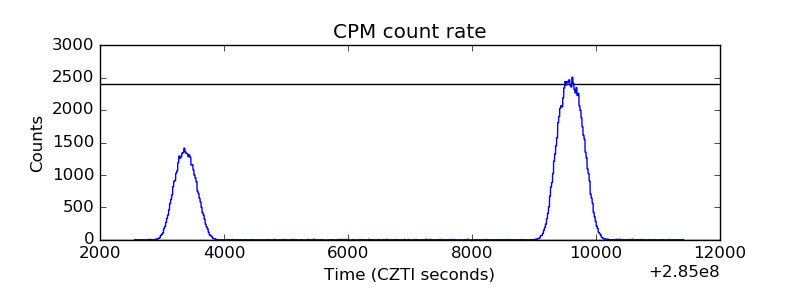 |
| CZT Counter | 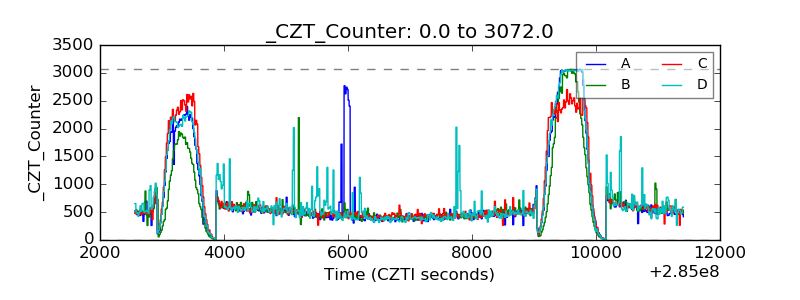 |
| +2.5 Volts monitor |  |
| +5 Volts monitor |  |
| _ROLL_ROT | 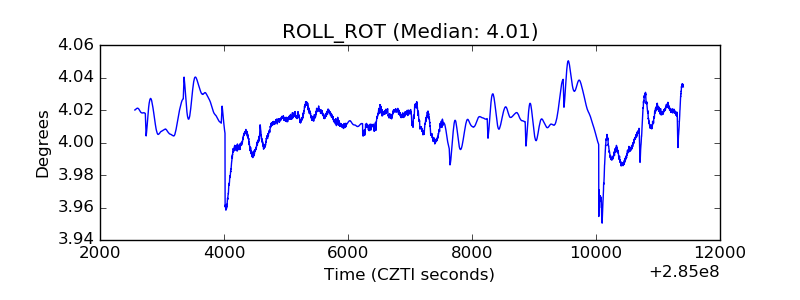 |
| _Roll_DEC | 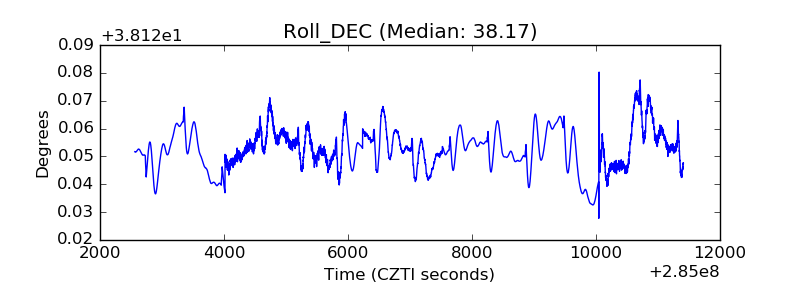 |
| _Roll_RA | 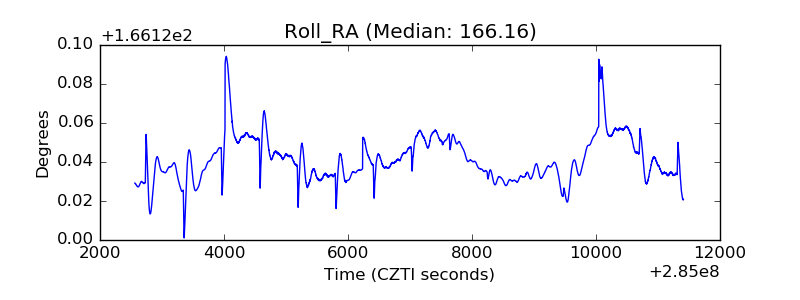 |
| Veto Counter | 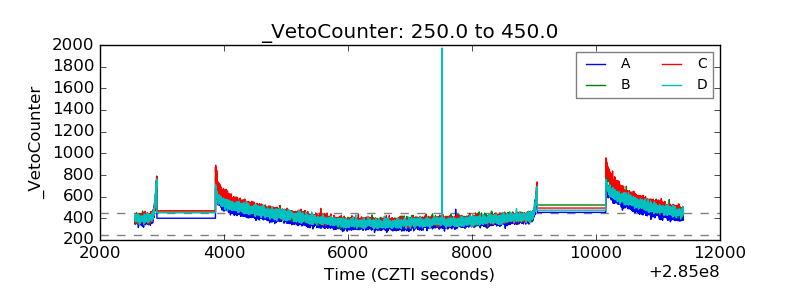 |