| Param | Original file | Final file |
|---|---|---|
| Filename | modeM0/AS1A05_015T01_9000002650_17801cztM0_level2.evt | modeM0/AS1A05_015T01_9000002650_17801cztM0_level2_quad_clean.evt |
| Size (bytes) | 467,755,200 | 91,316,160 |
| Size | 446.1 MB | 87.1 MB |
| Events in quadrant A | 3,103,183 | 588,063 |
| Events in quadrant B | 3,315,830 | 601,203 |
| Events in quadrant C | 3,353,352 | 580,918 |
| Events in quadrant D | 3,971,682 | 561,344 |
| Mode SS | |||
|---|---|---|---|
| Quadrant | BADHDUFLAG | Total packets | Discarded packets |
| A | 0 | 128 | 0 |
| B | 0 | 128 | 0 |
| C | 0 | 128 | 0 |
| D | 0 | 128 | 0 |
| Mode M9 | |||
|---|---|---|---|
| Quadrant | BADHDUFLAG | Total packets | Discarded packets |
| A | 0 | 23 | 0 |
| B | 0 | 23 | 0 |
| C | 0 | 23 | 0 |
| D | 0 | 23 | 0 |
| Mode M0 | |||
|---|---|---|---|
| Quadrant | BADHDUFLAG | Total packets | Discarded packets |
| A | 0 | 13401 | 3 |
| B | 0 | 14103 | 2 |
| C | 0 | 14044 | 2 |
| D | 0 | 16250 | 2 |
| Quadrant | Total seconds | Saturated seconds | Saturation percentage |
|---|---|---|---|
| A | 6214 | 64 | 1.029932% |
| B | 6215 | 90 | 1.448109% |
| C | 6215 | 131 | 2.107804% |
| D | 6215 | 271 | 4.360418% |
Noise dominated data is calculated using 1-second bins in cleaned event files. If a bin has >2000 counts, and if more than 50% of those come from <1% of pixels, then it is considered to be noise-dominated and hence unusable.
| Quadrant | # 1 sec bins | Bins with >0 counts | Bins with >2000 counts | High rate bins dominated by noise | Noise dominated (total time) | Noise dominated (detector-on time) | Marked lightcurve |
|---|---|---|---|---|---|---|---|
| A | 8544 | 6216 | 11 | 11 | 0.13% | 0.18% | 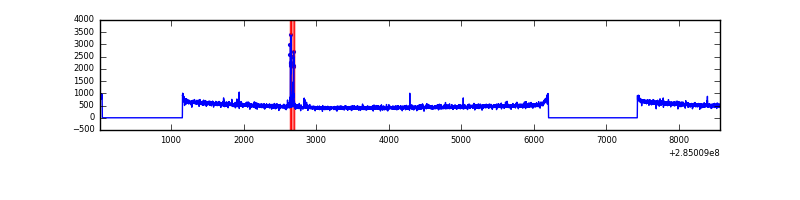 |
| B | 8545 | 6217 | 13 | 13 | 0.15% | 0.21% | 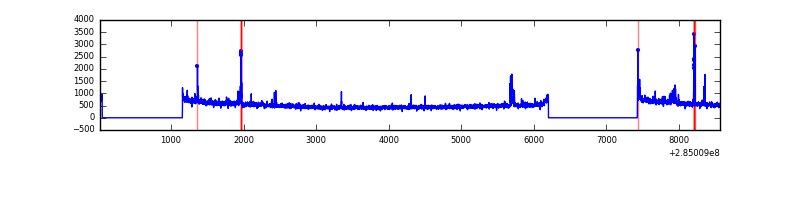 |
| C | 8545 | 6217 | 20 | 20 | 0.23% | 0.32% | 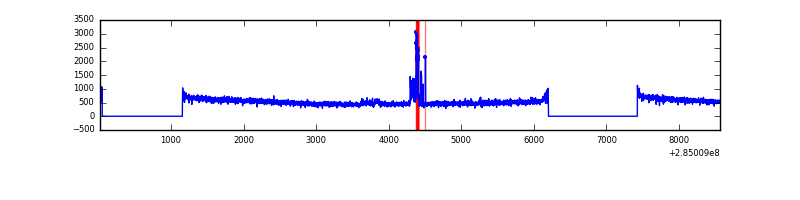 |
| D | 8545 | 6217 | 181 | 181 | 2.12% | 2.91% | 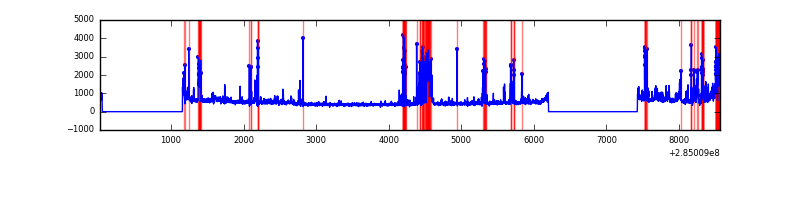 |
Top three noisy pixels from each quadrant. If the there are fewer than three noisy pixels in the level2.evt file, extra rows are filled as -1
| Pixel properties | Quadrant properties | ||||||
|---|---|---|---|---|---|---|---|
| Quadrant | DetID | PixID | Counts | Sigma | Mean | Median | Sigma |
| A | 15 | 174 | 49431 | 306.11 | 794 | 778 | 158.9 |
| A | 0 | 226 | 6810 | 37.95 | 794 | 778 | 158.9 |
| A | 12 | 194 | 5802 | 31.61 | 794 | 778 | 158.9 |
| B | 4 | 48 | 38375 | 249.87 | 802 | 785 | 150.4 |
| B | 0 | 230 | 37987 | 247.29 | 802 | 785 | 150.4 |
| B | 3 | 64 | 27758 | 179.29 | 802 | 785 | 150.4 |
| C | 9 | 54 | 122892 | 677.33 | 775 | 781 | 180.3 |
| C | 14 | 238 | 121888 | 671.76 | 775 | 781 | 180.3 |
| C | 3 | 233 | 46922 | 255.94 | 775 | 781 | 180.3 |
| D | 7 | 238 | 949550 | 5181.42 | 770 | 752 | 183.1 |
| D | 12 | 110 | 25133 | 133.15 | 770 | 752 | 183.1 |
| D | 2 | 234 | 24697 | 130.76 | 770 | 752 | 183.1 |
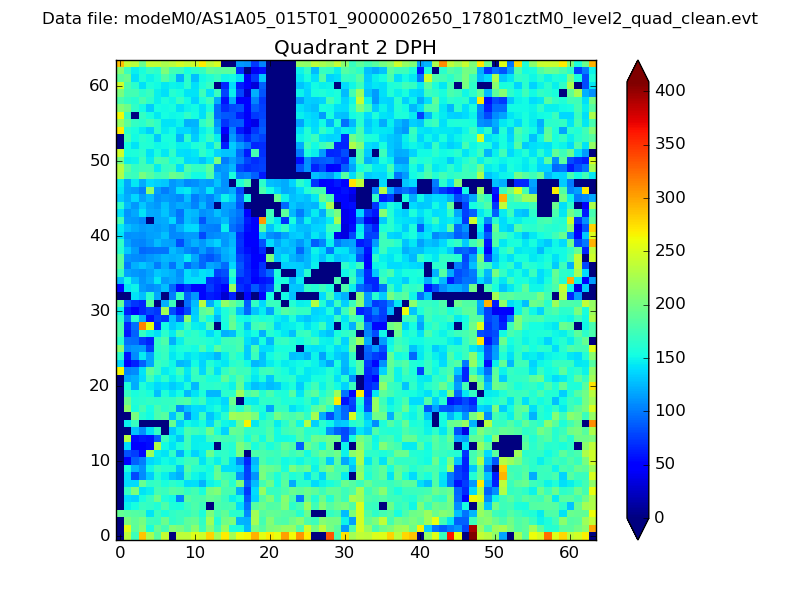
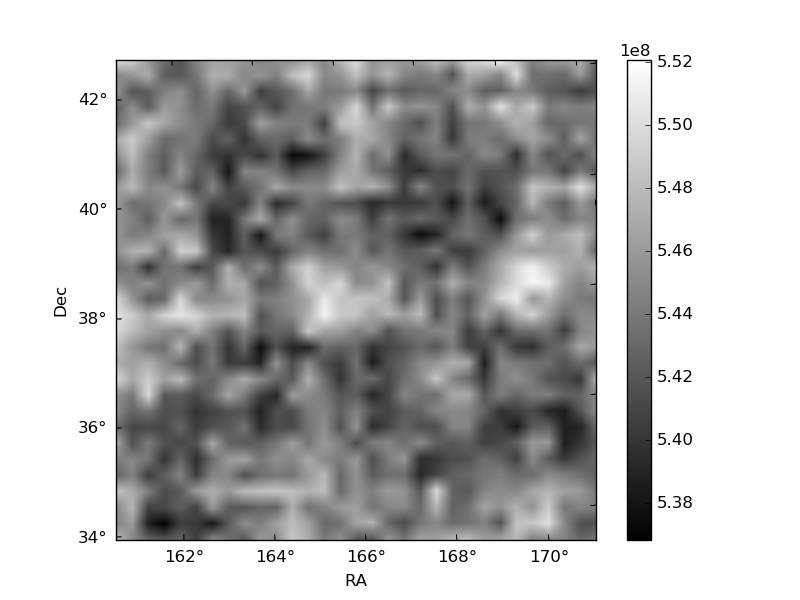
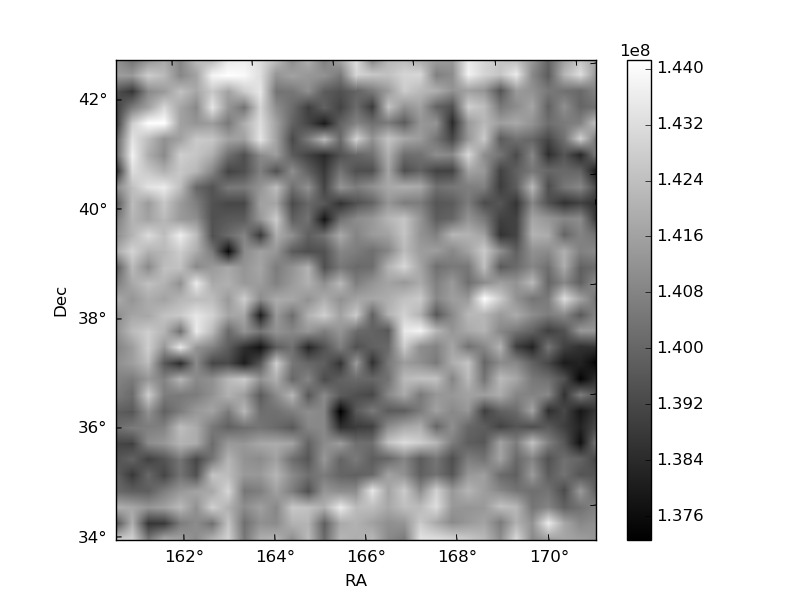
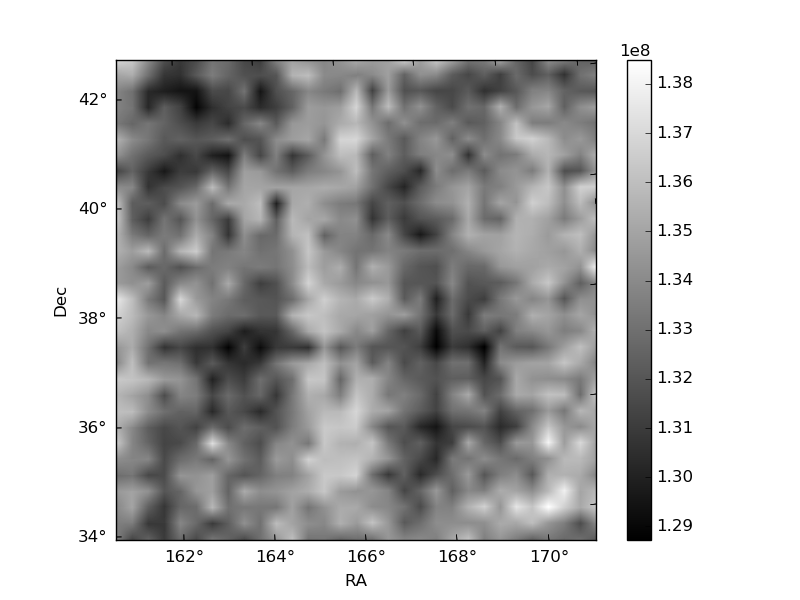
Histogram calculated using DETX and DETY for each event in the final _common_clean file
| Quadrant A | 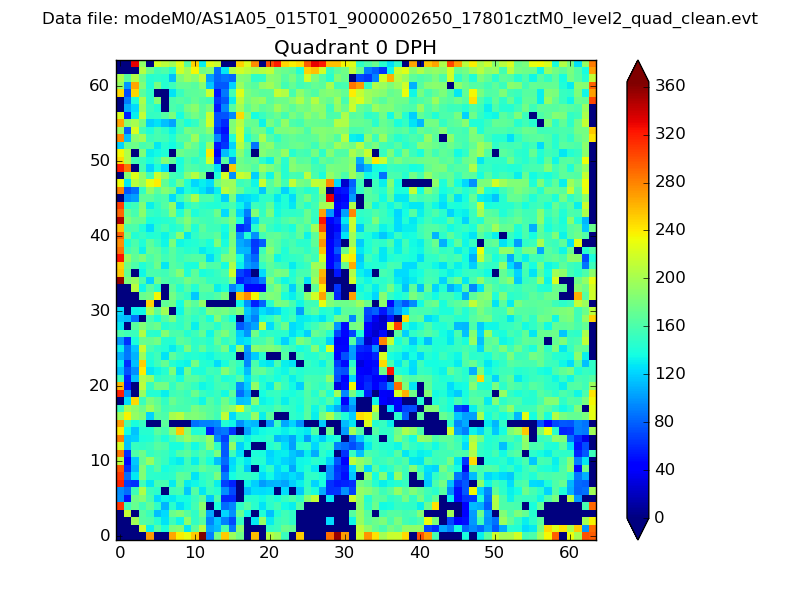 |
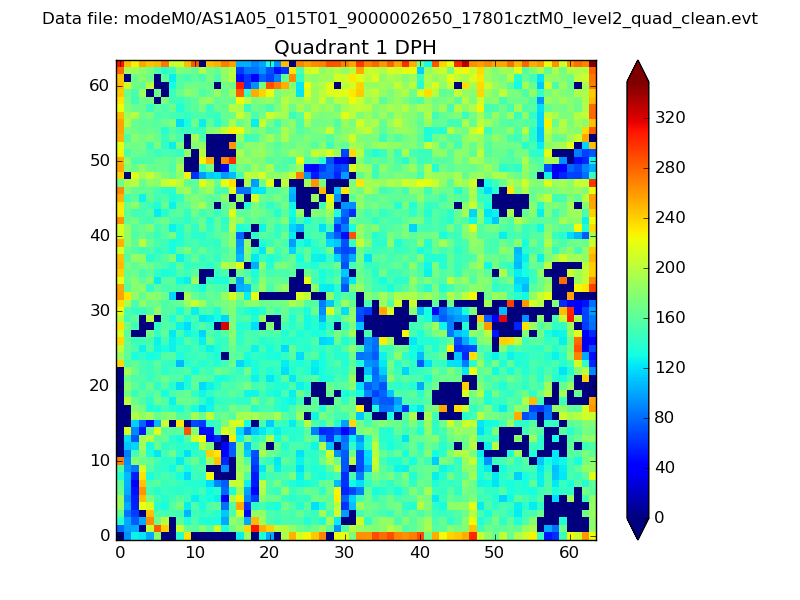 |
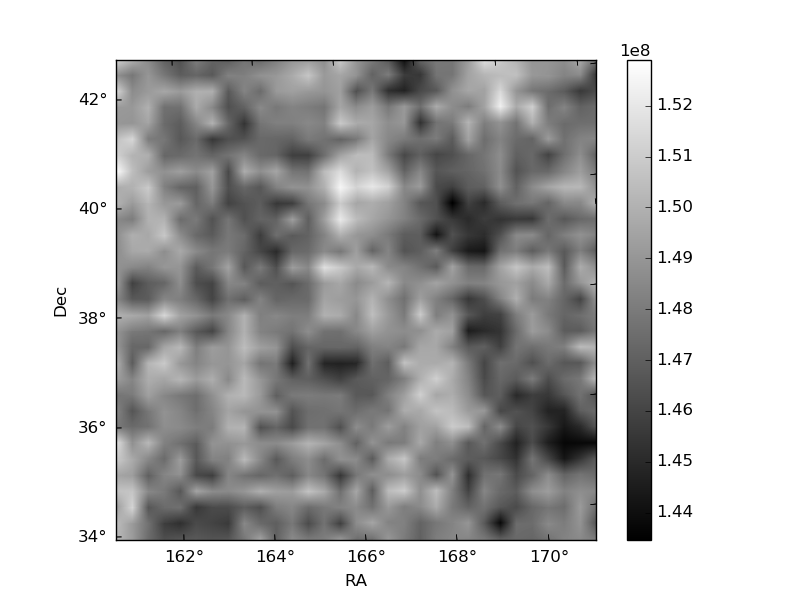
Quadrant B |
|---|---|---|---|
| Quadrant D | 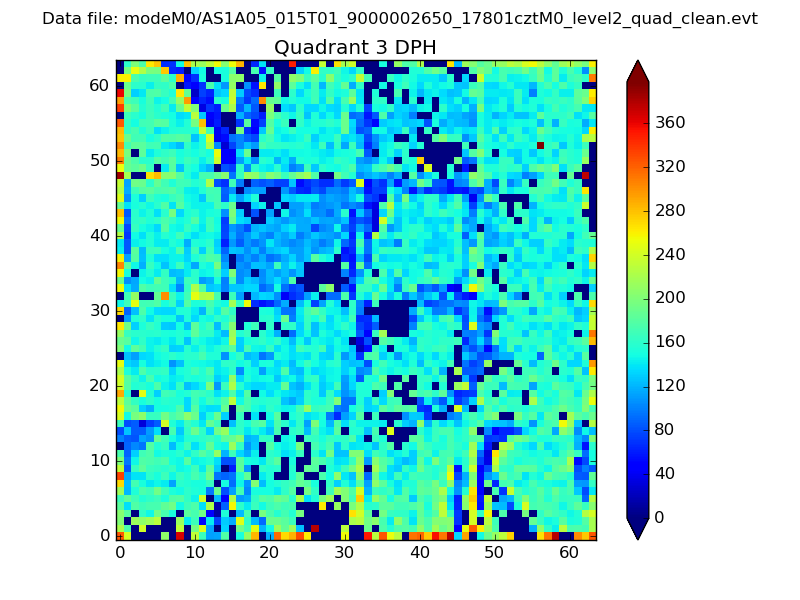 |
 |
Quadrant C |
| Plot type | Count rate plots | Images |
|---|---|---|
| Comparison with Poisson distribution Blue bars denote a histogram of data divided into 1 sec bins. Red curve is a Poisson curve with rate = median count rate of data. |
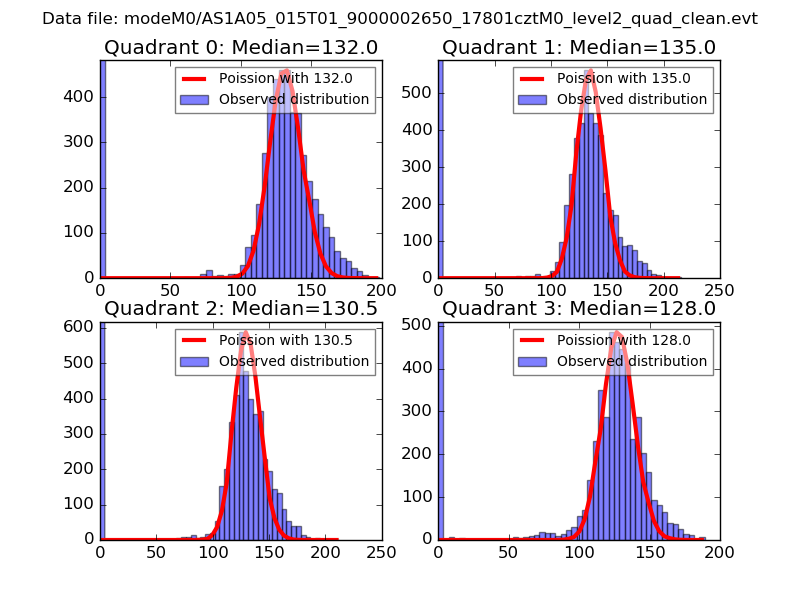 |
 |
| Quadrant-wise count rates Data is divided into 100 sec bins |
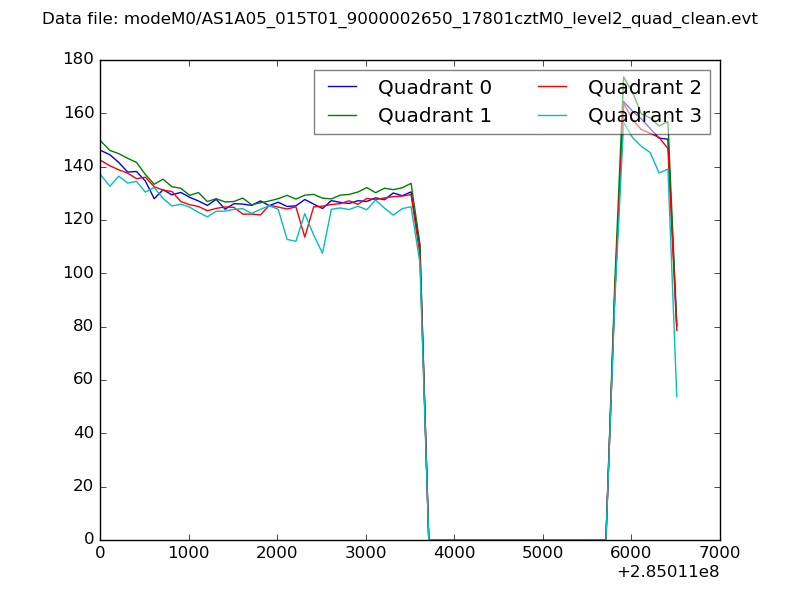 |
|
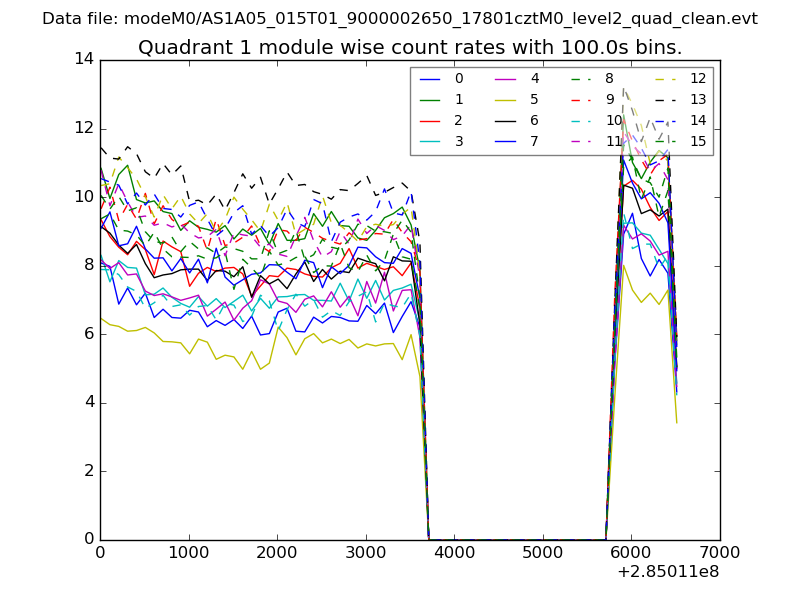
| Module-wise count rates for Quadrant A Data is divided into 100 sec bins |
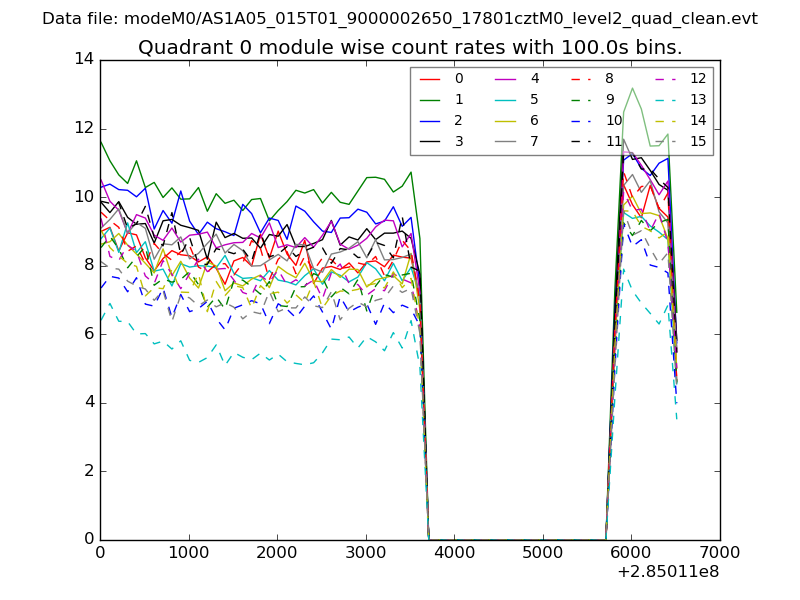 |
 |
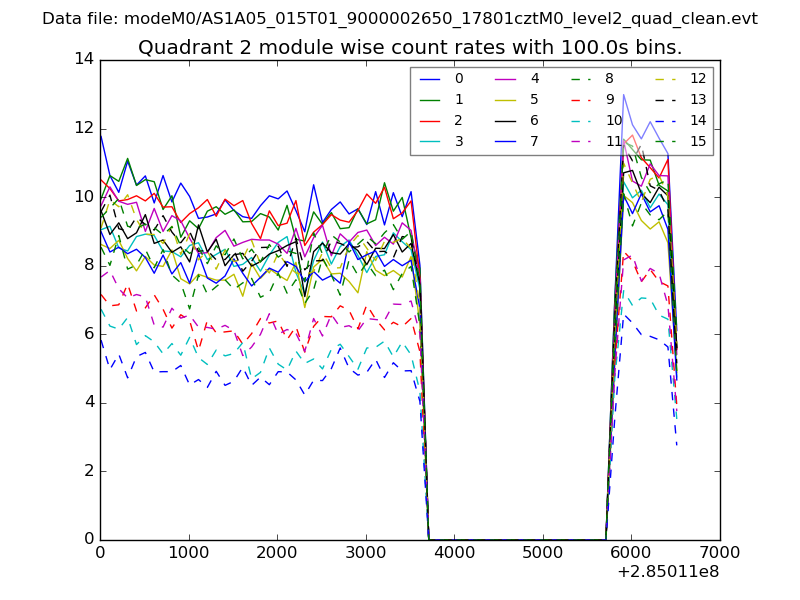
| Module-wise count rates for Quadrant B Data is divided into 100 sec bins |
 |
 |
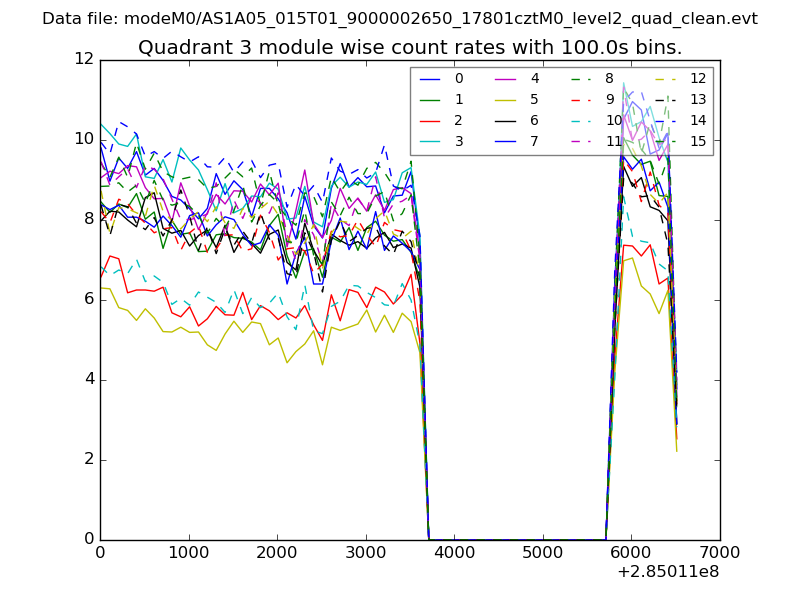
| Module-wise count rates for Quadrant C Data is divided into 100 sec bins |
 |
 |
| Module-wise count rates for Quadrant D Data is divided into 100 sec bins |
 |
 |
| Parameter | Plot |
|---|---|
| CZT HV Monitor | 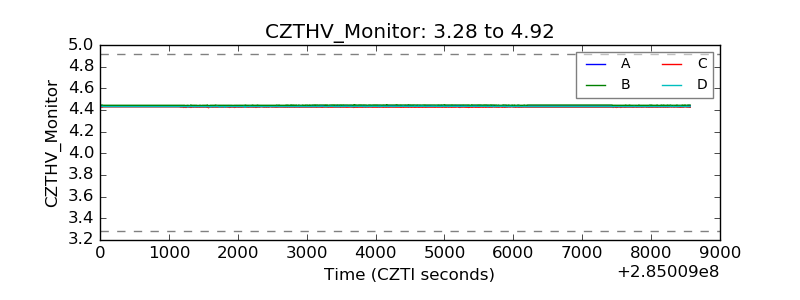 |
| D_VDD | 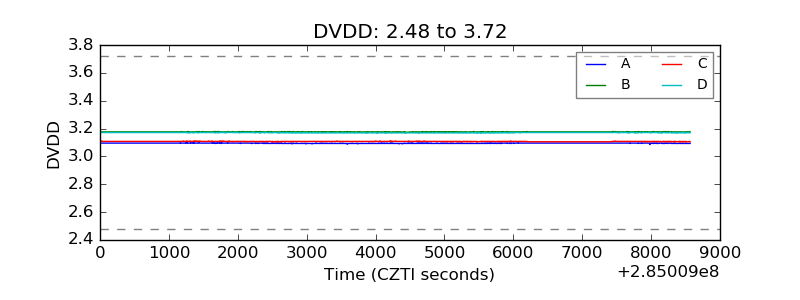 |
| Temperature 1 | 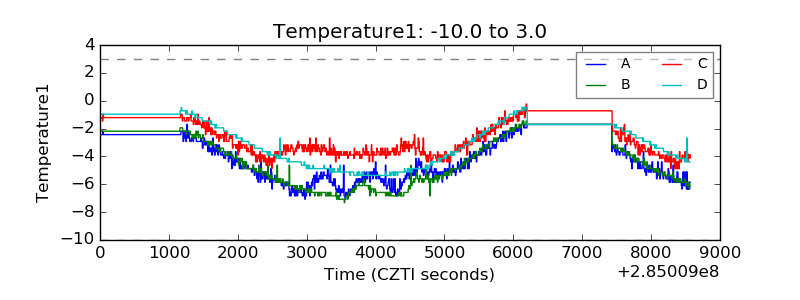 |
| Veto HV Monitor | 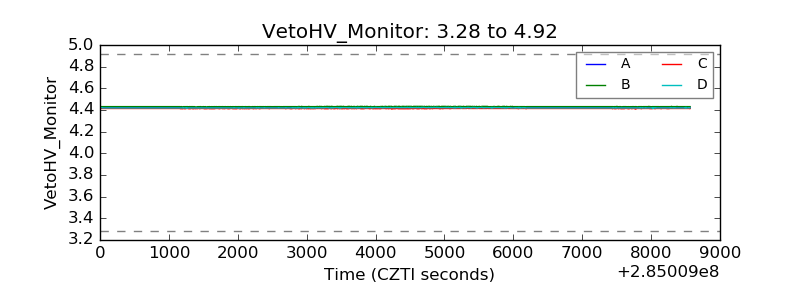 |
| Veto LLD | 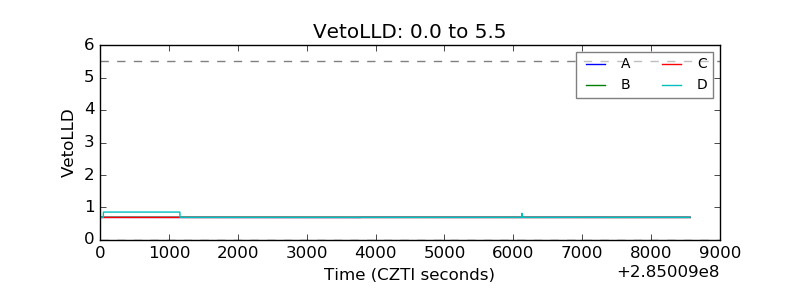 |
| Alpha Counter | 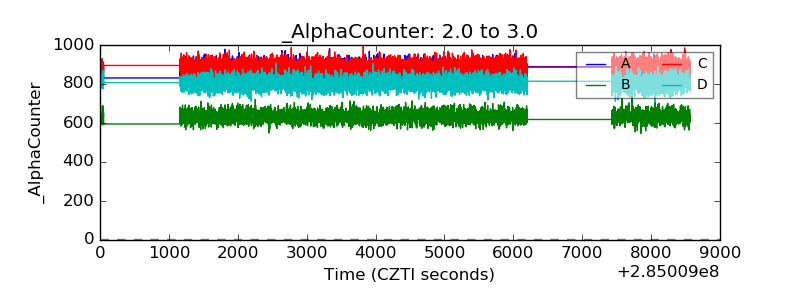 |
| _CPM_Rate | 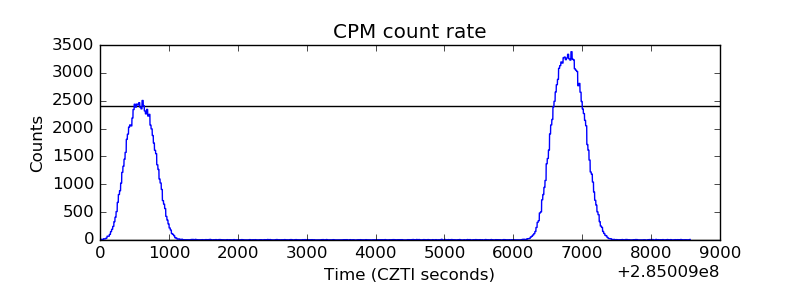 |
| CZT Counter | 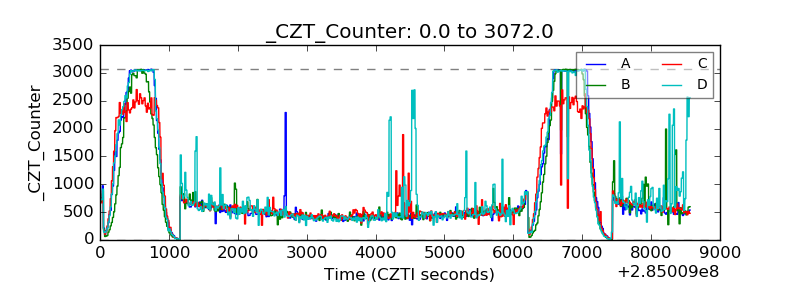 |
| +2.5 Volts monitor |  |
| +5 Volts monitor | 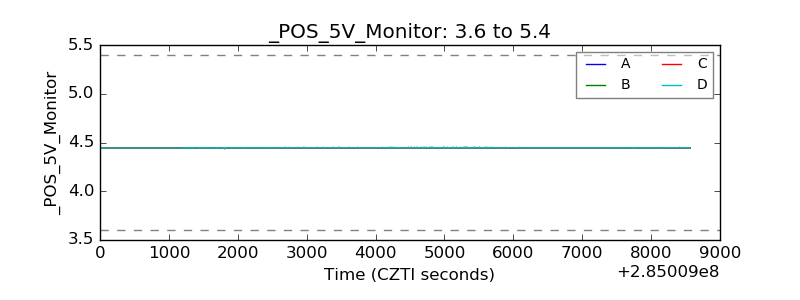 |
| _ROLL_ROT | 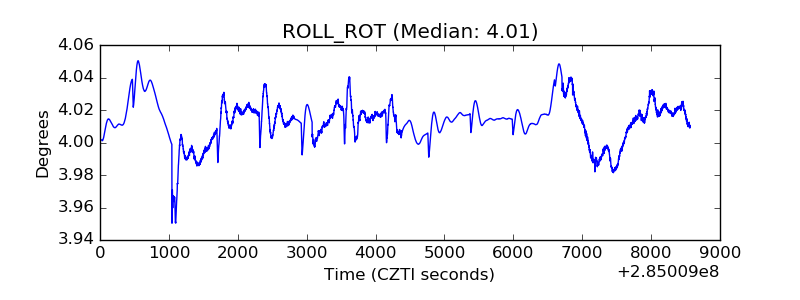 |
| _Roll_DEC | 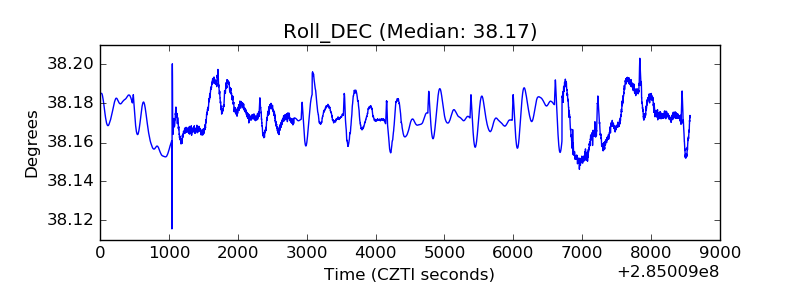 |
| _Roll_RA | 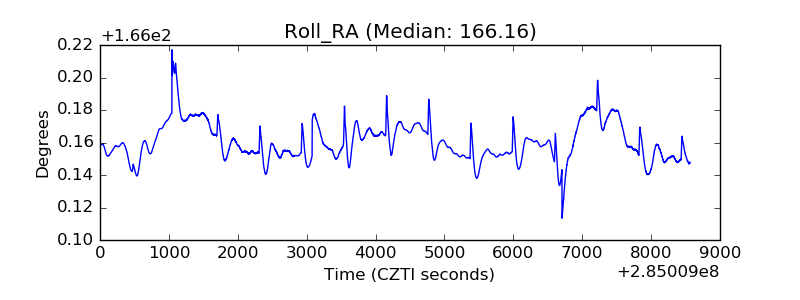 |
| Veto Counter | 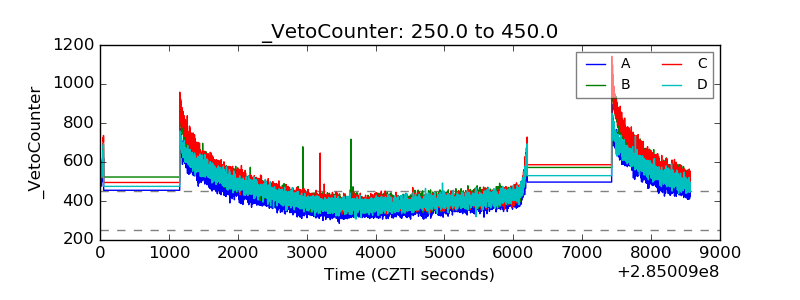 |