| Param | Original file | Final file |
|---|---|---|
| Filename | modeM0/AS1A05_015T01_9000002650_17804cztM0_level2.evt | modeM0/AS1A05_015T01_9000002650_17804cztM0_level2_quad_clean.evt |
| Size (bytes) | 490,656,960 | 107,565,120 |
| Size | 467.9 MB | 102.6 MB |
| Events in quadrant A | 3,174,586 | 710,915 |
| Events in quadrant B | 3,331,360 | 739,769 |
| Events in quadrant C | 3,322,594 | 700,525 |
| Events in quadrant D | 4,590,141 | 653,516 |
| Mode SS | |||
|---|---|---|---|
| Quadrant | BADHDUFLAG | Total packets | Discarded packets |
| A | 0 | 130 | 0 |
| B | 0 | 130 | 0 |
| C | 0 | 130 | 0 |
| D | 0 | 130 | 0 |
| Mode M9 | |||
|---|---|---|---|
| Quadrant | BADHDUFLAG | Total packets | Discarded packets |
| A | 0 | 19 | 0 |
| B | 0 | 20 | 0 |
| C | 0 | 20 | 0 |
| D | 0 | 20 | 0 |
| Mode M0 | |||
|---|---|---|---|
| Quadrant | BADHDUFLAG | Total packets | Discarded packets |
| A | 0 | 13670 | 2 |
| B | 0 | 14036 | 2 |
| C | 0 | 13965 | 2 |
| D | 0 | 18034 | 2 |
| Quadrant | Total seconds | Saturated seconds | Saturation percentage |
|---|---|---|---|
| A | 6500 | 31 | 0.476923% |
| B | 6500 | 50 | 0.769231% |
| C | 6500 | 87 | 1.338462% |
| D | 6500 | 412 | 6.338462% |
Noise dominated data is calculated using 1-second bins in cleaned event files. If a bin has >2000 counts, and if more than 50% of those come from <1% of pixels, then it is considered to be noise-dominated and hence unusable.
| Quadrant | # 1 sec bins | Bins with >0 counts | Bins with >2000 counts | High rate bins dominated by noise | Noise dominated (total time) | Noise dominated (detector-on time) | Marked lightcurve |
|---|---|---|---|---|---|---|---|
| A | 7850 | 6501 | 3 | 3 | 0.04% | 0.05% | 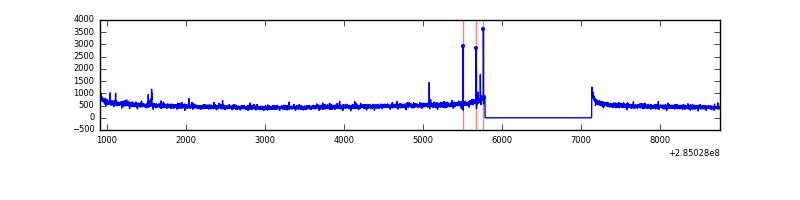 |
| B | 7850 | 6501 | 8 | 8 | 0.10% | 0.12% | 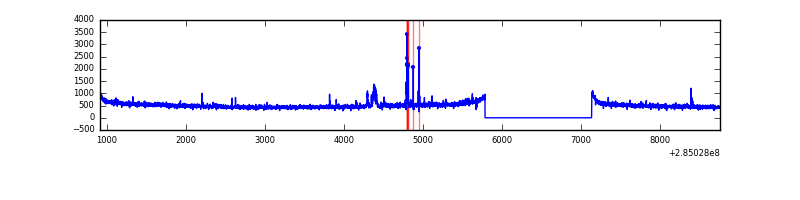 |
| C | 7850 | 6501 | 0 | 0 | 0.00% | 0.00% | 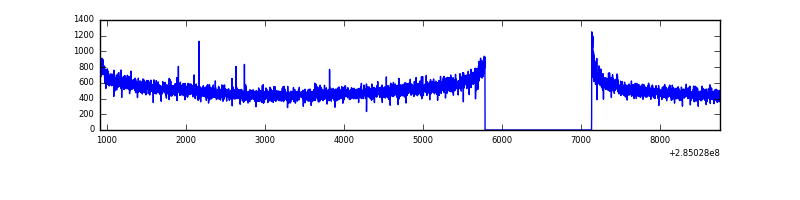 |
| D | 7850 | 6501 | 318 | 318 | 4.05% | 4.89% | 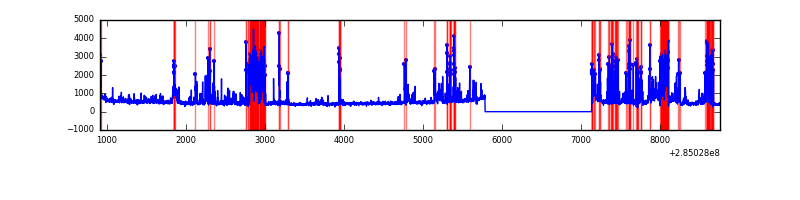 |
Top three noisy pixels from each quadrant. If the there are fewer than three noisy pixels in the level2.evt file, extra rows are filled as -1
| Pixel properties | Quadrant properties | ||||||
|---|---|---|---|---|---|---|---|
| Quadrant | DetID | PixID | Counts | Sigma | Mean | Median | Sigma |
| A | 15 | 174 | 26212 | 155.19 | 818 | 804 | 163.7 |
| A | 0 | 226 | 7143 | 38.72 | 818 | 804 | 163.7 |
| A | 12 | 194 | 5813 | 30.59 | 818 | 804 | 163.7 |
| B | 0 | 230 | 47128 | 299.32 | 828 | 811 | 154.7 |
| B | 4 | 142 | 36702 | 231.94 | 828 | 811 | 154.7 |
| B | 12 | 111 | 17784 | 109.69 | 828 | 811 | 154.7 |
| C | 14 | 238 | 125048 | 678.3 | 792 | 800 | 183.2 |
| C | 5 | 218 | 57402 | 309.01 | 792 | 800 | 183.2 |
| C | 3 | 233 | 45535 | 244.22 | 792 | 800 | 183.2 |
| D | 7 | 238 | 1608980 | 8757.38 | 770 | 754 | 183.6 |
| D | 2 | 234 | 23804 | 125.52 | 770 | 754 | 183.6 |
| D | 7 | 96 | 22314 | 117.4 | 770 | 754 | 183.6 |
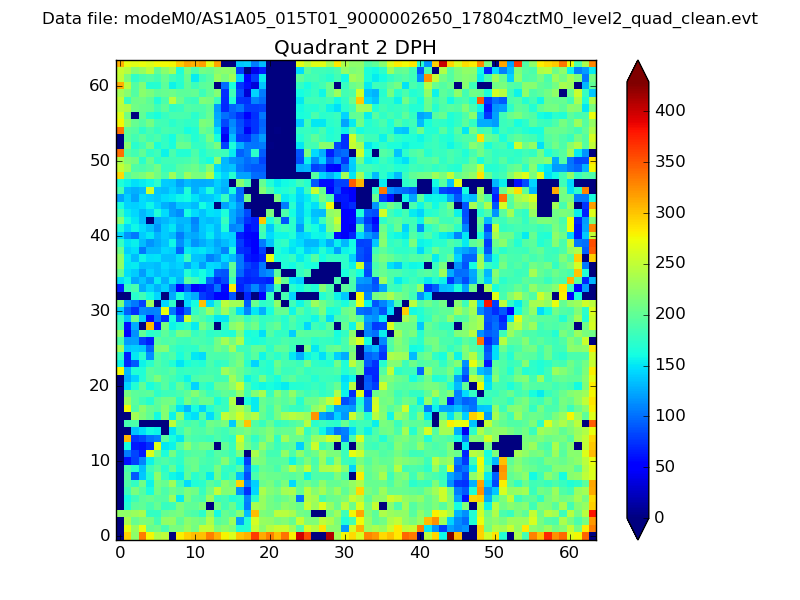
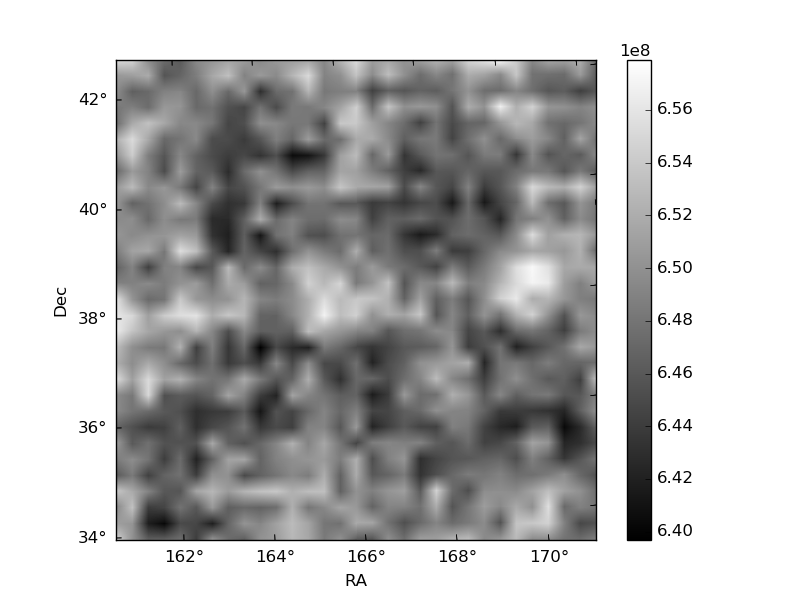
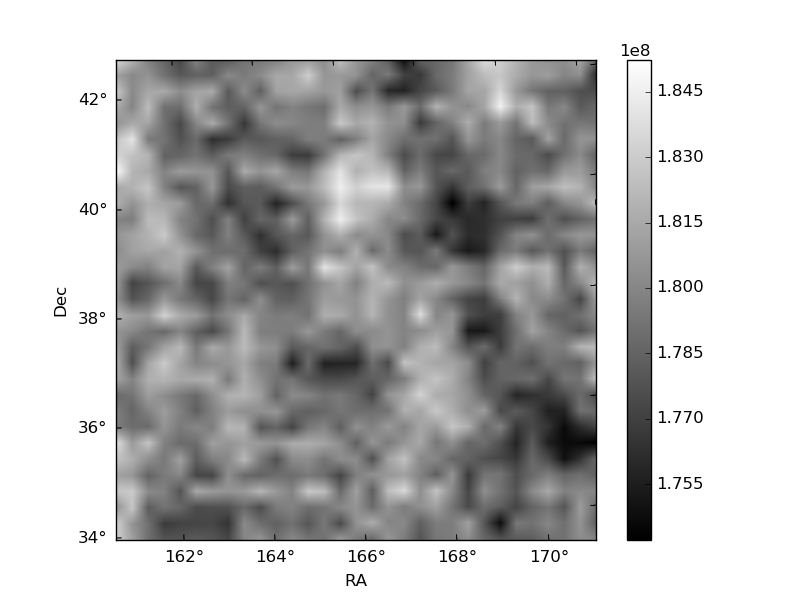
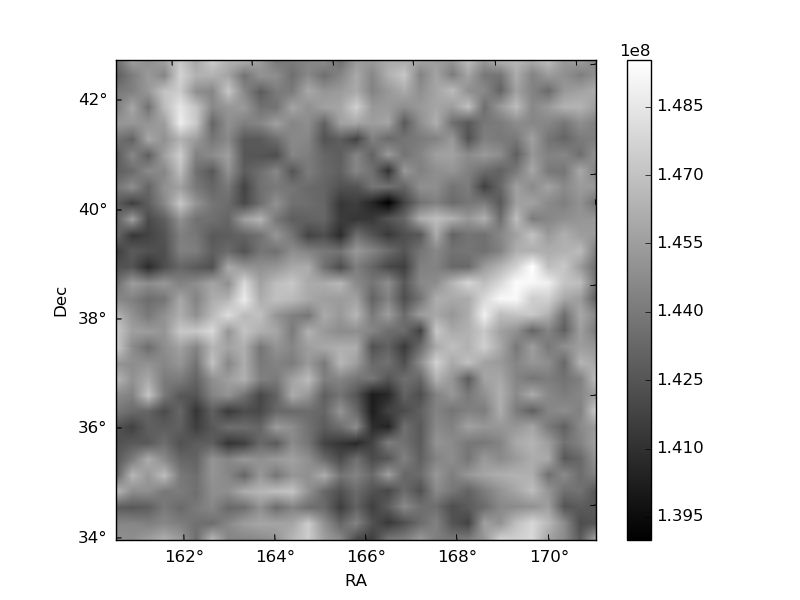
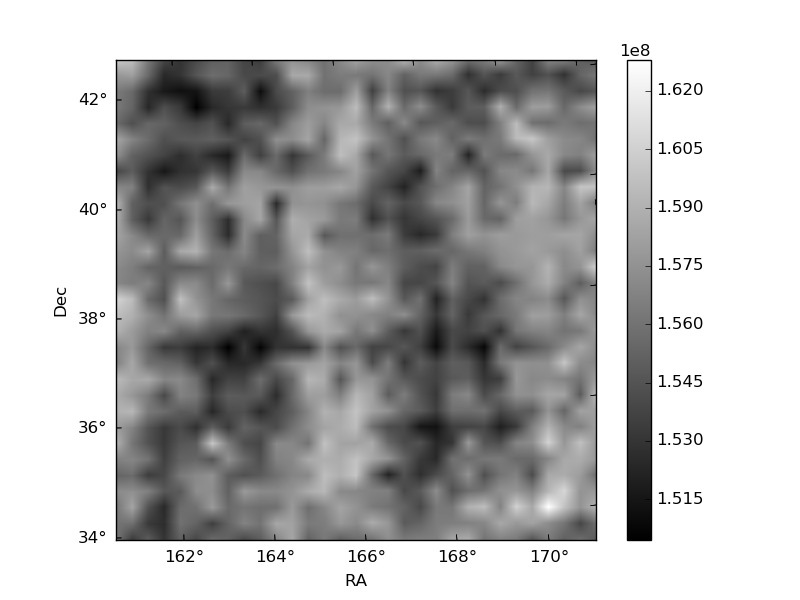
Histogram calculated using DETX and DETY for each event in the final _common_clean file
| Quadrant A | 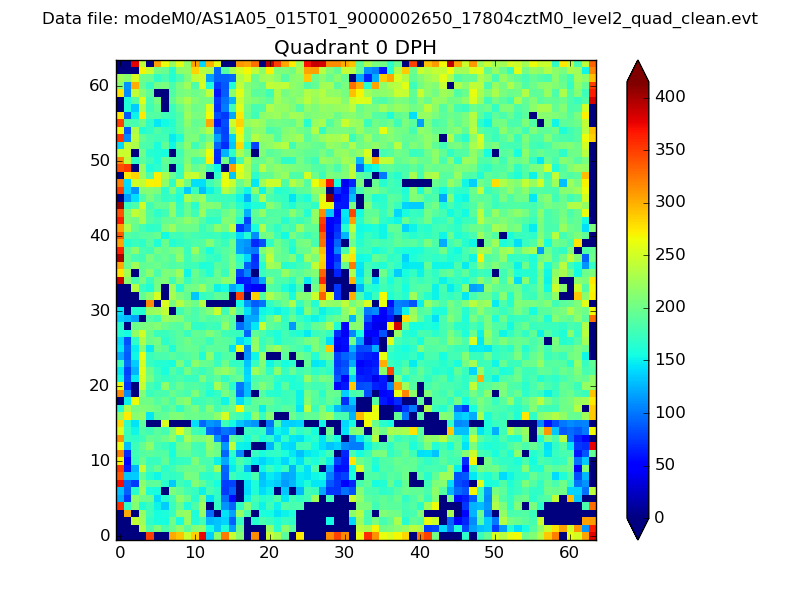 |
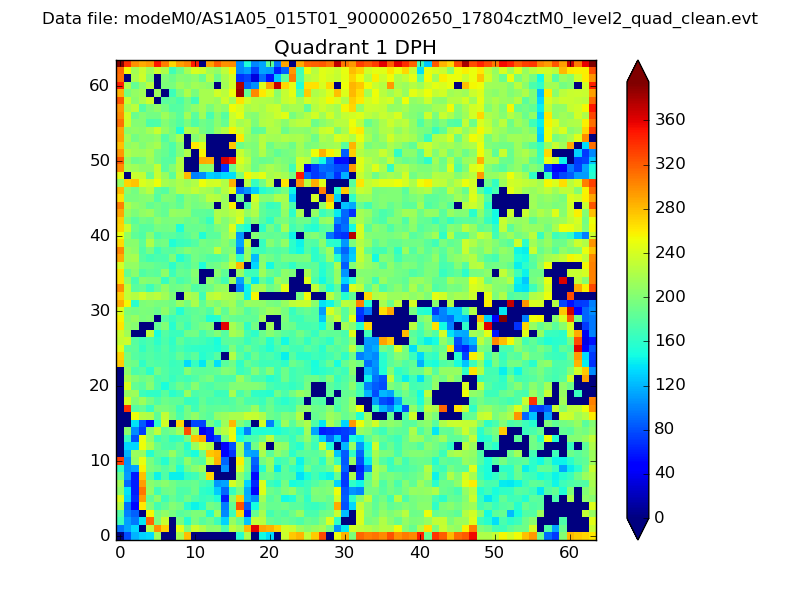 |
Quadrant B |
|---|---|---|---|
| Quadrant D | 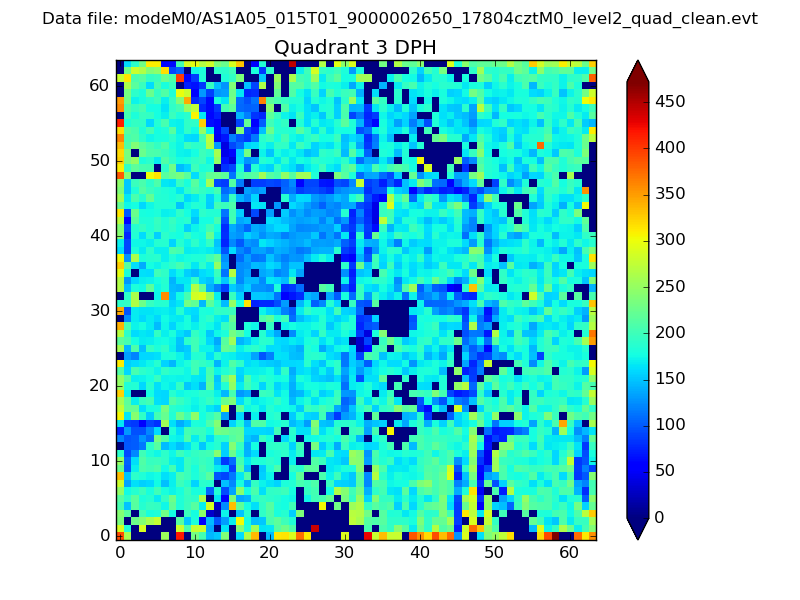 |
 |
Quadrant C |
| Plot type | Count rate plots | Images |
|---|---|---|
| Comparison with Poisson distribution Blue bars denote a histogram of data divided into 1 sec bins. Red curve is a Poisson curve with rate = median count rate of data. |
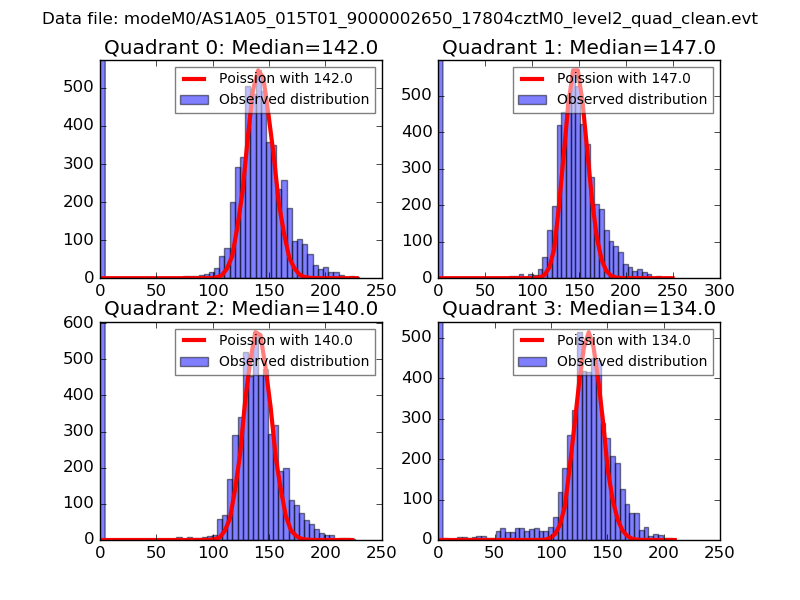 |
 |
| Quadrant-wise count rates Data is divided into 100 sec bins |
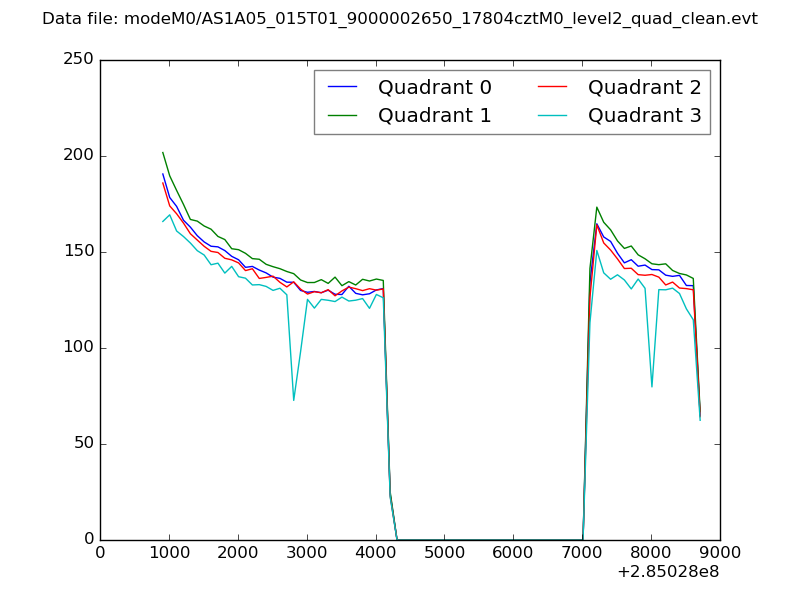 |
|
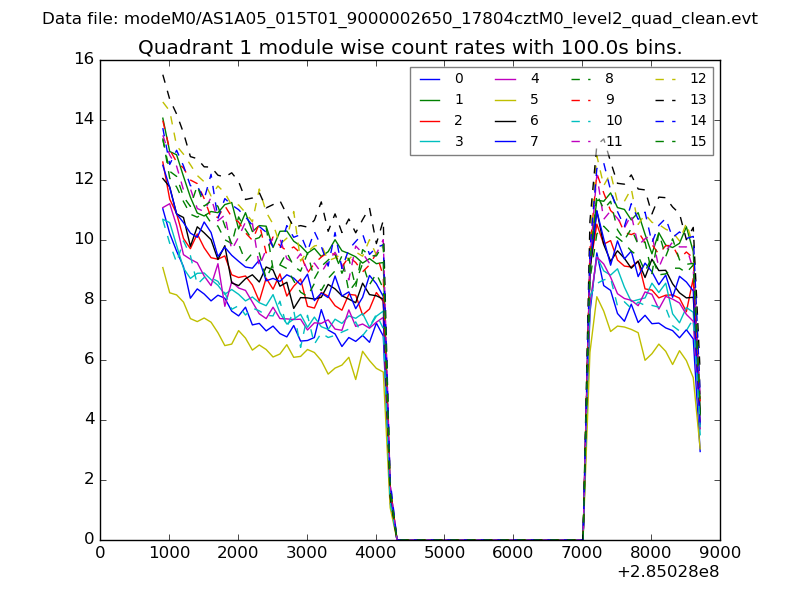
| Module-wise count rates for Quadrant A Data is divided into 100 sec bins |
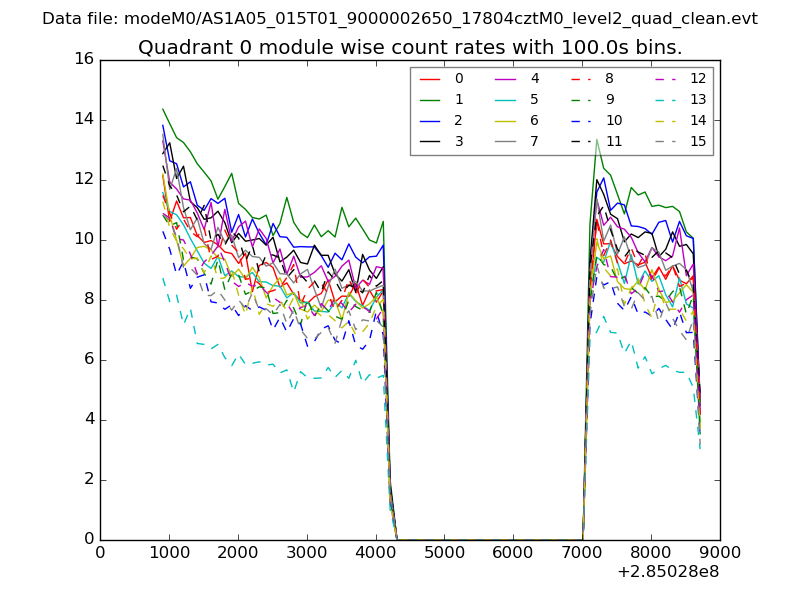 |
 |
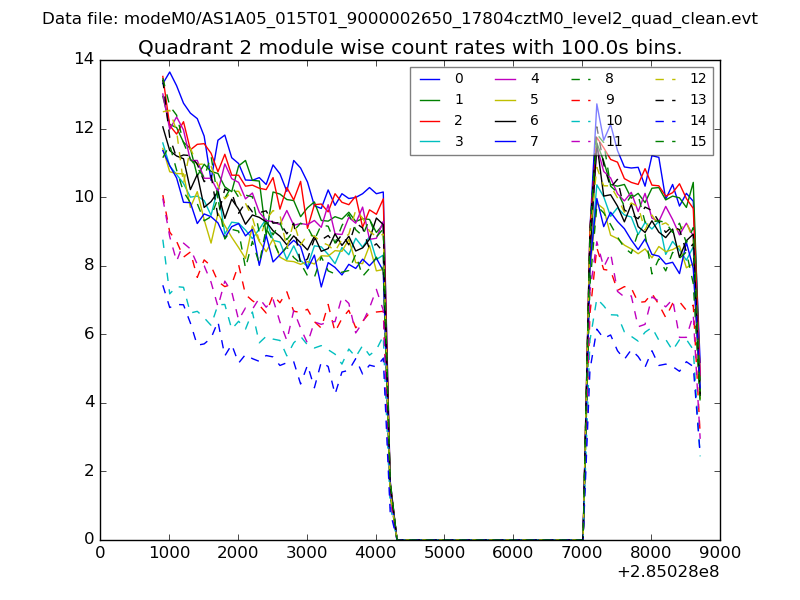
| Module-wise count rates for Quadrant B Data is divided into 100 sec bins |
 |
 |
| Module-wise count rates for Quadrant C Data is divided into 100 sec bins |
 |
 |
| Module-wise count rates for Quadrant D Data is divided into 100 sec bins |
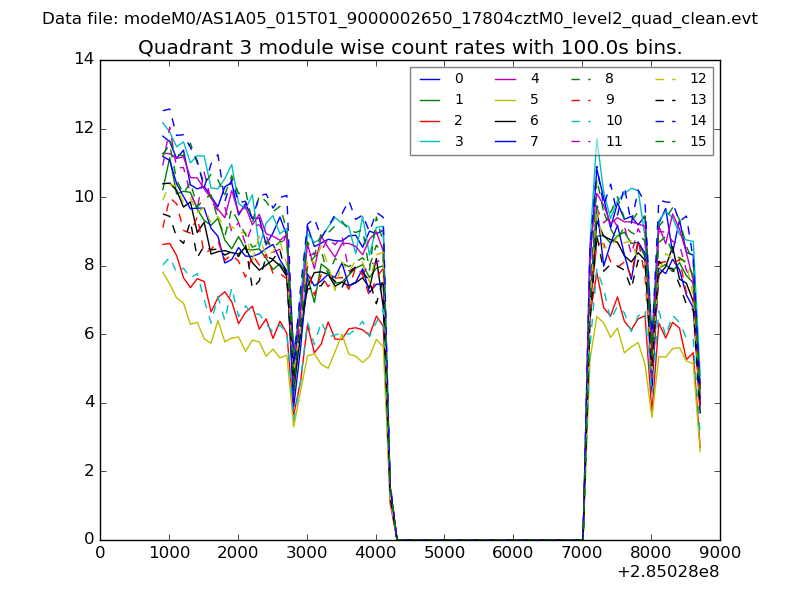 |
 |
| Parameter | Plot |
|---|---|
| CZT HV Monitor | 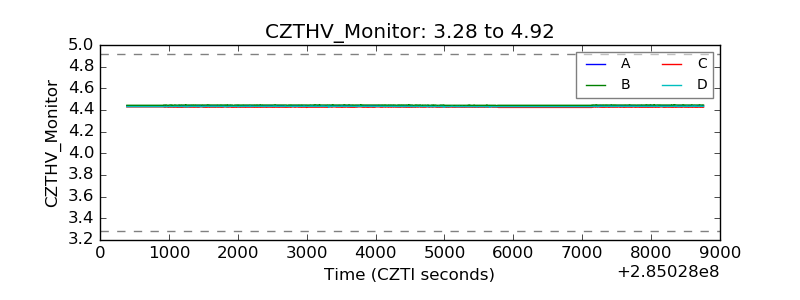 |
| D_VDD | 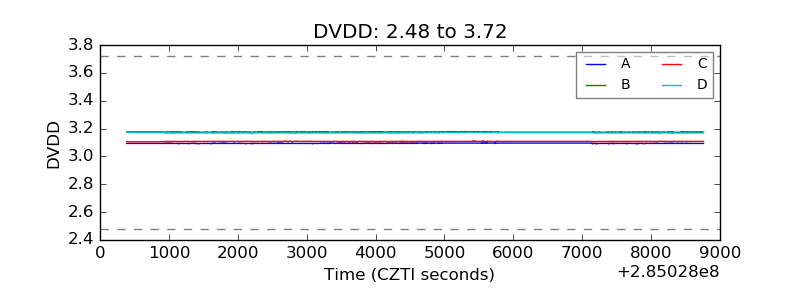 |
| Temperature 1 | 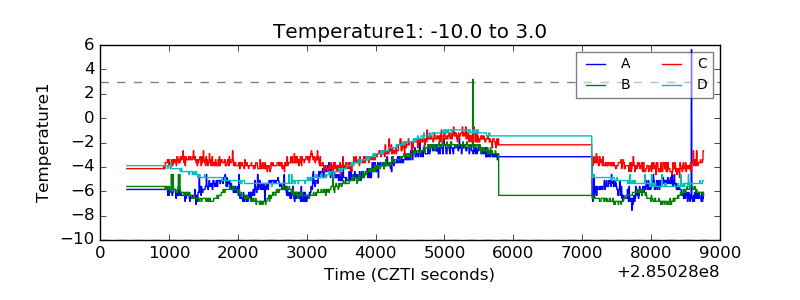 |
| Veto HV Monitor |  |
| Veto LLD | 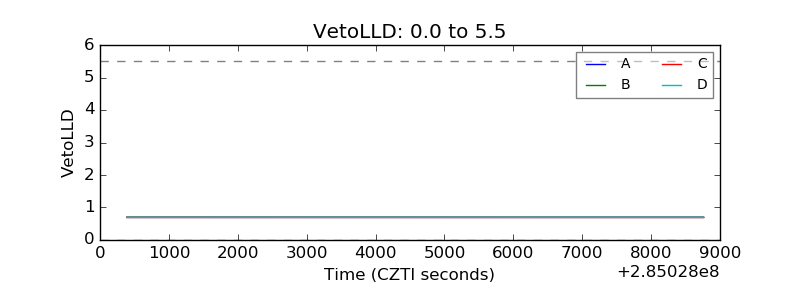 |
| Alpha Counter |  |
| _CPM_Rate | 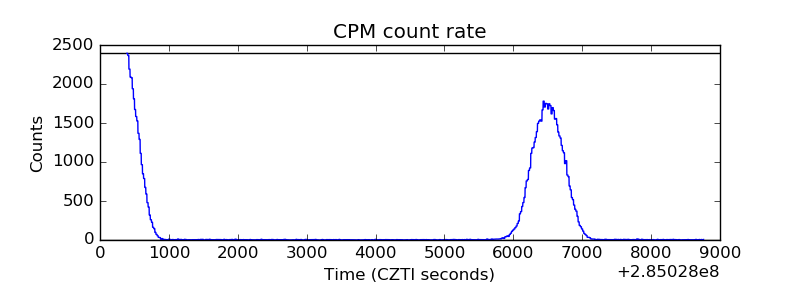 |
| CZT Counter | 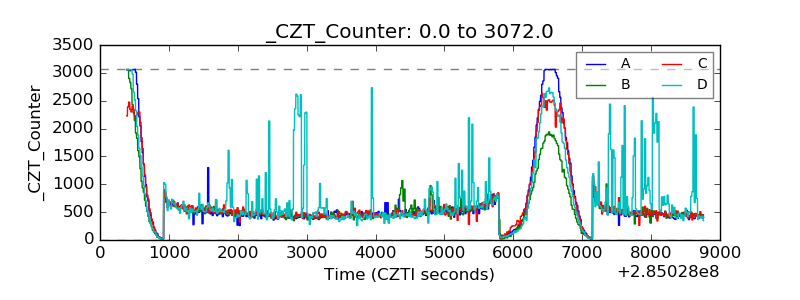 |
| +2.5 Volts monitor |  |
| +5 Volts monitor |  |
| _ROLL_ROT | 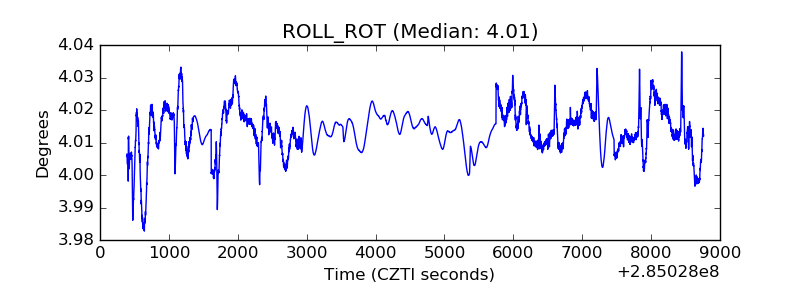 |
| _Roll_DEC | 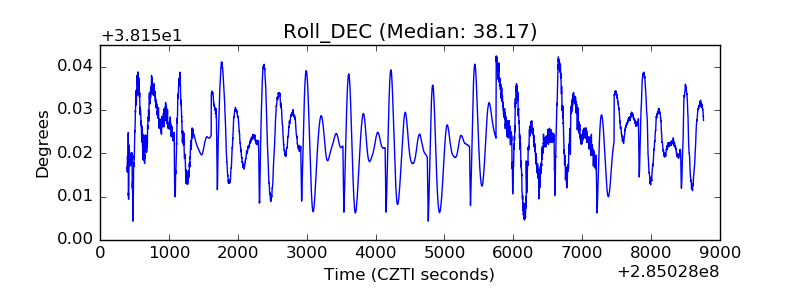 |
| _Roll_RA | 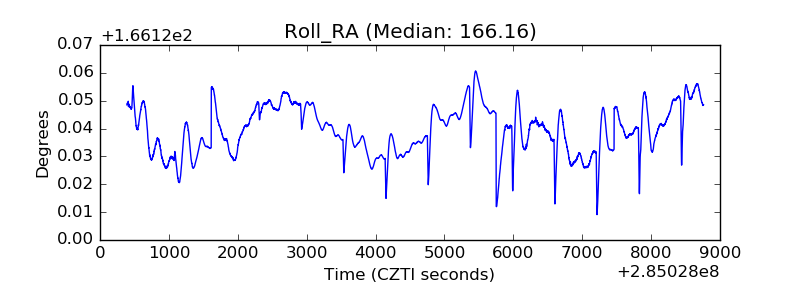 |
| Veto Counter | 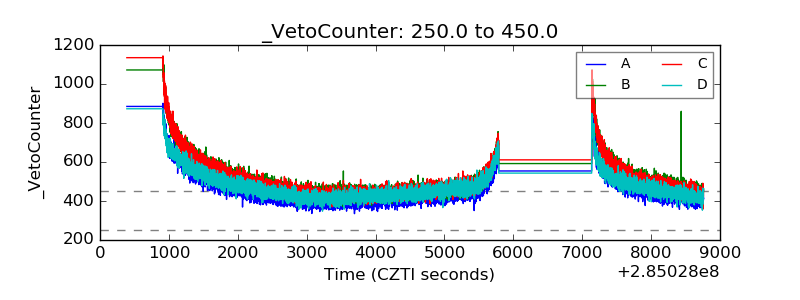 |