| Param | Original file | Final file |
|---|---|---|
| Filename | modeM0/AS1A05_015T01_9000002650_17806cztM0_level2.evt | modeM0/AS1A05_015T01_9000002650_17806cztM0_level2_quad_clean.evt |
| Size (bytes) | 493,701,120 | 97,295,040 |
| Size | 470.8 MB | 92.8 MB |
| Events in quadrant A | 3,221,591 | 622,430 |
| Events in quadrant B | 3,314,930 | 638,622 |
| Events in quadrant C | 3,386,435 | 610,629 |
| Events in quadrant D | 4,551,188 | 585,102 |
| Mode SS | |||
|---|---|---|---|
| Quadrant | BADHDUFLAG | Total packets | Discarded packets |
| A | 0 | 142 | 0 |
| B | 0 | 142 | 0 |
| C | 0 | 142 | 0 |
| D | 0 | 142 | 0 |
| Mode M9 | |||
|---|---|---|---|
| Quadrant | BADHDUFLAG | Total packets | Discarded packets |
| A | 0 | 12 | 0 |
| B | 0 | 13 | 0 |
| C | 0 | 13 | 0 |
| D | 0 | 13 | 0 |
| Mode M0 | |||
|---|---|---|---|
| Quadrant | BADHDUFLAG | Total packets | Discarded packets |
| A | 0 | 14346 | 2 |
| B | 0 | 14520 | 2 |
| C | 0 | 14531 | 2 |
| D | 0 | 18619 | 2 |
| Quadrant | Total seconds | Saturated seconds | Saturation percentage |
|---|---|---|---|
| A | 7032 | 28 | 0.398180% |
| B | 7032 | 40 | 0.568828% |
| C | 7032 | 68 | 0.967008% |
| D | 7032 | 400 | 5.688282% |
Noise dominated data is calculated using 1-second bins in cleaned event files. If a bin has >2000 counts, and if more than 50% of those come from <1% of pixels, then it is considered to be noise-dominated and hence unusable.
| Quadrant | # 1 sec bins | Bins with >0 counts | Bins with >2000 counts | High rate bins dominated by noise | Noise dominated (total time) | Noise dominated (detector-on time) | Marked lightcurve |
|---|---|---|---|---|---|---|---|
| A | 7907 | 7033 | 0 | 0 | 0.00% | 0.00% | 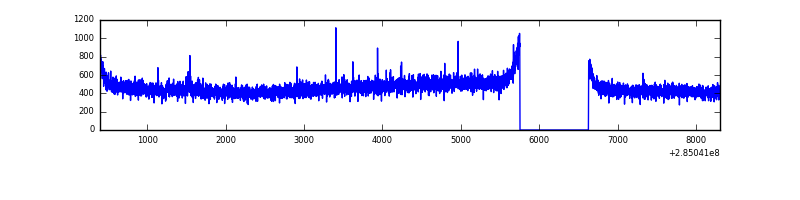 |
| B | 7907 | 7033 | 0 | 0 | 0.00% | 0.00% | 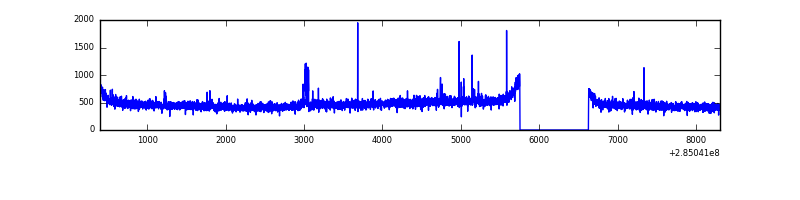 |
| C | 7907 | 7033 | 0 | 0 | 0.00% | 0.00% | 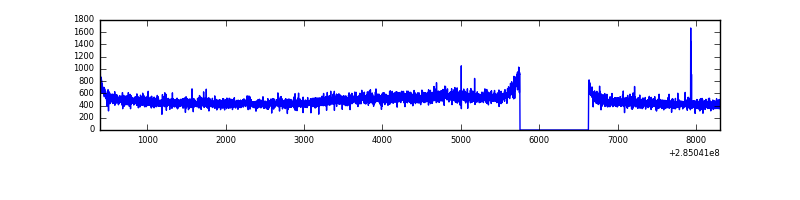 |
| D | 7907 | 7033 | 296 | 296 | 3.74% | 4.21% | 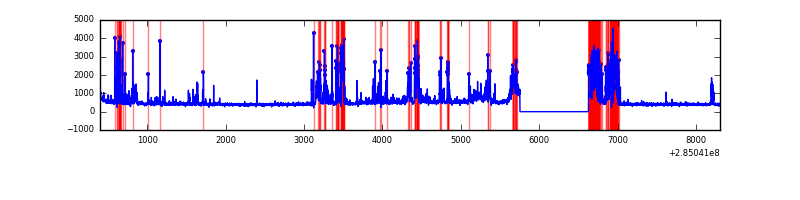 |
Top three noisy pixels from each quadrant. If the there are fewer than three noisy pixels in the level2.evt file, extra rows are filled as -1
| Pixel properties | Quadrant properties | ||||||
|---|---|---|---|---|---|---|---|
| Quadrant | DetID | PixID | Counts | Sigma | Mean | Median | Sigma |
| A | 15 | 174 | 13381 | 74.88 | 833 | 816 | 167.8 |
| A | 0 | 226 | 7206 | 38.08 | 833 | 816 | 167.8 |
| A | 13 | 210 | 6263 | 32.46 | 833 | 816 | 167.8 |
| B | 0 | 230 | 23048 | 139.29 | 836 | 815 | 159.6 |
| B | 12 | 111 | 18984 | 113.83 | 836 | 815 | 159.6 |
| B | 11 | 111 | 16498 | 98.25 | 836 | 815 | 159.6 |
| C | 14 | 238 | 123833 | 658.7 | 798 | 803 | 186.8 |
| C | 3 | 233 | 100651 | 534.58 | 798 | 803 | 186.8 |
| C | 5 | 218 | 39067 | 204.86 | 798 | 803 | 186.8 |
| D | 7 | 238 | 1497746 | 7992.57 | 784 | 769 | 187.3 |
| D | 2 | 234 | 26314 | 136.39 | 784 | 769 | 187.3 |
| D | 10 | 70 | 24769 | 128.14 | 784 | 769 | 187.3 |
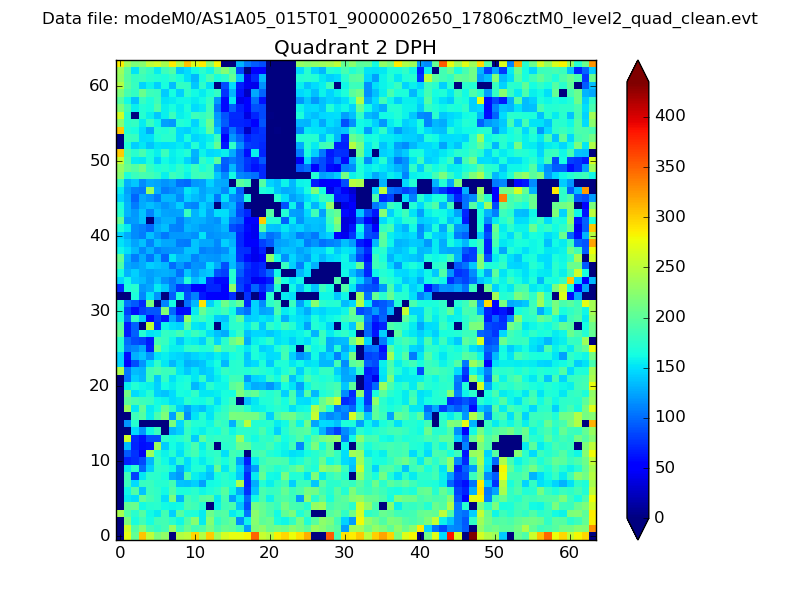
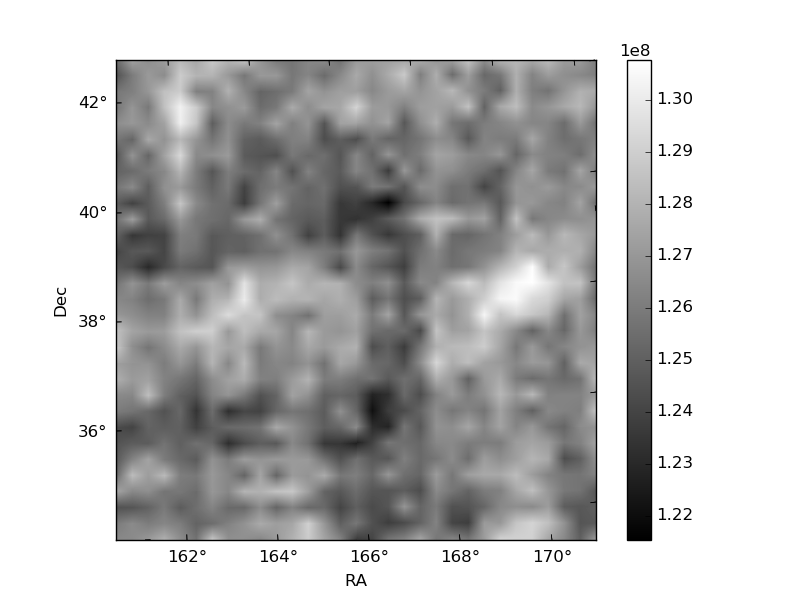
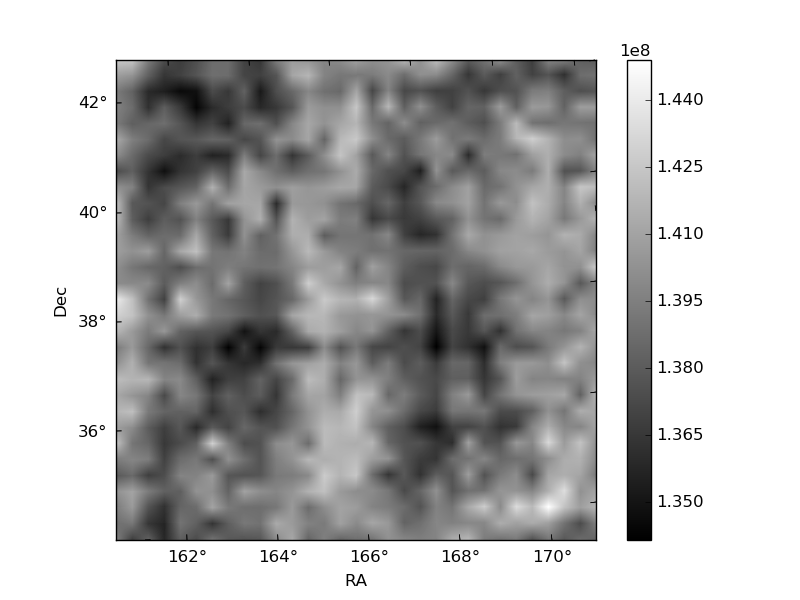
Histogram calculated using DETX and DETY for each event in the final _common_clean file
| Quadrant A | 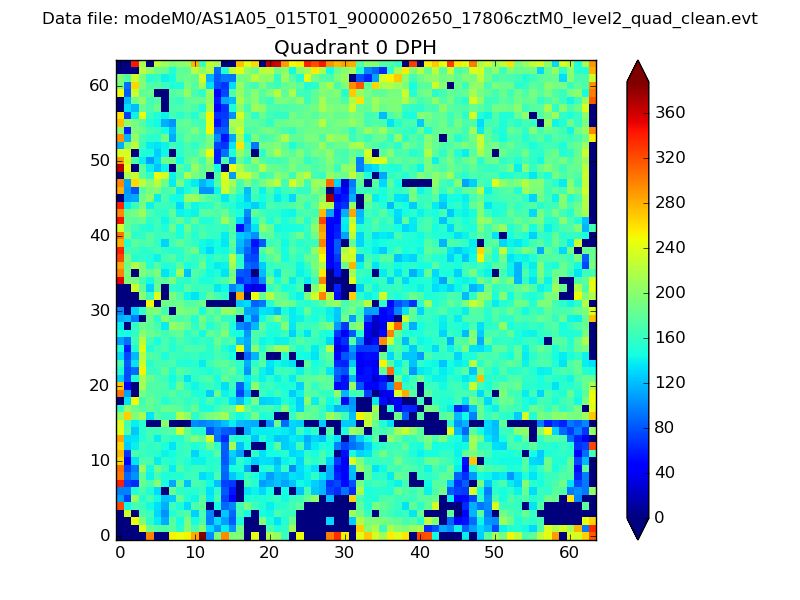 |
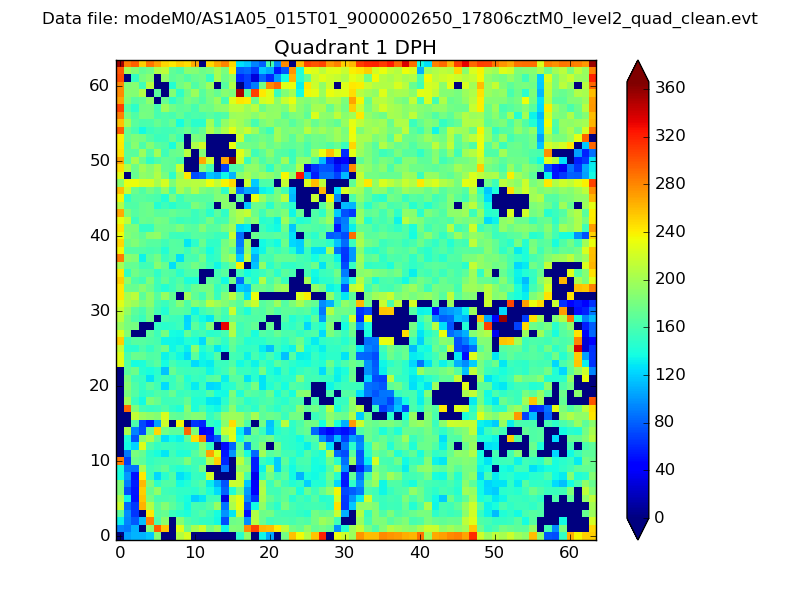 |
Quadrant B |
|---|---|---|---|
| Quadrant D | 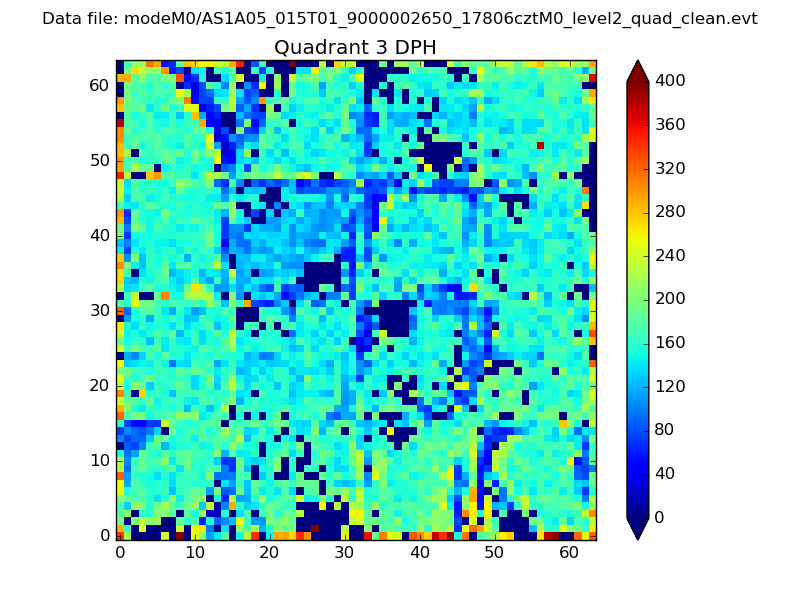 |
 |
Quadrant C |
| Plot type | Count rate plots | Images |
|---|---|---|
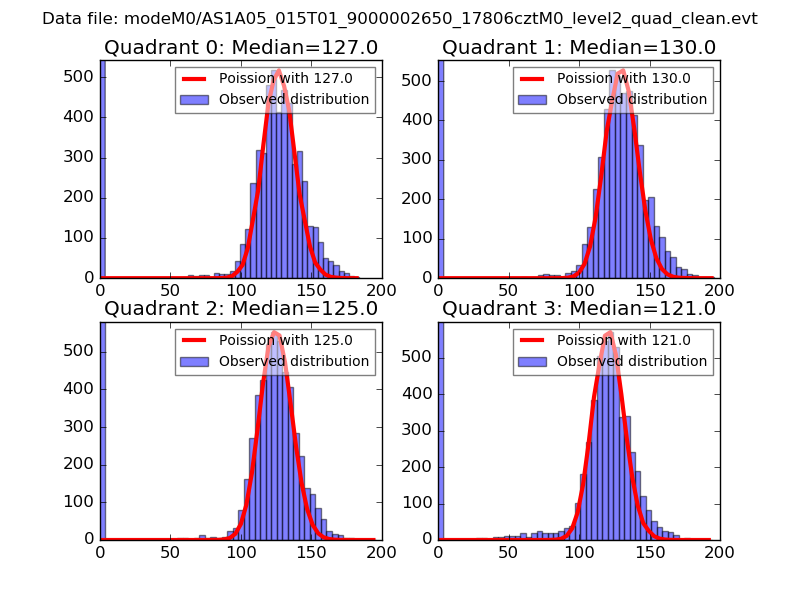
| Comparison with Poisson distribution Blue bars denote a histogram of data divided into 1 sec bins. Red curve is a Poisson curve with rate = median count rate of data. |
 |
 |
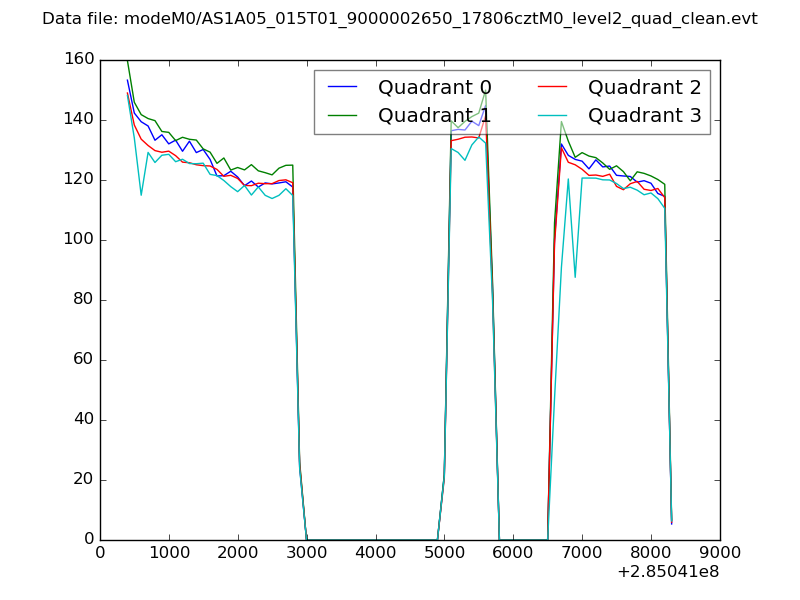
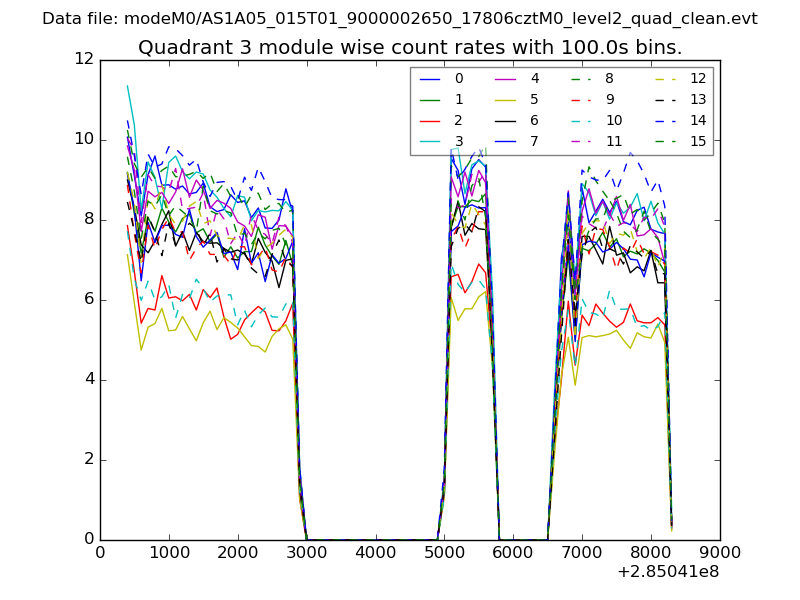
| Quadrant-wise count rates Data is divided into 100 sec bins |
 |
|
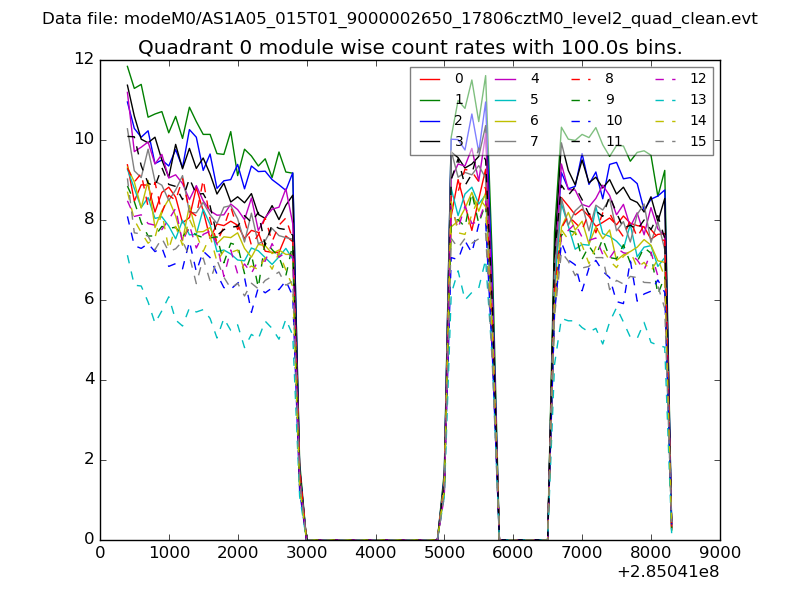
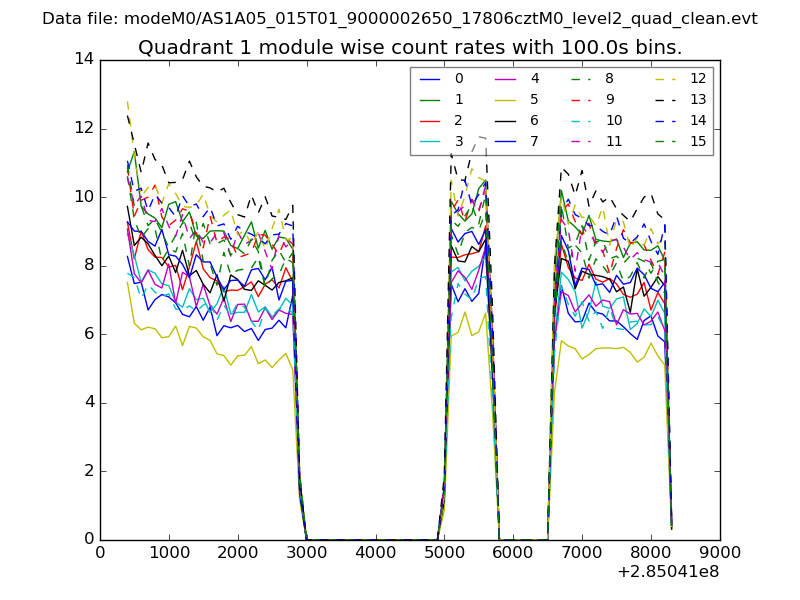
| Module-wise count rates for Quadrant A Data is divided into 100 sec bins |
 |
 |
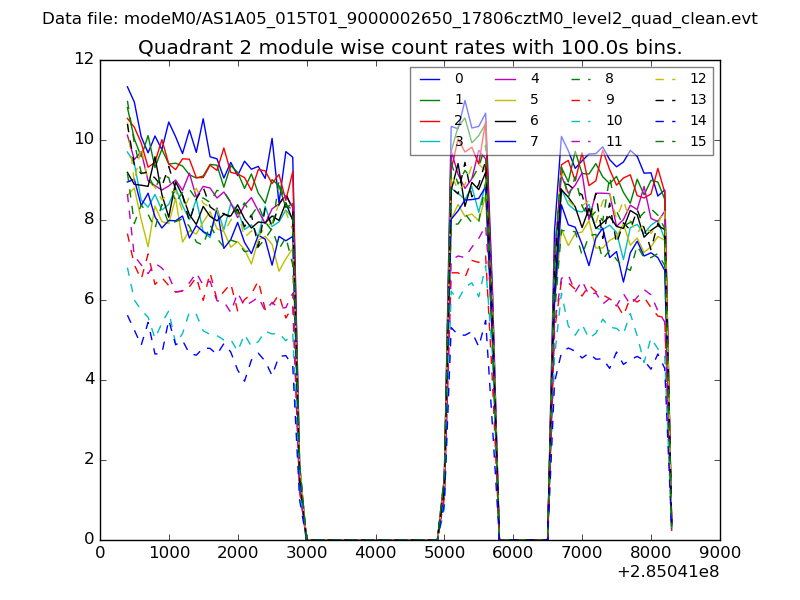
| Module-wise count rates for Quadrant B Data is divided into 100 sec bins |
 |
 |
| Module-wise count rates for Quadrant C Data is divided into 100 sec bins |
 |
 |
| Module-wise count rates for Quadrant D Data is divided into 100 sec bins |
 |
 |
| Parameter | Plot |
|---|---|
| CZT HV Monitor | 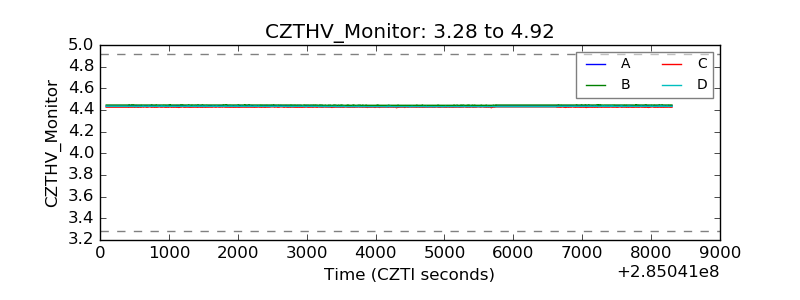 |
| D_VDD | 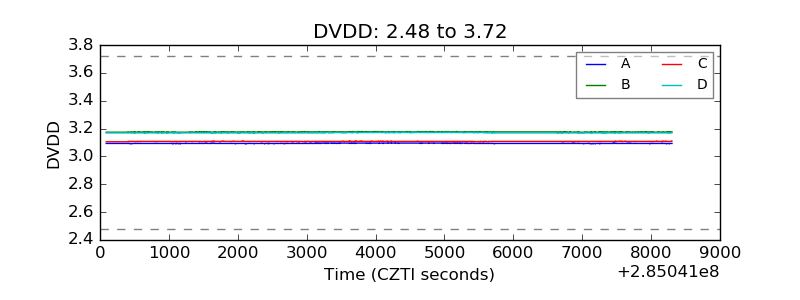 |
| Temperature 1 |  |
| Veto HV Monitor | 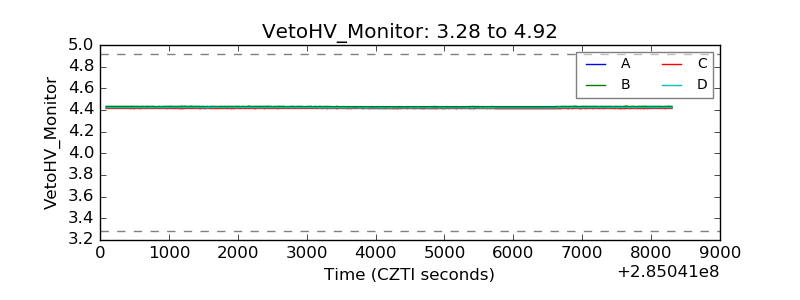 |
| Veto LLD | 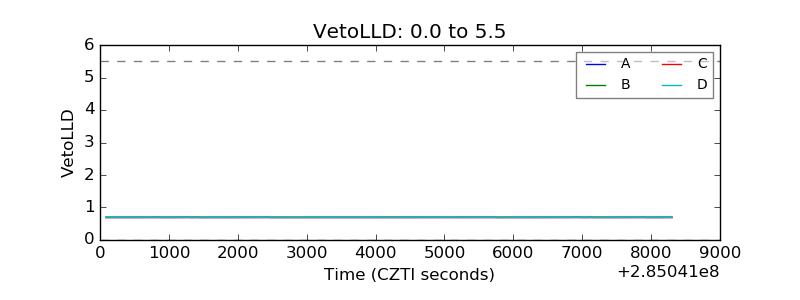 |
| Alpha Counter | 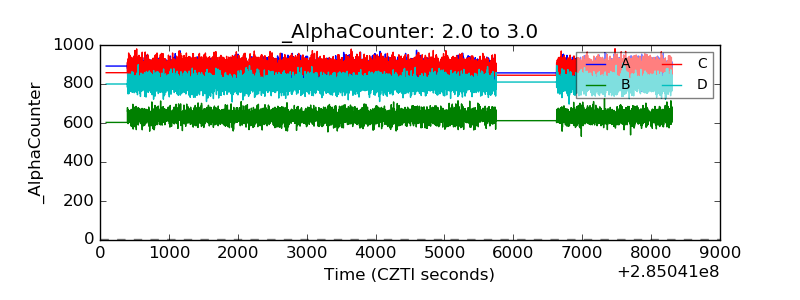 |
| _CPM_Rate | 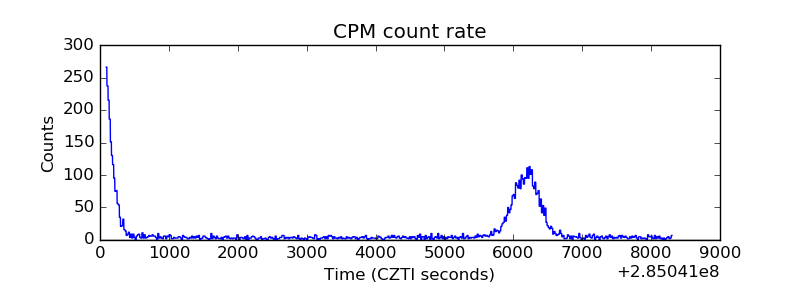 |
| CZT Counter | 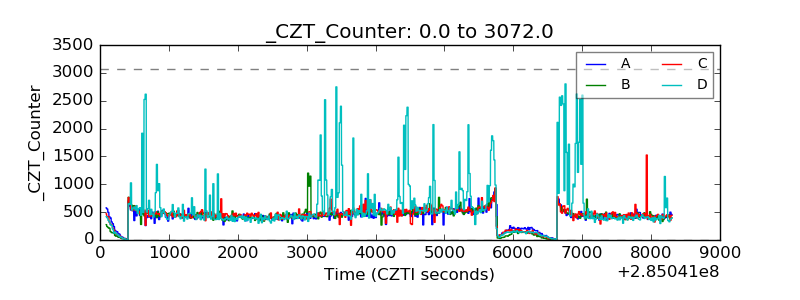 |
| +2.5 Volts monitor |  |
| +5 Volts monitor |  |
| _ROLL_ROT | 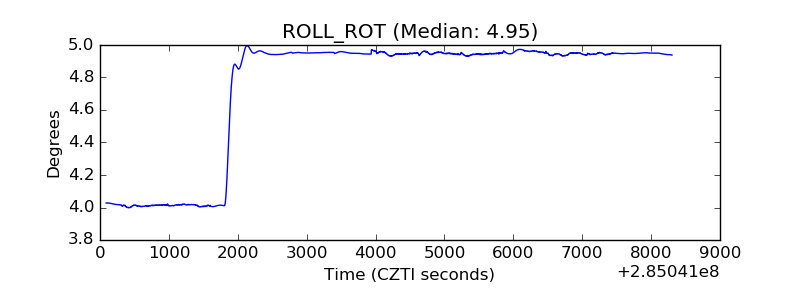 |
| _Roll_DEC | 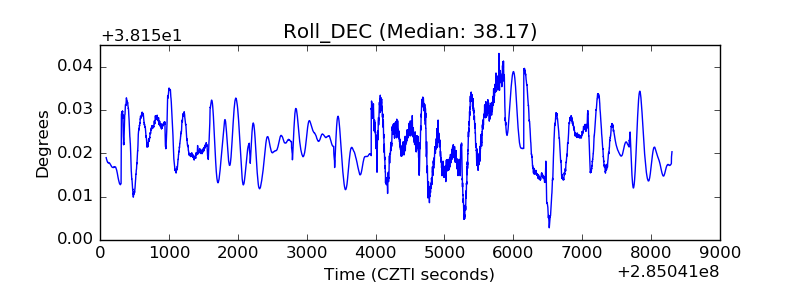 |
| _Roll_RA | 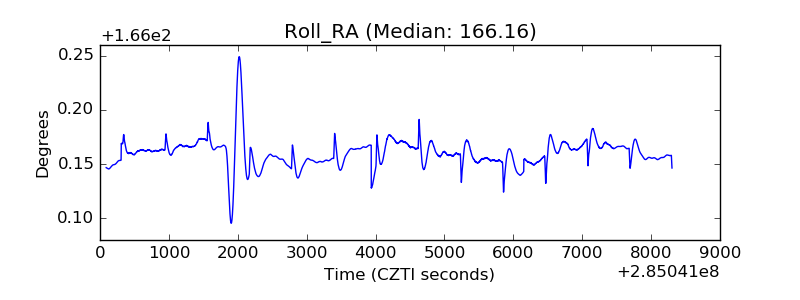 |
| Veto Counter | 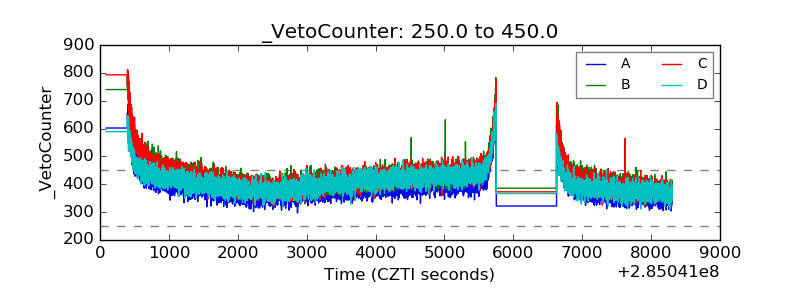 |