| Param | Original file | Final file |
|---|---|---|
| Filename | modeM0/AS1A05_015T01_9000002650_17808cztM0_level2.evt | modeM0/AS1A05_015T01_9000002650_17808cztM0_level2_quad_clean.evt |
| Size (bytes) | 460,062,720 | 92,292,480 |
| Size | 438.8 MB | 88.0 MB |
| Events in quadrant A | 3,256,279 | 576,523 |
| Events in quadrant B | 3,422,369 | 591,382 |
| Events in quadrant C | 3,319,190 | 569,903 |
| Events in quadrant D | 3,453,564 | 563,793 |
| Mode SS | |||
|---|---|---|---|
| Quadrant | BADHDUFLAG | Total packets | Discarded packets |
| A | 0 | 142 | 0 |
| B | 0 | 142 | 0 |
| C | 0 | 142 | 0 |
| D | 0 | 142 | 0 |
| Mode M0 | |||
|---|---|---|---|
| Quadrant | BADHDUFLAG | Total packets | Discarded packets |
| A | 0 | 14568 | 1 |
| B | 0 | 14911 | 1 |
| C | 0 | 14542 | 2 |
| D | 0 | 15401 | 1 |
| Quadrant | Total seconds | Saturated seconds | Saturation percentage |
|---|---|---|---|
| A | 7076 | 213 | 3.010175% |
| B | 7077 | 237 | 3.348877% |
| C | 7076 | 209 | 2.953646% |
| D | 7076 | 182 | 2.572075% |
Noise dominated data is calculated using 1-second bins in cleaned event files. If a bin has >2000 counts, and if more than 50% of those come from <1% of pixels, then it is considered to be noise-dominated and hence unusable.
| Quadrant | # 1 sec bins | Bins with >0 counts | Bins with >2000 counts | High rate bins dominated by noise | Noise dominated (total time) | Noise dominated (detector-on time) | Marked lightcurve |
|---|---|---|---|---|---|---|---|
| A | 7091 | 7077 | 0 | 0 | 0.00% | 0.00% |  |
| B | 7092 | 7078 | 9 | 9 | 0.13% | 0.13% | 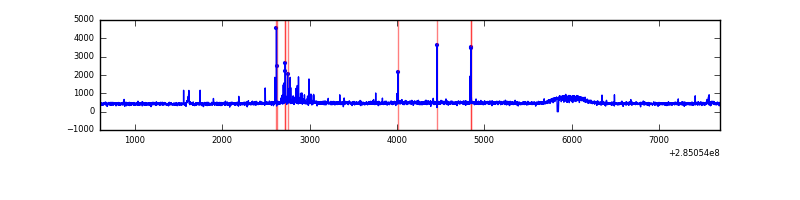 |
| C | 7091 | 7077 | 0 | 0 | 0.00% | 0.00% | 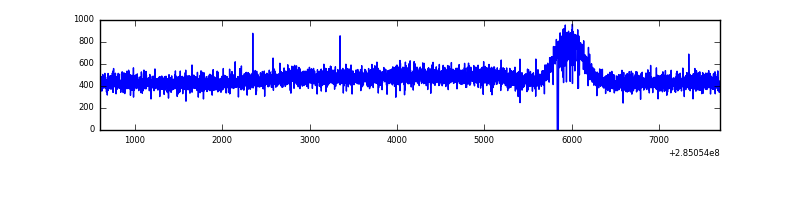 |
| D | 7091 | 7077 | 29 | 29 | 0.41% | 0.41% | 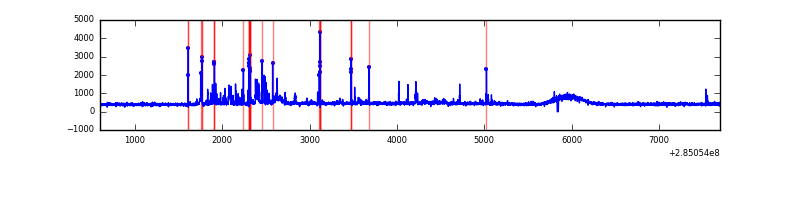 |
Top three noisy pixels from each quadrant. If the there are fewer than three noisy pixels in the level2.evt file, extra rows are filled as -1
| Pixel properties | Quadrant properties | ||||||
|---|---|---|---|---|---|---|---|
| Quadrant | DetID | PixID | Counts | Sigma | Mean | Median | Sigma |
| A | 15 | 174 | 8742 | 46.12 | 844 | 823 | 171.7 |
| A | 0 | 226 | 7351 | 38.02 | 844 | 823 | 171.7 |
| A | 3 | 137 | 6608 | 33.69 | 844 | 823 | 171.7 |
| B | 7 | 220 | 59149 | 356.02 | 843 | 820 | 163.8 |
| B | 12 | 111 | 19472 | 113.84 | 843 | 820 | 163.8 |
| B | 0 | 230 | 18945 | 110.63 | 843 | 820 | 163.8 |
| C | 14 | 238 | 123655 | 644.87 | 808 | 809 | 190.5 |
| C | 5 | 218 | 20370 | 102.68 | 808 | 809 | 190.5 |
| C | 8 | 128 | 9609 | 46.2 | 808 | 809 | 190.5 |
| D | 7 | 238 | 248770 | 1249.97 | 818 | 794 | 198.4 |
| D | 10 | 70 | 75092 | 374.51 | 818 | 794 | 198.4 |
| D | 2 | 234 | 28462 | 139.46 | 818 | 794 | 198.4 |
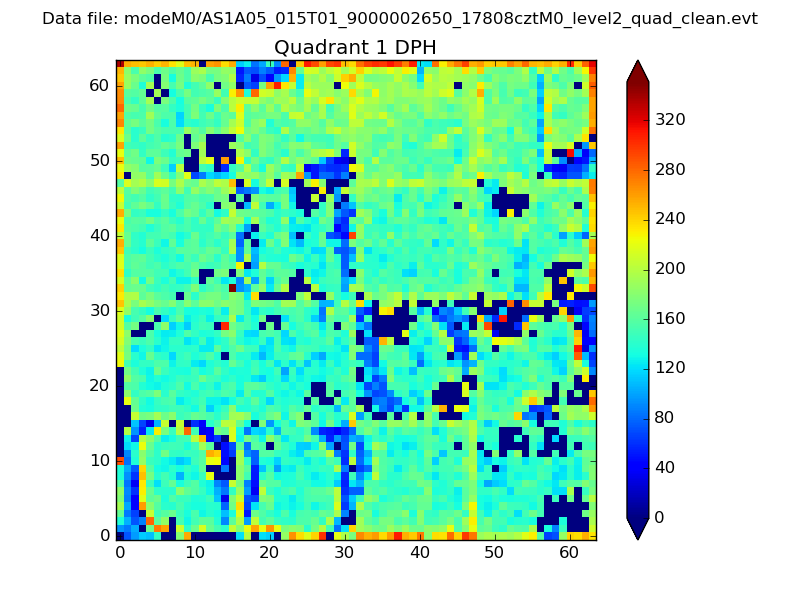
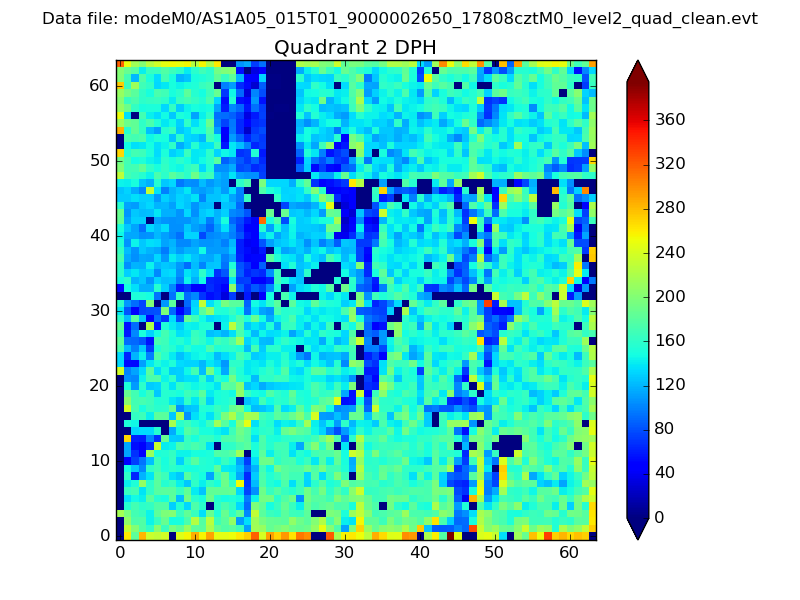
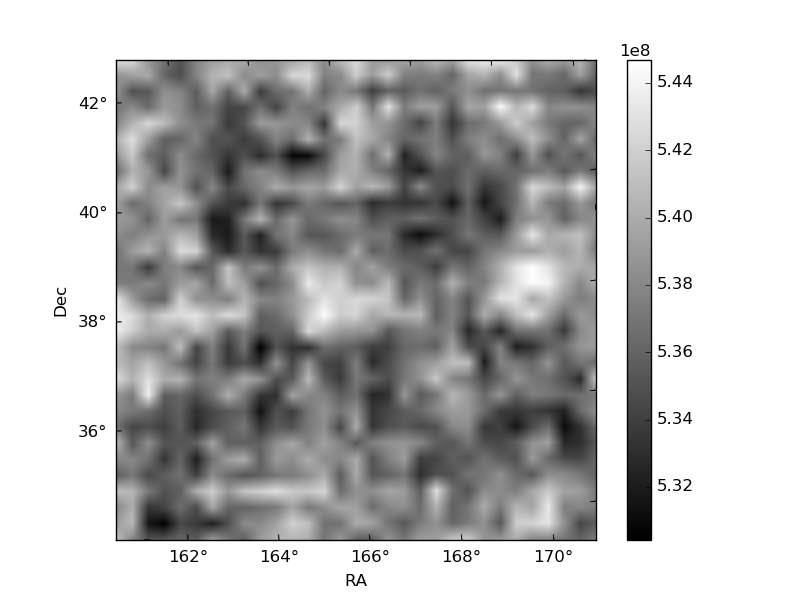
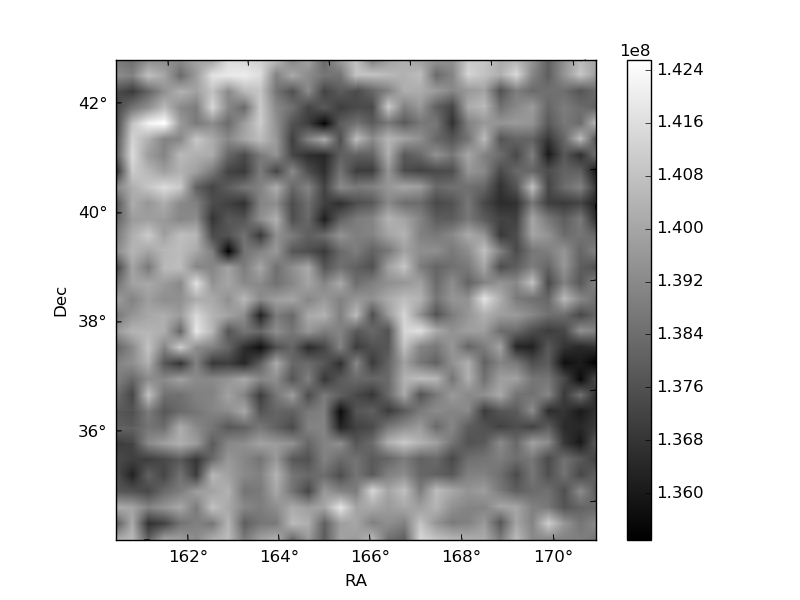
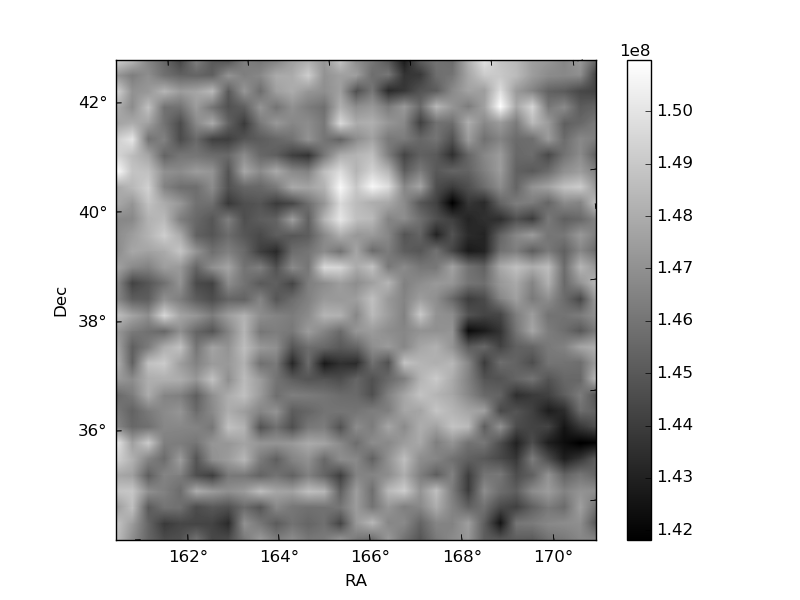
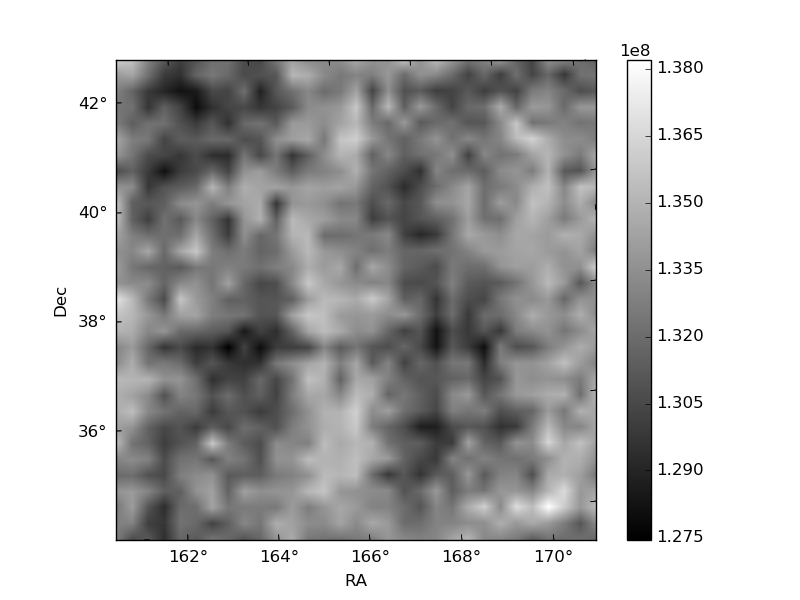
Histogram calculated using DETX and DETY for each event in the final _common_clean file
| Quadrant A | 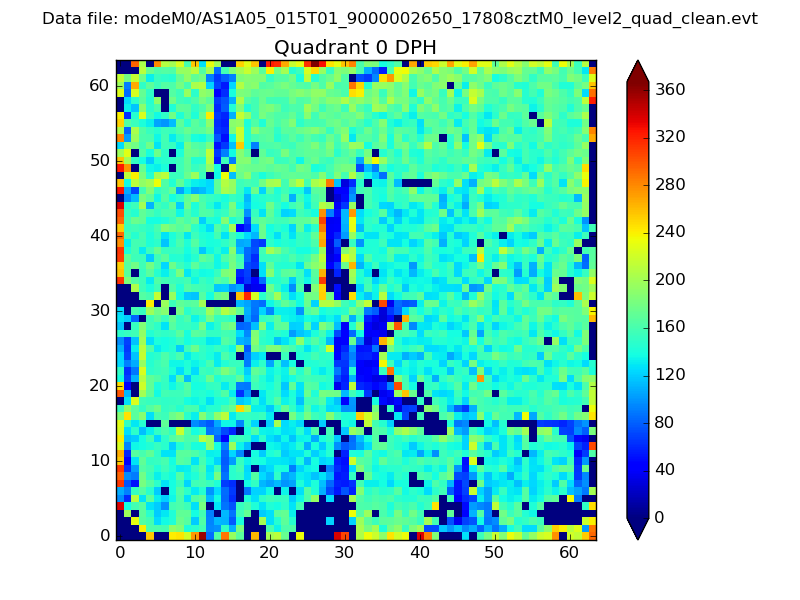 |
 |
Quadrant B |
|---|---|---|---|
| Quadrant D | 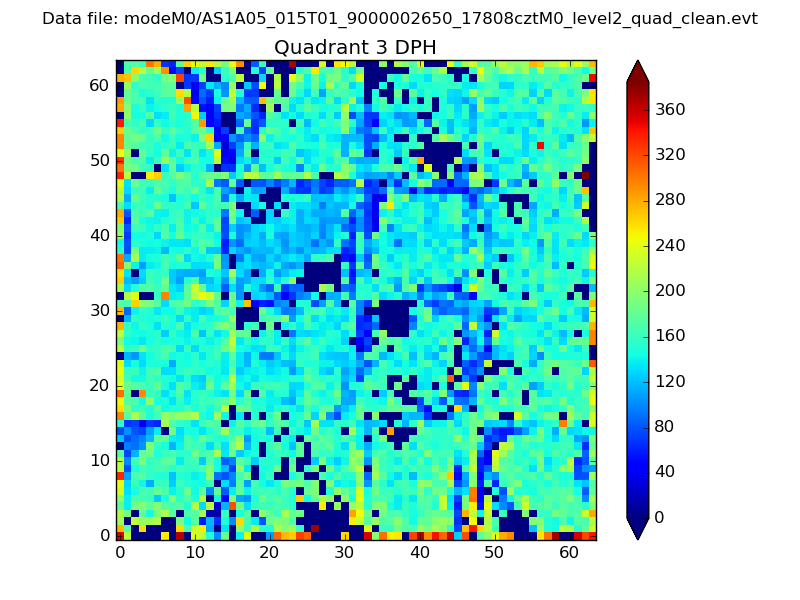 |
 |
Quadrant C |
| Plot type | Count rate plots | Images |
|---|---|---|
| Comparison with Poisson distribution Blue bars denote a histogram of data divided into 1 sec bins. Red curve is a Poisson curve with rate = median count rate of data. |
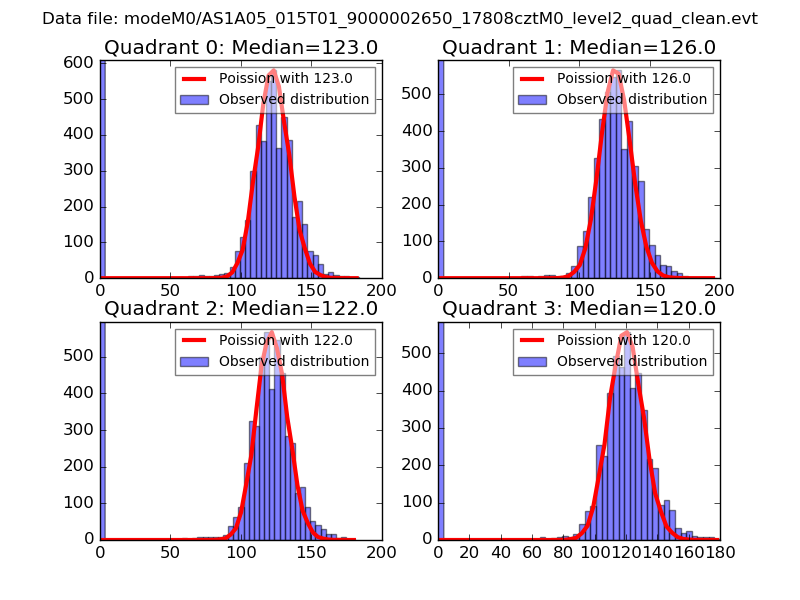 |
 |
| Quadrant-wise count rates Data is divided into 100 sec bins |
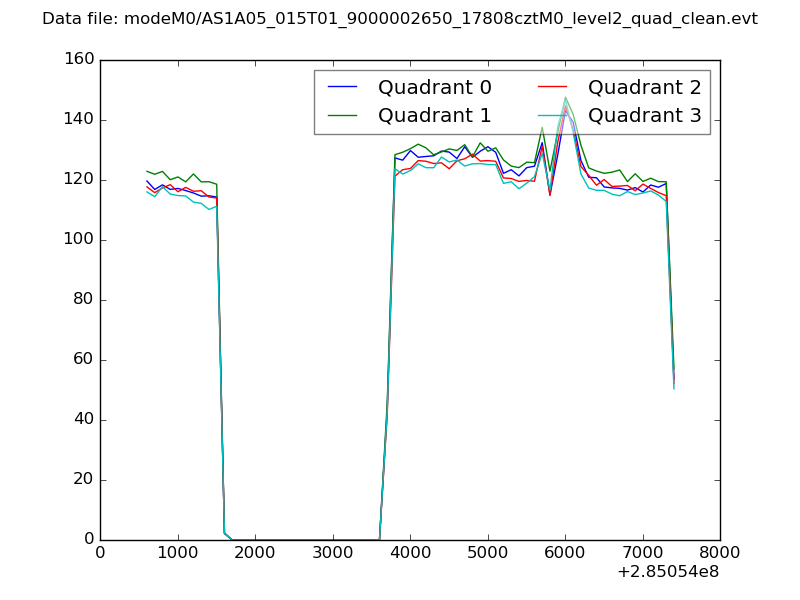 |
|
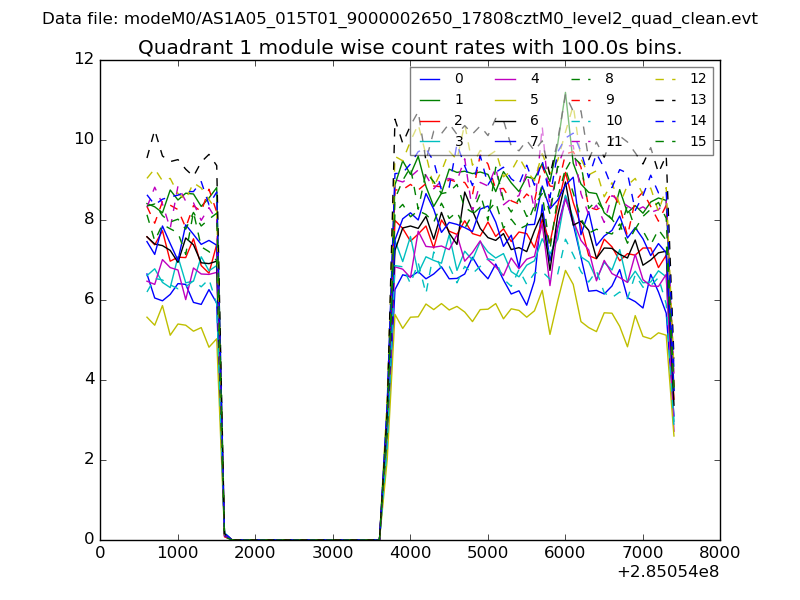
| Module-wise count rates for Quadrant A Data is divided into 100 sec bins |
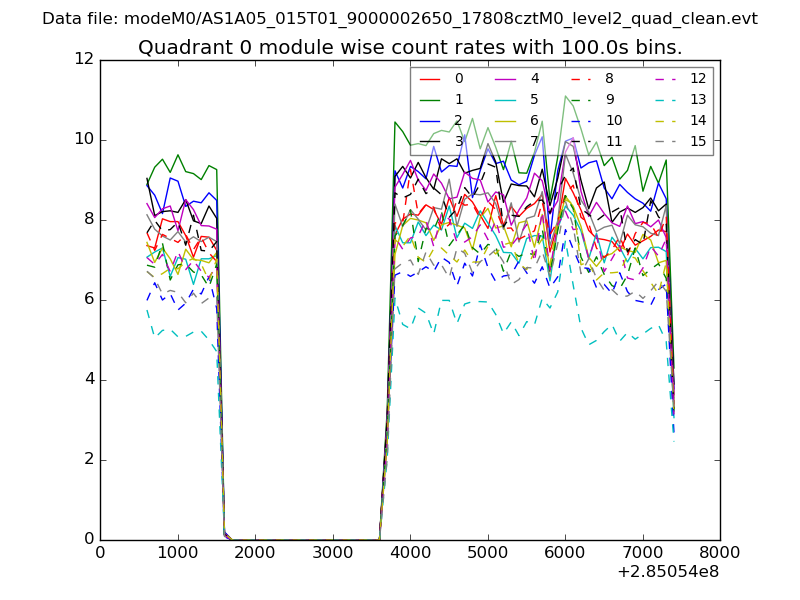 |
 |
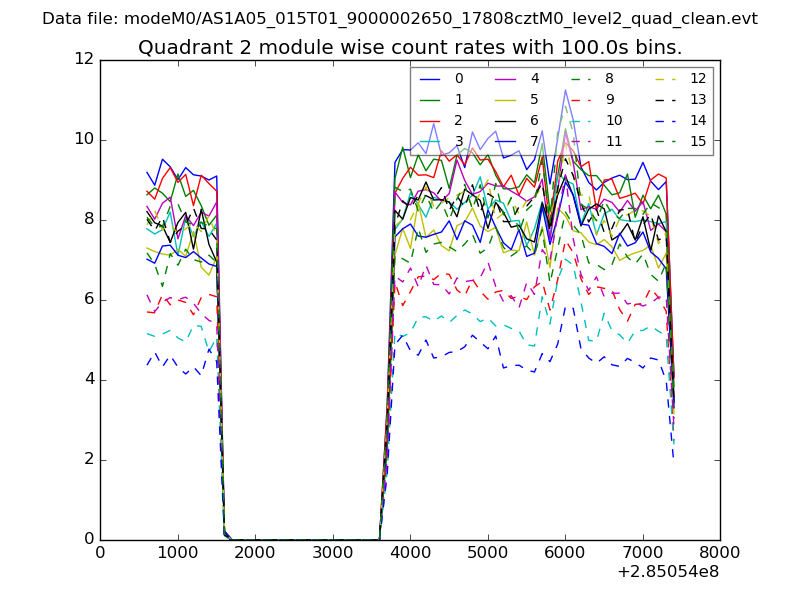
| Module-wise count rates for Quadrant B Data is divided into 100 sec bins |
 |
 |
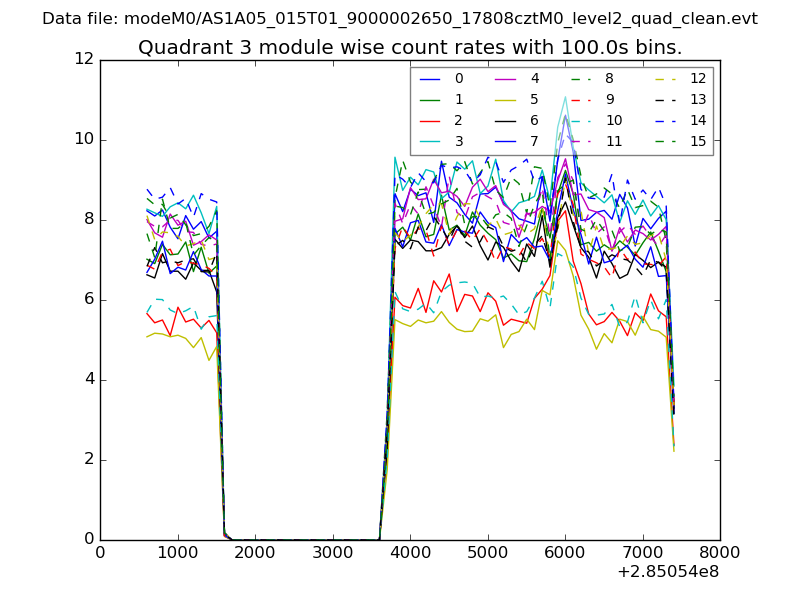
| Module-wise count rates for Quadrant C Data is divided into 100 sec bins |
 |
 |
| Module-wise count rates for Quadrant D Data is divided into 100 sec bins |
 |
 |
| Parameter | Plot |
|---|---|
| CZT HV Monitor | 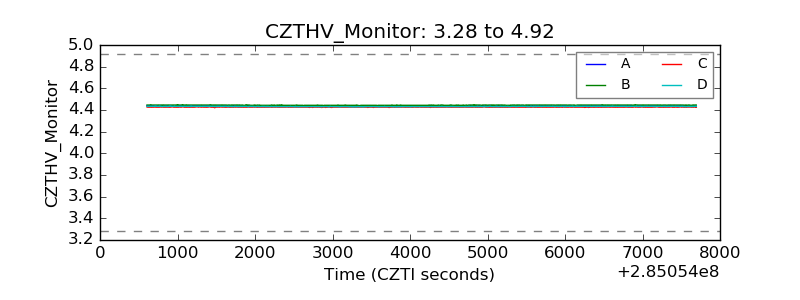 |
| D_VDD | 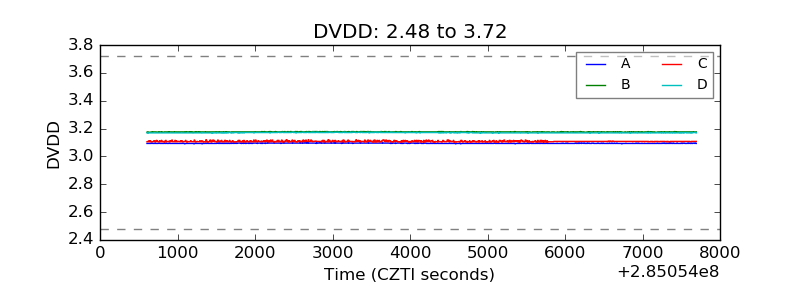 |
| Temperature 1 | 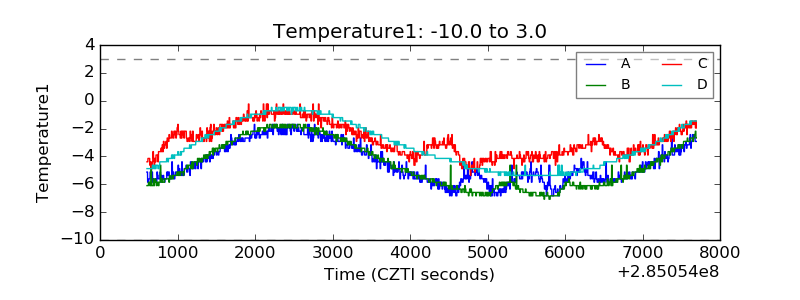 |
| Veto HV Monitor | 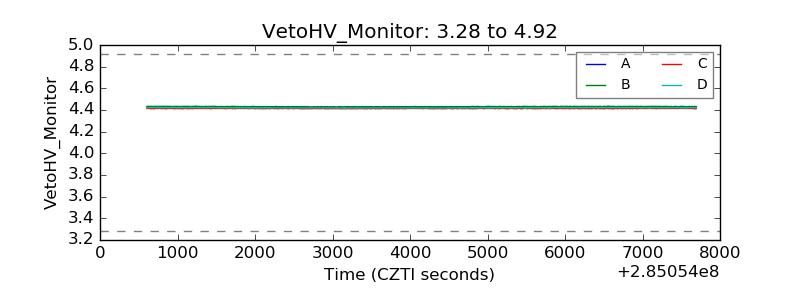 |
| Veto LLD | 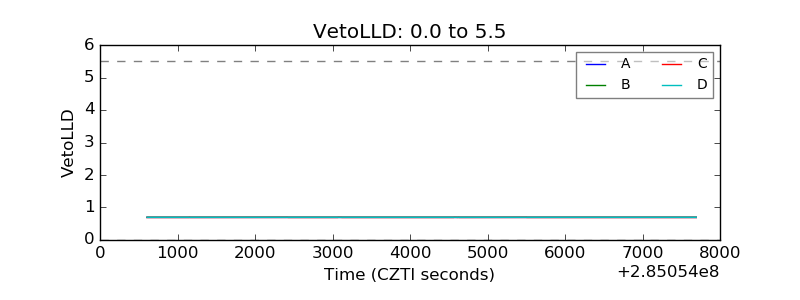 |
| Alpha Counter | 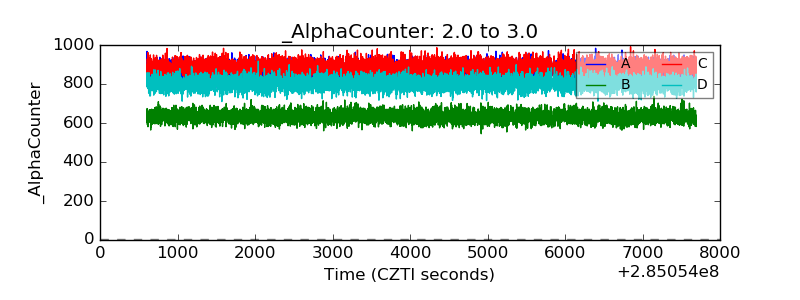 |
| _CPM_Rate | 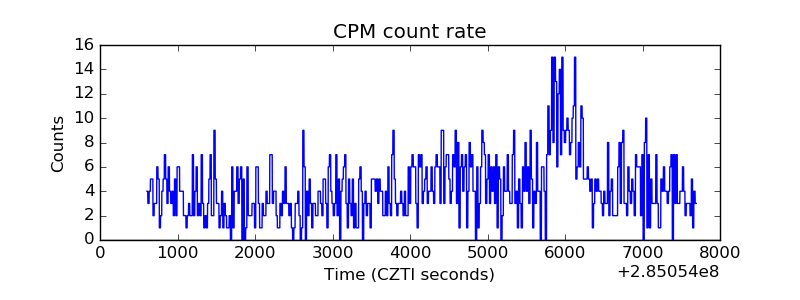 |
| CZT Counter | 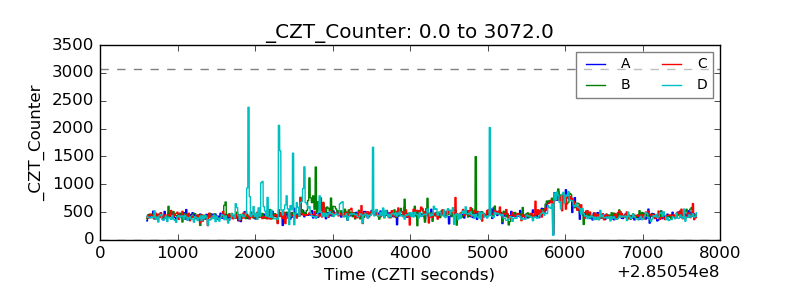 |
| +2.5 Volts monitor |  |
| +5 Volts monitor |  |
| _ROLL_ROT | 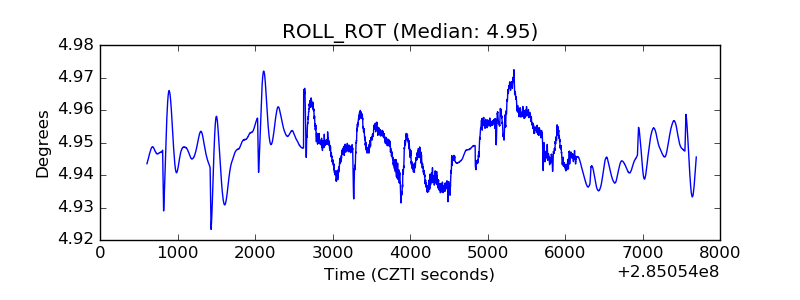 |
| _Roll_DEC |  |
| _Roll_RA | 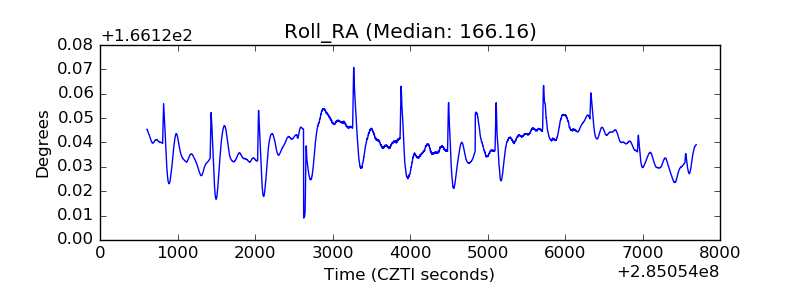 |
| Veto Counter | 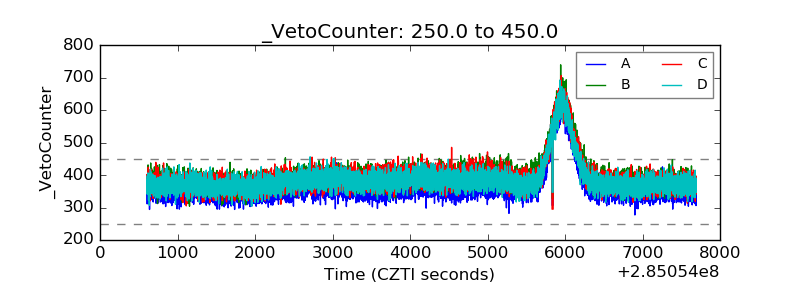 |