| Param | Original file | Final file |
|---|---|---|
| Filename | modeM0/AS1A05_015T01_9000002650_17809cztM0_level2.evt | modeM0/AS1A05_015T01_9000002650_17809cztM0_level2_quad_clean.evt |
| Size (bytes) | 436,250,880 | 80,879,040 |
| Size | 416.0 MB | 77.1 MB |
| Events in quadrant A | 3,099,793 | 498,648 |
| Events in quadrant B | 3,219,029 | 507,700 |
| Events in quadrant C | 3,109,515 | 487,118 |
| Events in quadrant D | 3,324,230 | 485,207 |
| Mode SS | |||
|---|---|---|---|
| Quadrant | BADHDUFLAG | Total packets | Discarded packets |
| A | 0 | 136 | 0 |
| B | 0 | 136 | 0 |
| C | 0 | 136 | 0 |
| D | 0 | 136 | 0 |
| Mode M9 | |||
|---|---|---|---|
| Quadrant | BADHDUFLAG | Total packets | Discarded packets |
| A | 0 | 4 | 0 |
| B | 0 | 4 | 0 |
| C | 0 | 4 | 0 |
| D | 0 | 4 | 0 |
| Mode M0 | |||
|---|---|---|---|
| Quadrant | BADHDUFLAG | Total packets | Discarded packets |
| A | 0 | 13831 | 1 |
| B | 0 | 14009 | 1 |
| C | 0 | 13748 | 1 |
| D | 0 | 14774 | 1 |
| Quadrant | Total seconds | Saturated seconds | Saturation percentage |
|---|---|---|---|
| A | 6759 | 107 | 1.583074% |
| B | 6760 | 120 | 1.775148% |
| C | 6760 | 124 | 1.834320% |
| D | 6760 | 190 | 2.810651% |
Noise dominated data is calculated using 1-second bins in cleaned event files. If a bin has >2000 counts, and if more than 50% of those come from <1% of pixels, then it is considered to be noise-dominated and hence unusable.
| Quadrant | # 1 sec bins | Bins with >0 counts | Bins with >2000 counts | High rate bins dominated by noise | Noise dominated (total time) | Noise dominated (detector-on time) | Marked lightcurve |
|---|---|---|---|---|---|---|---|
| A | 7039 | 6761 | 1 | 1 | 0.01% | 0.01% |  |
| B | 7040 | 6761 | 6 | 6 | 0.09% | 0.09% |  |
| C | 7040 | 6762 | 0 | 0 | 0.00% | 0.00% |  |
| D | 7040 | 6761 | 48 | 48 | 0.68% | 0.71% |  |
Top three noisy pixels from each quadrant. If the there are fewer than three noisy pixels in the level2.evt file, extra rows are filled as -1
| Pixel properties | Quadrant properties | ||||||
|---|---|---|---|---|---|---|---|
| Quadrant | DetID | PixID | Counts | Sigma | Mean | Median | Sigma |
| A | 15 | 174 | 32405 | 195.05 | 797 | 781 | 162.1 |
| A | 0 | 226 | 6959 | 38.1 | 797 | 781 | 162.1 |
| A | 3 | 137 | 6139 | 33.05 | 797 | 781 | 162.1 |
| B | 7 | 220 | 47164 | 297.39 | 797 | 776 | 156.0 |
| B | 12 | 111 | 18417 | 113.1 | 797 | 776 | 156.0 |
| B | 11 | 111 | 16230 | 99.07 | 797 | 776 | 156.0 |
| C | 14 | 238 | 116942 | 645.39 | 762 | 766 | 180.0 |
| C | 5 | 218 | 12281 | 63.97 | 762 | 766 | 180.0 |
| C | 3 | 233 | 7520 | 37.52 | 762 | 766 | 180.0 |
| D | 7 | 238 | 295840 | 1601.68 | 767 | 746 | 184.2 |
| D | 10 | 70 | 86868 | 467.44 | 767 | 746 | 184.2 |
| D | 2 | 234 | 30939 | 163.88 | 767 | 746 | 184.2 |
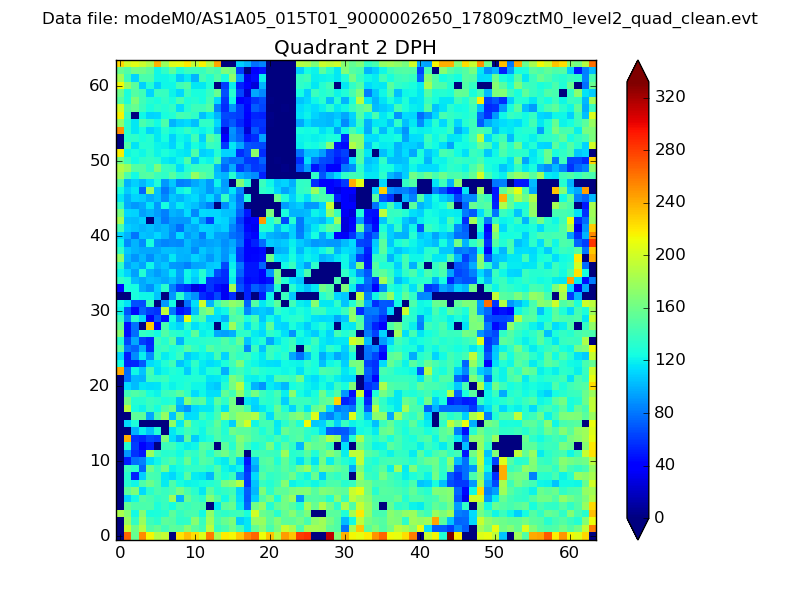
Histogram calculated using DETX and DETY for each event in the final _common_clean file
| Quadrant A | 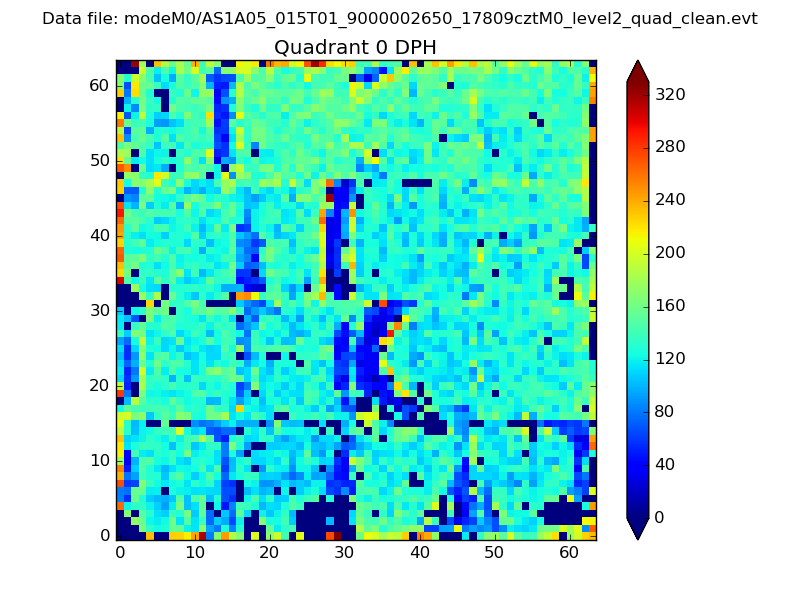 |
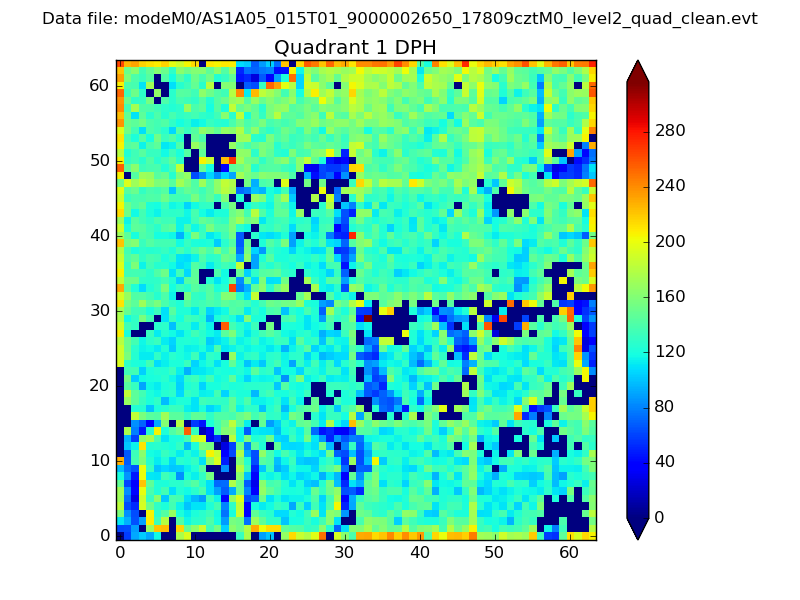 |
Quadrant B |
|---|---|---|---|
| Quadrant D | 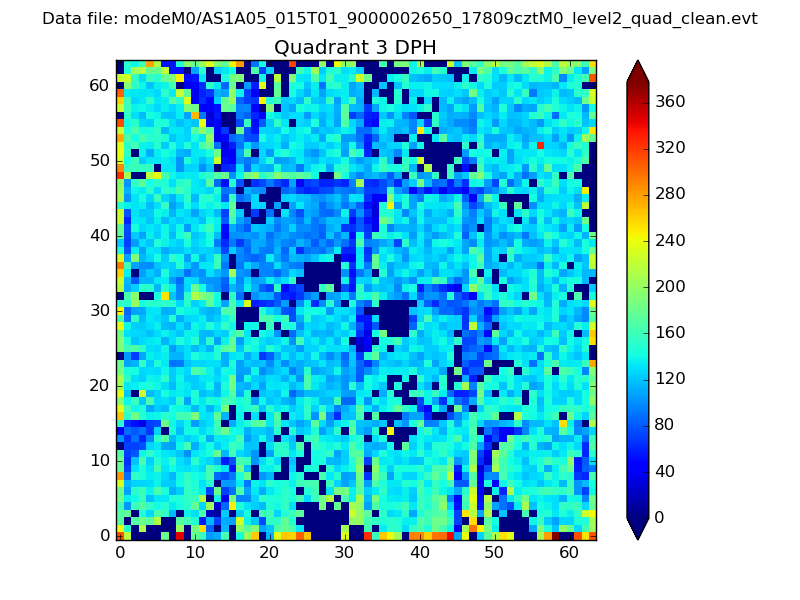 |
 |
Quadrant C |
| Plot type | Count rate plots | Images |
|---|---|---|
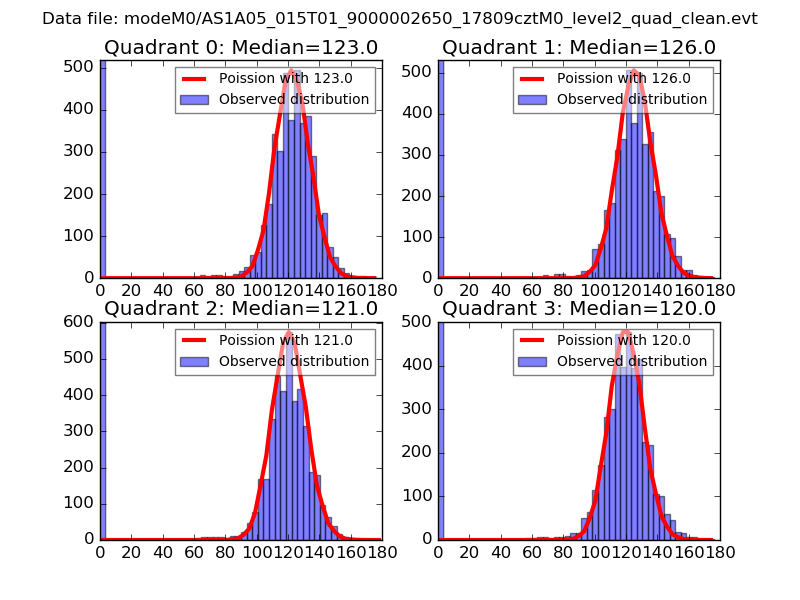
| Comparison with Poisson distribution Blue bars denote a histogram of data divided into 1 sec bins. Red curve is a Poisson curve with rate = median count rate of data. |
 |
 |
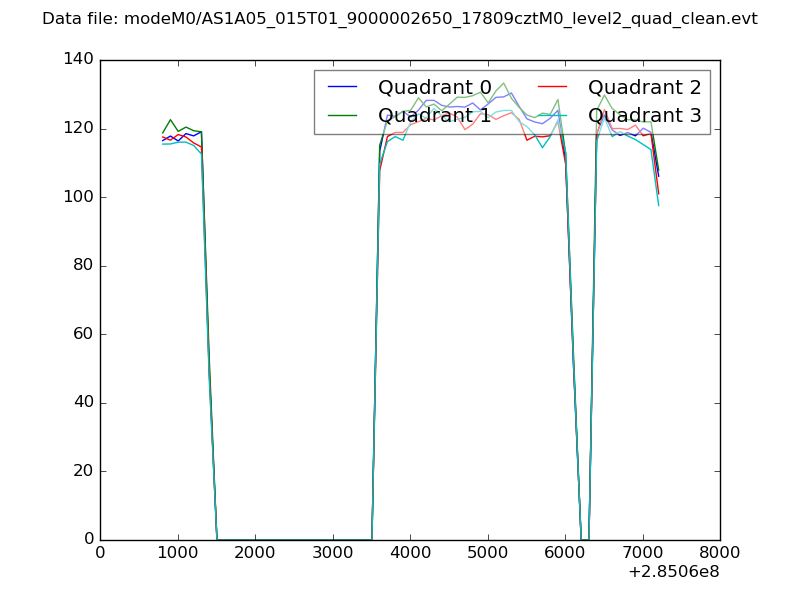
| Quadrant-wise count rates Data is divided into 100 sec bins |
 |
|
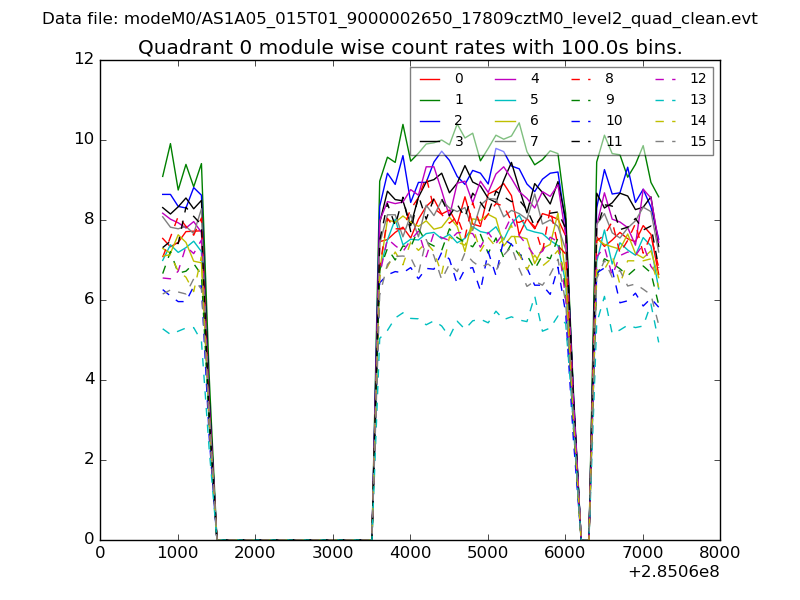
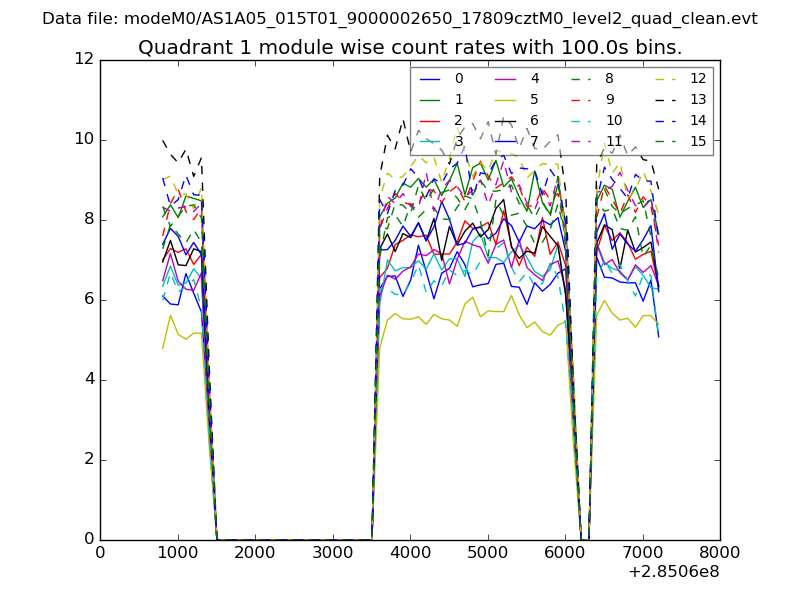
| Module-wise count rates for Quadrant A Data is divided into 100 sec bins |
 |
 |
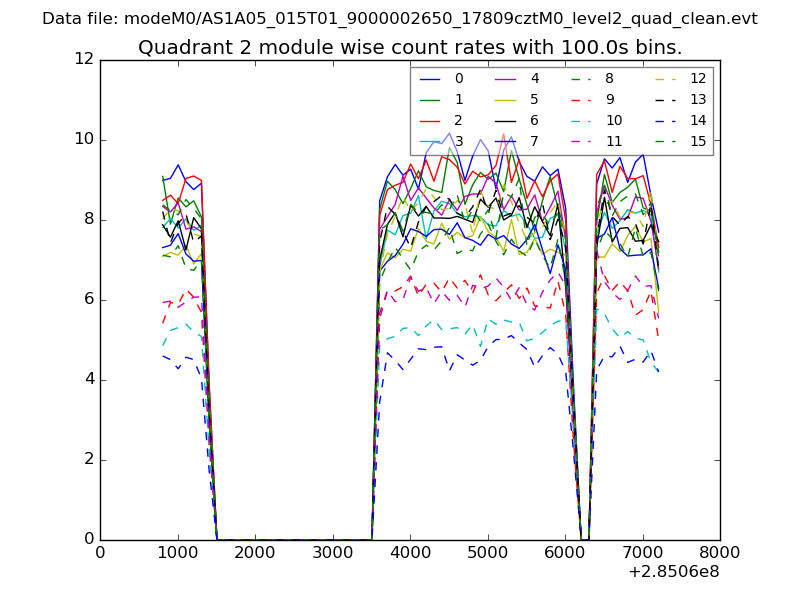
| Module-wise count rates for Quadrant B Data is divided into 100 sec bins |
 |
 |
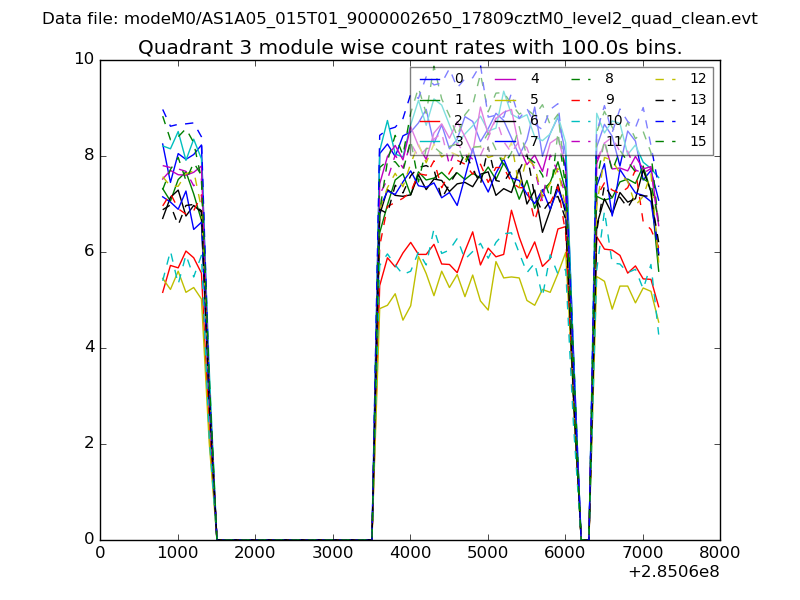
| Module-wise count rates for Quadrant C Data is divided into 100 sec bins |
 |
 |
| Module-wise count rates for Quadrant D Data is divided into 100 sec bins |
 |
 |
| Parameter | Plot |
|---|---|
| CZT HV Monitor | 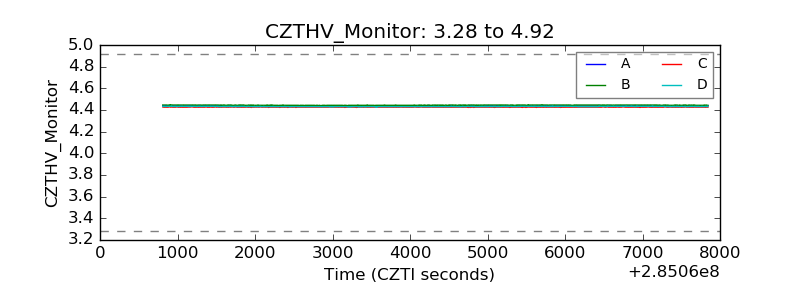 |
| D_VDD | 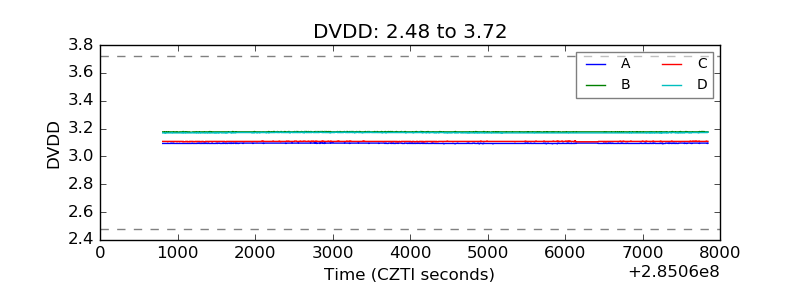 |
| Temperature 1 | 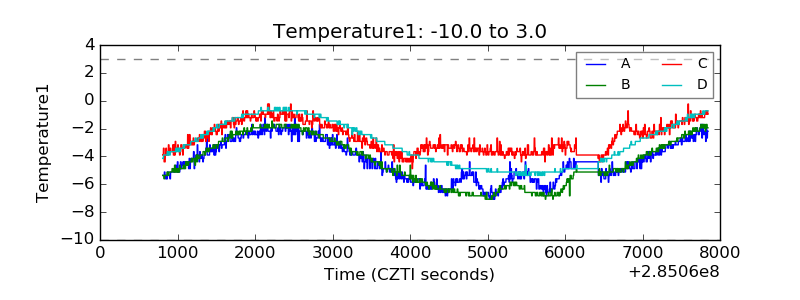 |
| Veto HV Monitor | 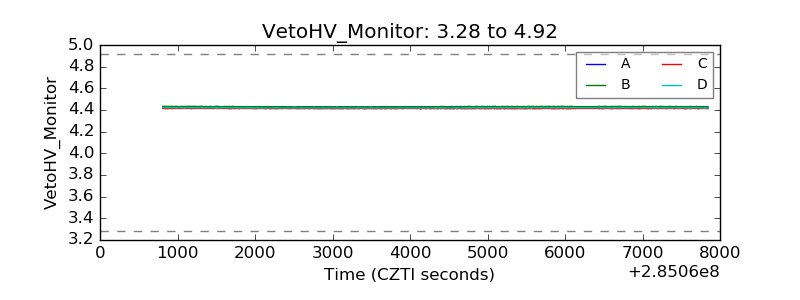 |
| Veto LLD | 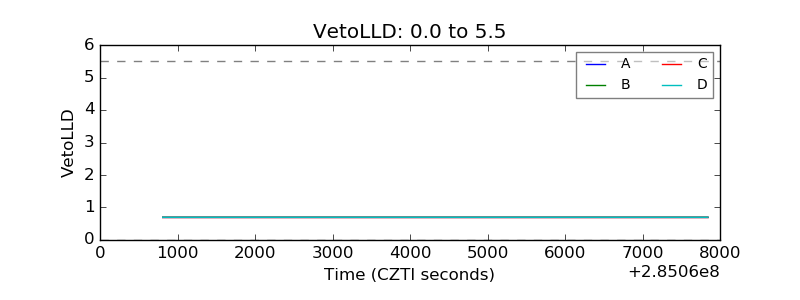 |
| Alpha Counter | 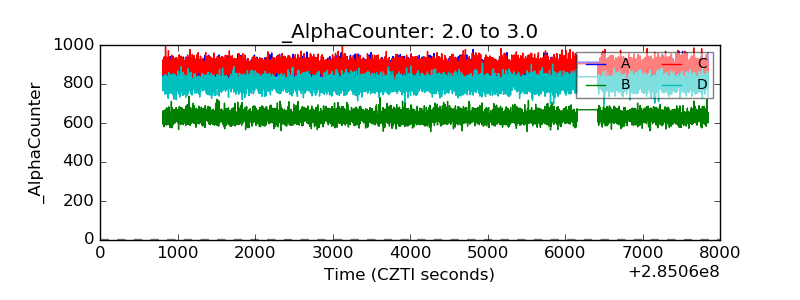 |
| _CPM_Rate | 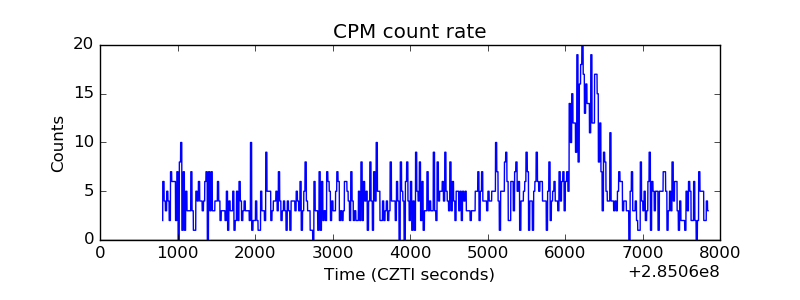 |
| CZT Counter | 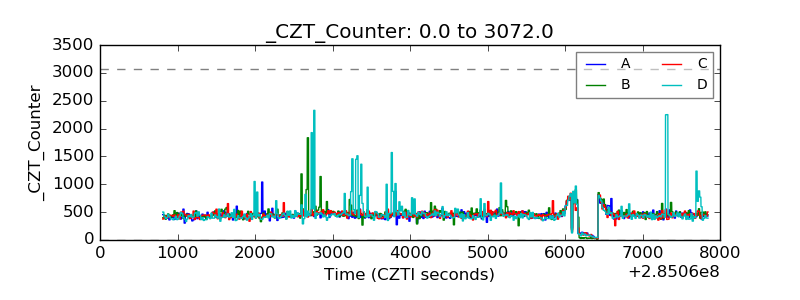 |
| +2.5 Volts monitor |  |
| +5 Volts monitor | 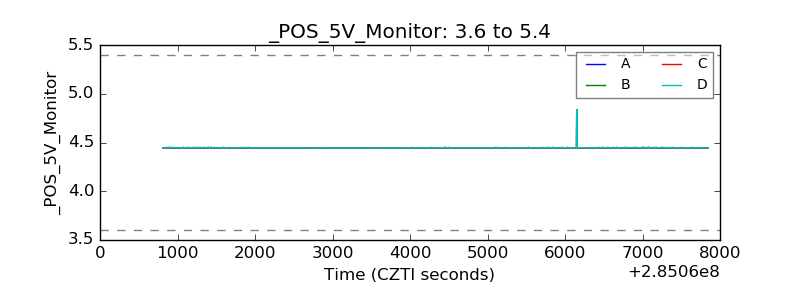 |
| _ROLL_ROT |  |
| _Roll_DEC |  |
| _Roll_RA | 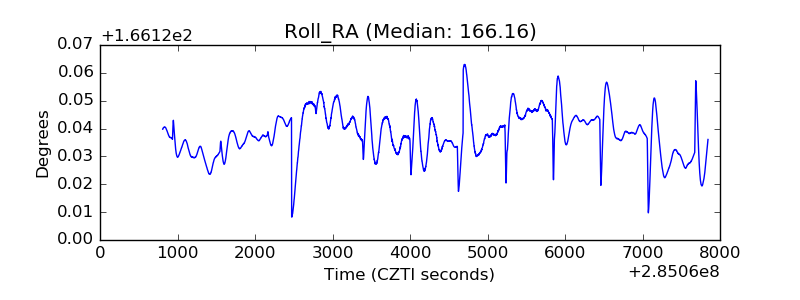 |
| Veto Counter |  |