| Param | Original file | Final file |
|---|---|---|
| Filename | modeM0/AS1A05_015T01_9000002650_17812cztM0_level2.evt | modeM0/AS1A05_015T01_9000002650_17812cztM0_level2_quad_clean.evt |
| Size (bytes) | 460,889,280 | 69,428,160 |
| Size | 439.5 MB | 66.2 MB |
| Events in quadrant A | 3,252,163 | 411,419 |
| Events in quadrant B | 3,446,379 | 416,114 |
| Events in quadrant C | 3,253,254 | 399,589 |
| Events in quadrant D | 3,542,063 | 399,051 |
| Mode SS | |||
|---|---|---|---|
| Quadrant | BADHDUFLAG | Total packets | Discarded packets |
| A | 0 | 140 | 0 |
| B | 0 | 140 | 0 |
| C | 0 | 140 | 0 |
| D | 0 | 140 | 0 |
| Mode M9 | |||
|---|---|---|---|
| Quadrant | BADHDUFLAG | Total packets | Discarded packets |
| A | 0 | 9 | 0 |
| B | 0 | 10 | 0 |
| C | 0 | 10 | 0 |
| D | 0 | 10 | 0 |
| Mode M0 | |||
|---|---|---|---|
| Quadrant | BADHDUFLAG | Total packets | Discarded packets |
| A | 0 | 14139 | 3 |
| B | 0 | 14638 | 2 |
| C | 0 | 14016 | 2 |
| D | 0 | 15160 | 2 |
| Quadrant | Total seconds | Saturated seconds | Saturation percentage |
|---|---|---|---|
| A | 6825 | 77 | 1.128205% |
| B | 6825 | 101 | 1.479853% |
| C | 6825 | 105 | 1.538462% |
| D | 6825 | 120 | 1.758242% |
Noise dominated data is calculated using 1-second bins in cleaned event files. If a bin has >2000 counts, and if more than 50% of those come from <1% of pixels, then it is considered to be noise-dominated and hence unusable.
| Quadrant | # 1 sec bins | Bins with >0 counts | Bins with >2000 counts | High rate bins dominated by noise | Noise dominated (total time) | Noise dominated (detector-on time) | Marked lightcurve |
|---|---|---|---|---|---|---|---|
| A | 7665 | 6825 | 1 | 1 | 0.01% | 0.01% |  |
| B | 7665 | 6825 | 17 | 17 | 0.22% | 0.25% | 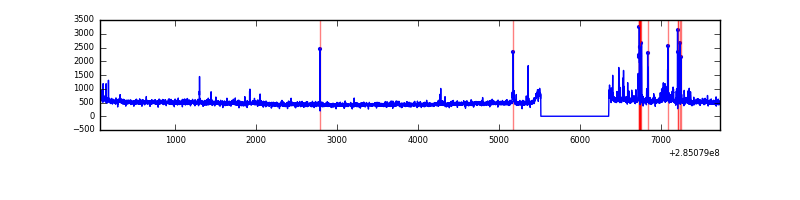 |
| C | 7665 | 6825 | 0 | 0 | 0.00% | 0.00% | 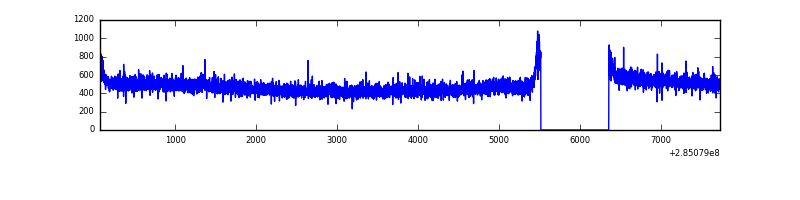 |
| D | 7665 | 6825 | 38 | 38 | 0.50% | 0.56% |  |
Top three noisy pixels from each quadrant. If the there are fewer than three noisy pixels in the level2.evt file, extra rows are filled as -1
| Pixel properties | Quadrant properties | ||||||
|---|---|---|---|---|---|---|---|
| Quadrant | DetID | PixID | Counts | Sigma | Mean | Median | Sigma |
| A | 15 | 174 | 37125 | 213.94 | 834 | 816 | 169.7 |
| A | 0 | 226 | 7431 | 38.98 | 834 | 816 | 169.7 |
| A | 3 | 137 | 6190 | 31.66 | 834 | 816 | 169.7 |
| B | 10 | 245 | 111250 | 680.71 | 831 | 809 | 162.2 |
| B | 7 | 220 | 49189 | 298.19 | 831 | 809 | 162.2 |
| B | 12 | 111 | 18913 | 111.58 | 831 | 809 | 162.2 |
| C | 14 | 238 | 123337 | 649.79 | 800 | 803 | 188.6 |
| C | 3 | 233 | 6736 | 31.46 | 800 | 803 | 188.6 |
| C | 13 | 61 | 5614 | 25.51 | 800 | 803 | 188.6 |
| D | 7 | 238 | 189372 | 960.54 | 810 | 790 | 196.3 |
| D | 1 | 52 | 124529 | 630.27 | 810 | 790 | 196.3 |
| D | 10 | 70 | 86561 | 436.88 | 810 | 790 | 196.3 |
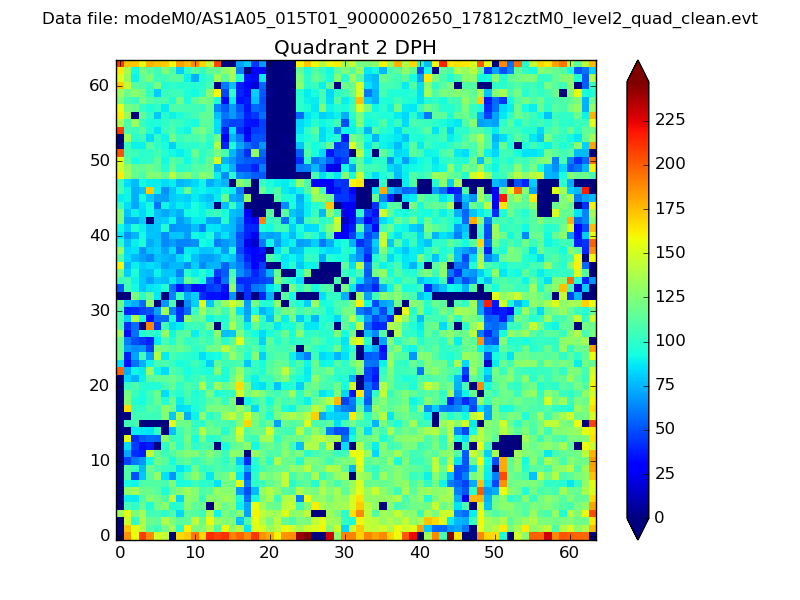
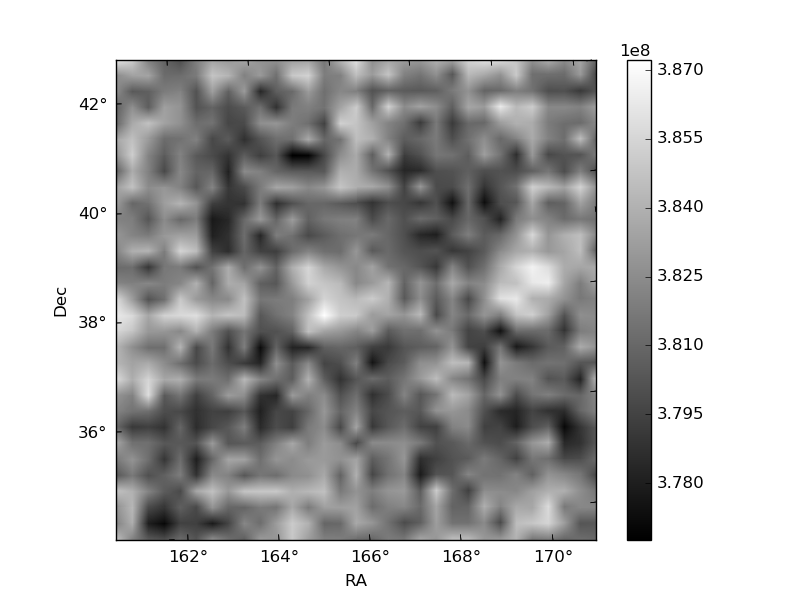
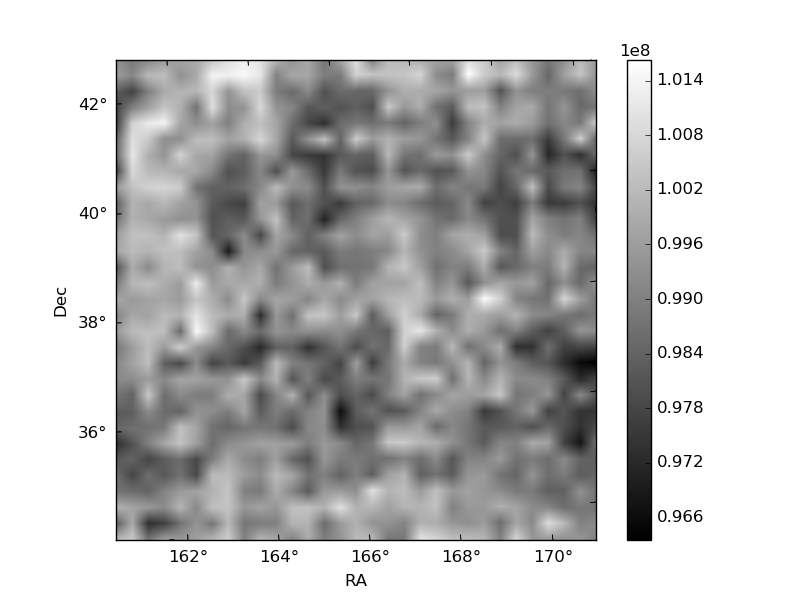
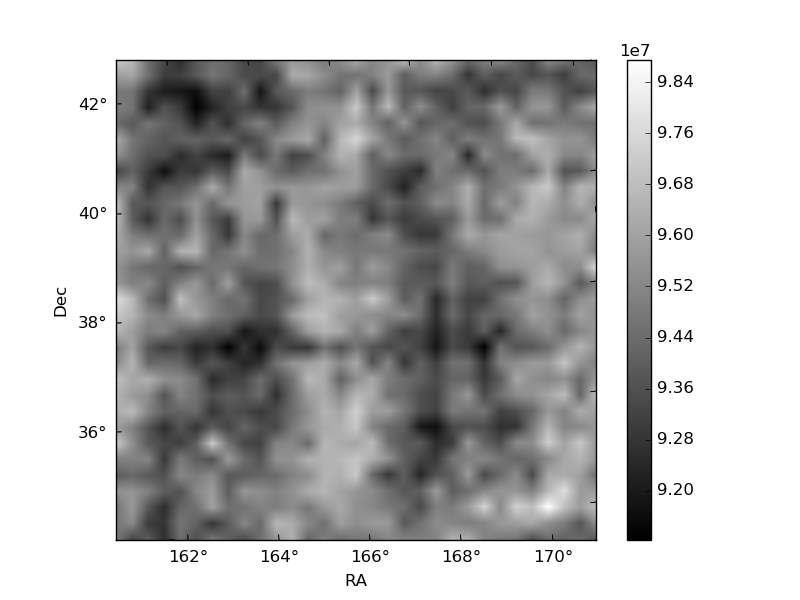
Histogram calculated using DETX and DETY for each event in the final _common_clean file
| Quadrant A |  |
 |
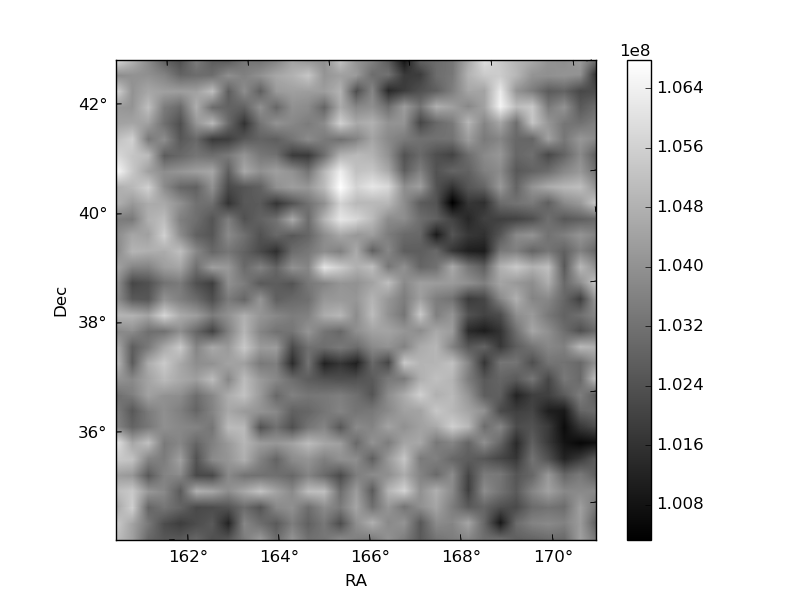
Quadrant B |
|---|---|---|---|
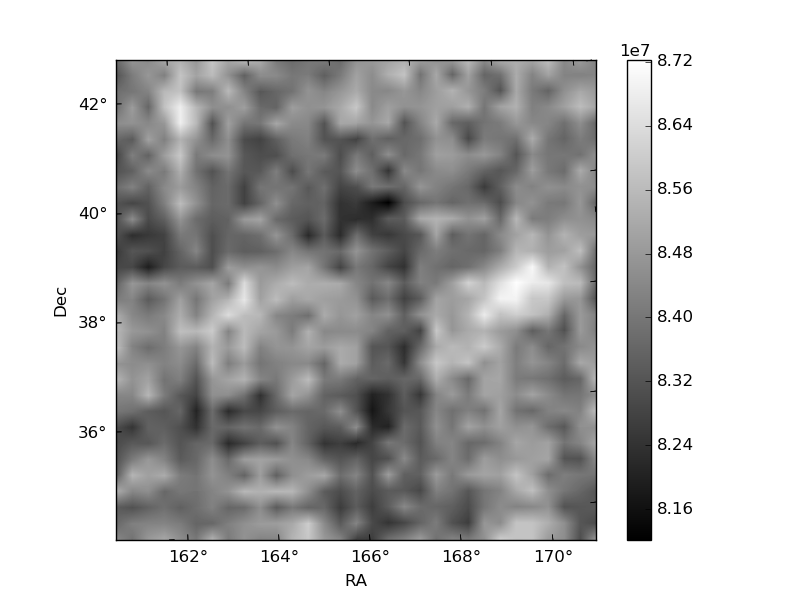
| Quadrant D | 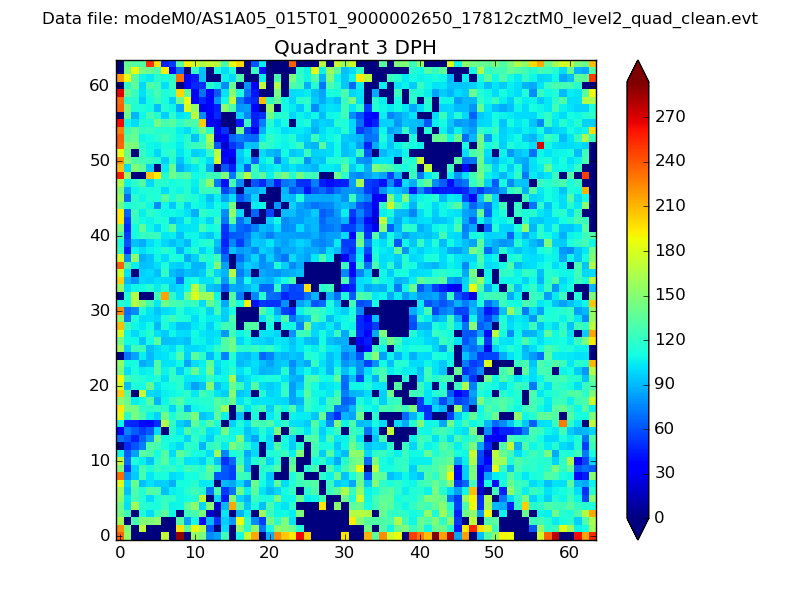 |
 |
Quadrant C |
| Plot type | Count rate plots | Images |
|---|---|---|
| Comparison with Poisson distribution Blue bars denote a histogram of data divided into 1 sec bins. Red curve is a Poisson curve with rate = median count rate of data. |
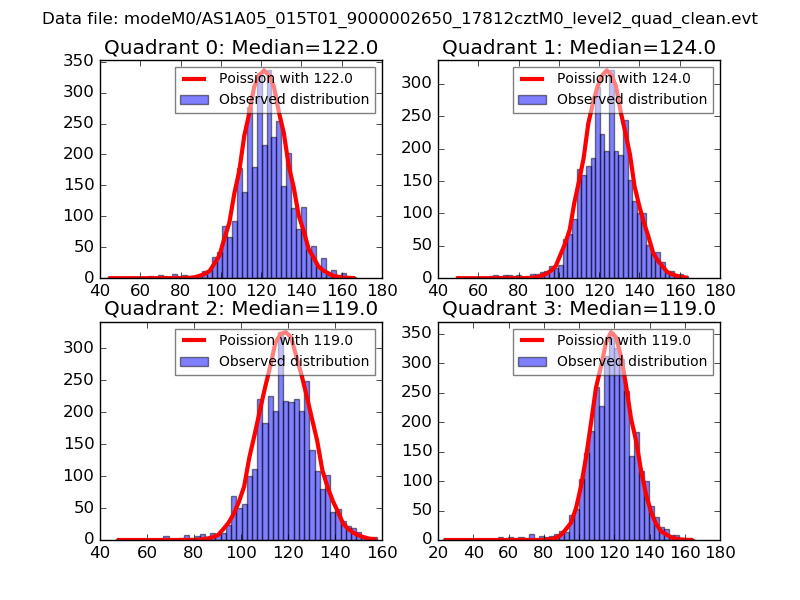 |
 |
| Quadrant-wise count rates Data is divided into 100 sec bins |
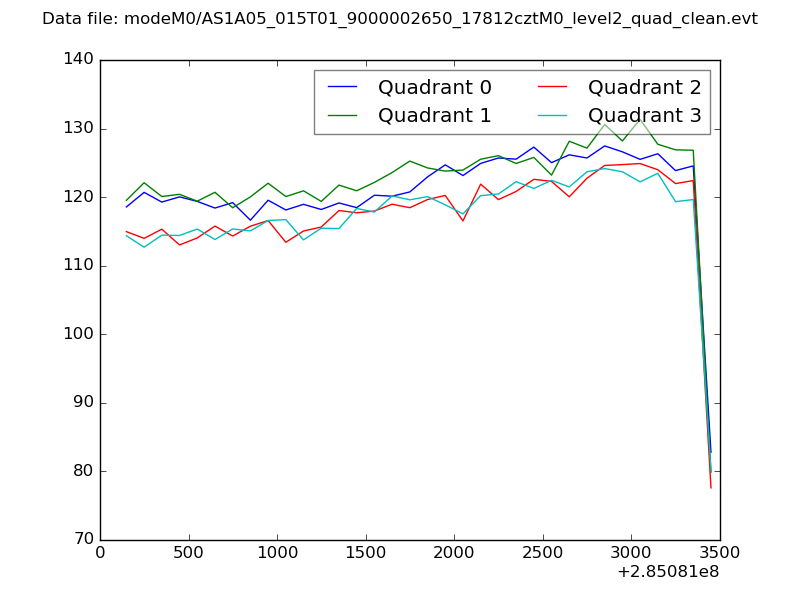 |
|
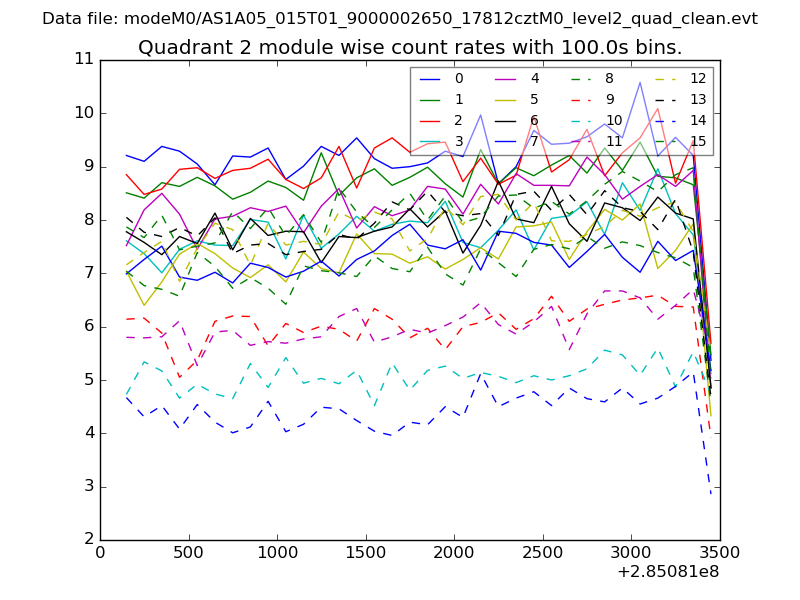
| Module-wise count rates for Quadrant A Data is divided into 100 sec bins |
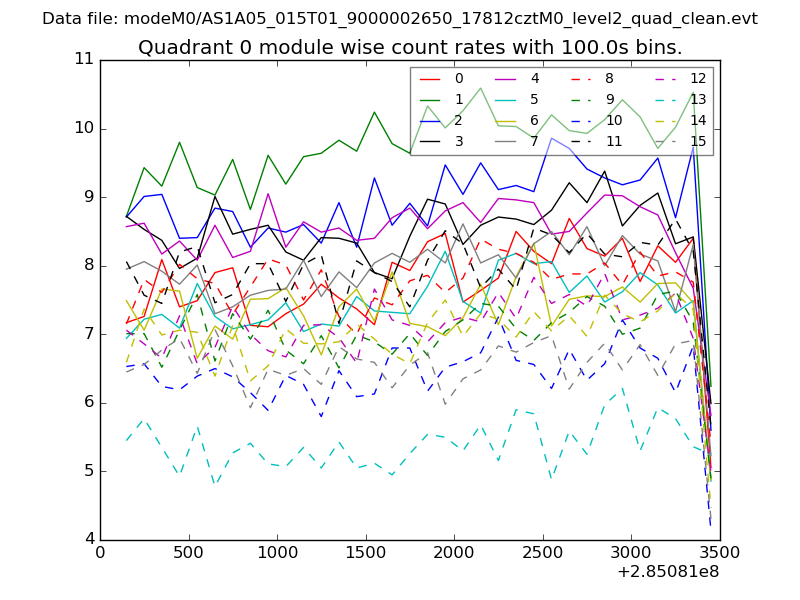 |
 |
| Module-wise count rates for Quadrant B Data is divided into 100 sec bins |
 |
 |
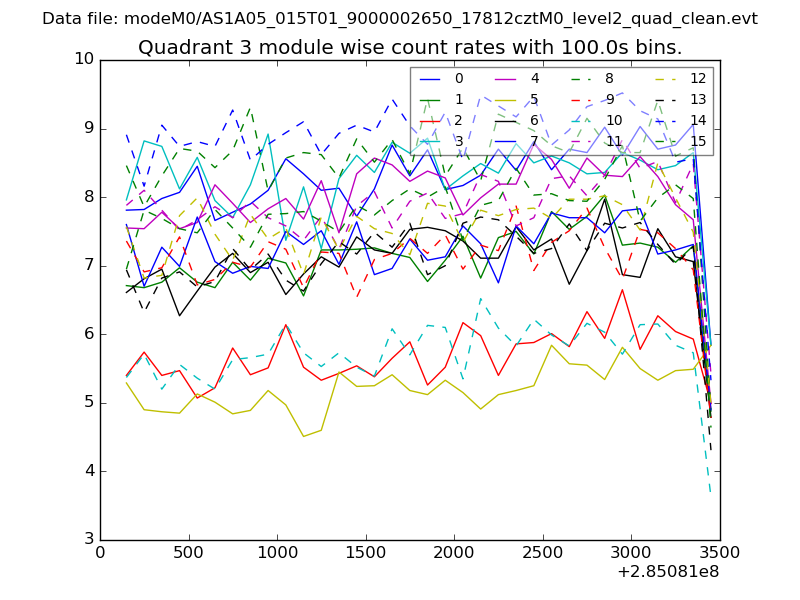
| Module-wise count rates for Quadrant C Data is divided into 100 sec bins |
 |
 |
| Module-wise count rates for Quadrant D Data is divided into 100 sec bins |
 |
 |
| Parameter | Plot |
|---|---|
| CZT HV Monitor |  |
| D_VDD | 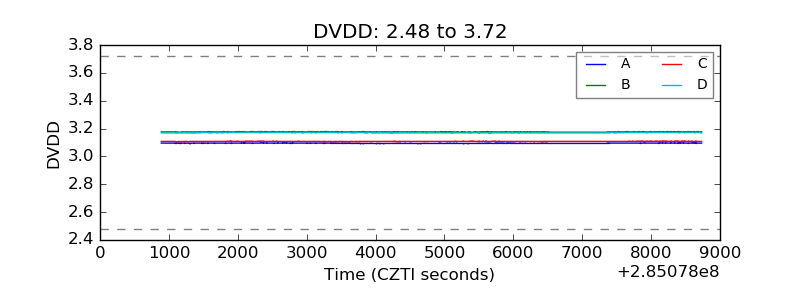 |
| Temperature 1 | 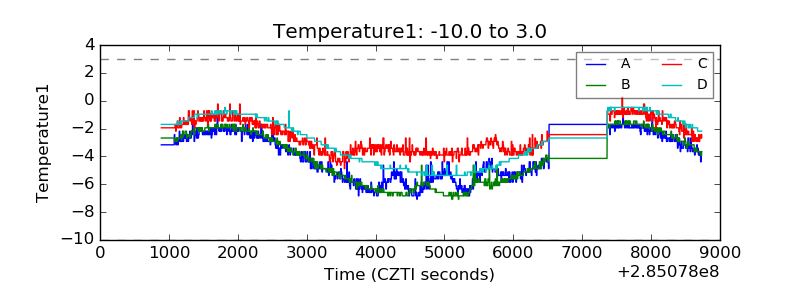 |
| Veto HV Monitor | 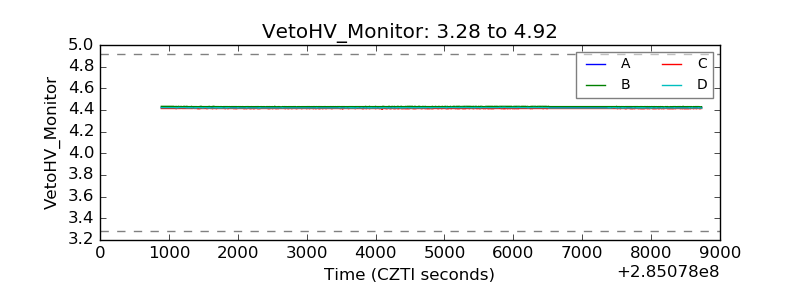 |
| Veto LLD | 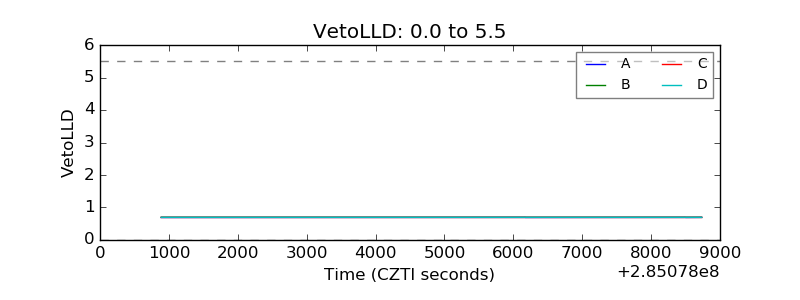 |
| Alpha Counter | 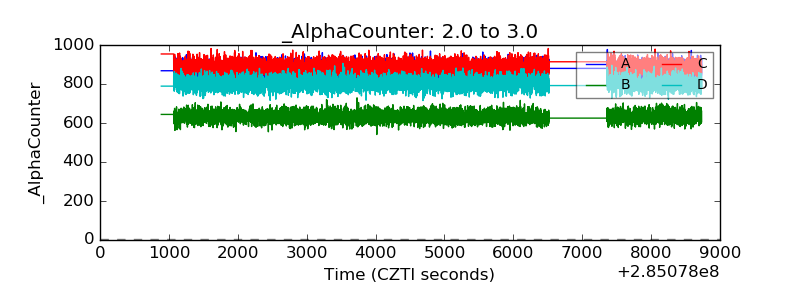 |
| _CPM_Rate | 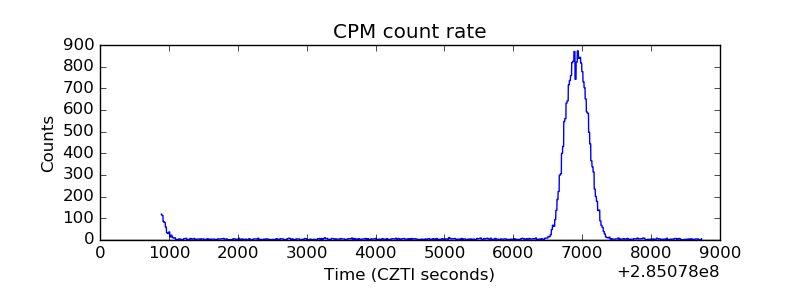 |
| CZT Counter | 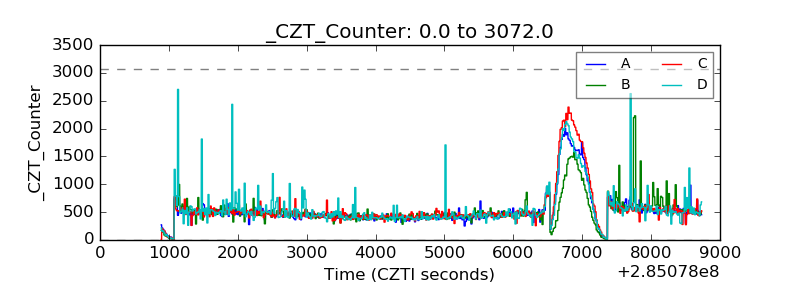 |
| +2.5 Volts monitor |  |
| +5 Volts monitor |  |
| _ROLL_ROT | 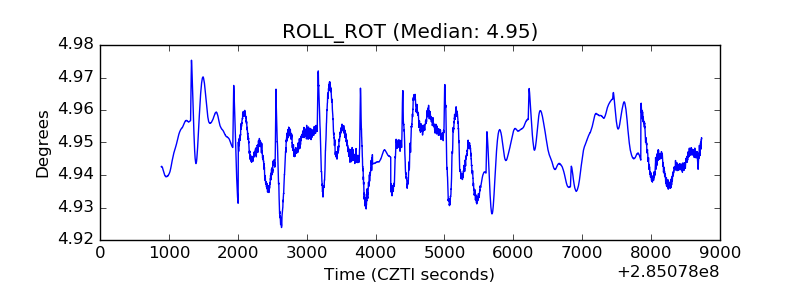 |
| _Roll_DEC | 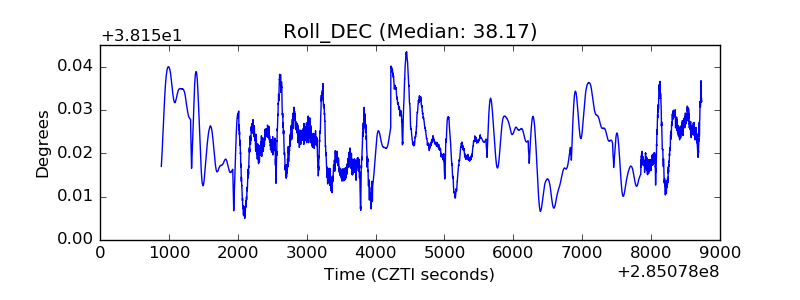 |
| _Roll_RA | 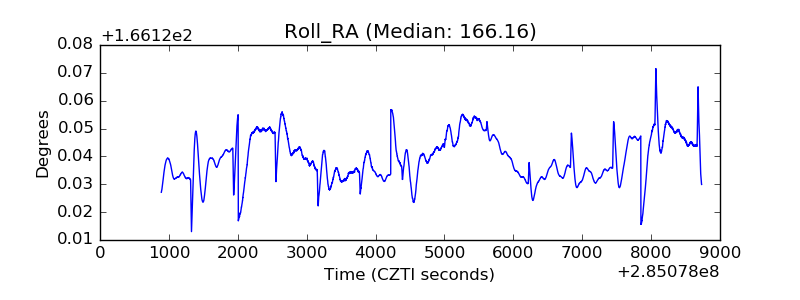 |
| Veto Counter | 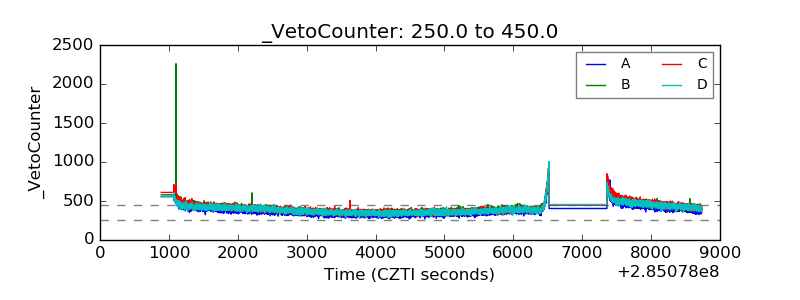 |