| Param | Original file | Final file |
|---|---|---|
| Filename | modeM0/AS1A05_015T01_9000002650_17813cztM0_level2.evt | modeM0/AS1A05_015T01_9000002650_17813cztM0_level2_quad_clean.evt |
| Size (bytes) | 491,238,720 | 77,336,640 |
| Size | 468.5 MB | 73.8 MB |
| Events in quadrant A | 3,281,483 | 480,371 |
| Events in quadrant B | 3,573,172 | 484,673 |
| Events in quadrant C | 3,340,617 | 468,328 |
| Events in quadrant D | 4,226,666 | 441,070 |
| Mode SS | |||
|---|---|---|---|
| Quadrant | BADHDUFLAG | Total packets | Discarded packets |
| A | 0 | 138 | 0 |
| B | 0 | 138 | 0 |
| C | 0 | 138 | 0 |
| D | 0 | 138 | 0 |
| Mode M9 | |||
|---|---|---|---|
| Quadrant | BADHDUFLAG | Total packets | Discarded packets |
| A | 0 | 18 | 0 |
| B | 0 | 18 | 0 |
| C | 0 | 18 | 0 |
| D | 0 | 18 | 0 |
| Mode M0 | |||
|---|---|---|---|
| Quadrant | BADHDUFLAG | Total packets | Discarded packets |
| A | 0 | 14250 | 2 |
| B | 0 | 15150 | 2 |
| C | 0 | 14324 | 2 |
| D | 0 | 17097 | 2 |
| Quadrant | Total seconds | Saturated seconds | Saturation percentage |
|---|---|---|---|
| A | 6701 | 99 | 1.477391% |
| B | 6702 | 161 | 2.402268% |
| C | 6702 | 152 | 2.267980% |
| D | 6702 | 368 | 5.490898% |
Noise dominated data is calculated using 1-second bins in cleaned event files. If a bin has >2000 counts, and if more than 50% of those come from <1% of pixels, then it is considered to be noise-dominated and hence unusable.
| Quadrant | # 1 sec bins | Bins with >0 counts | Bins with >2000 counts | High rate bins dominated by noise | Noise dominated (total time) | Noise dominated (detector-on time) | Marked lightcurve |
|---|---|---|---|---|---|---|---|
| A | 8576 | 6702 | 2 | 2 | 0.02% | 0.03% | 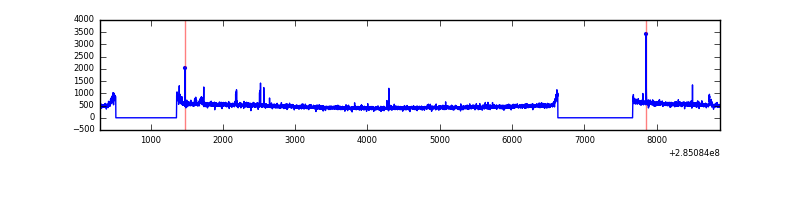 |
| B | 8577 | 6703 | 27 | 27 | 0.31% | 0.40% | 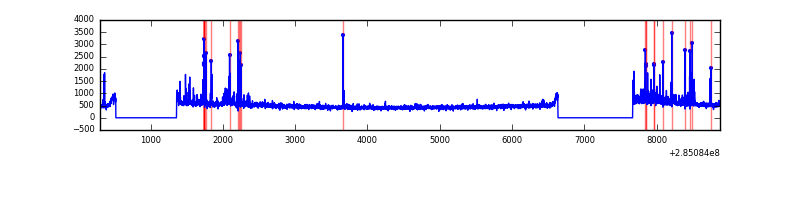 |
| C | 8577 | 6703 | 3 | 3 | 0.03% | 0.04% | 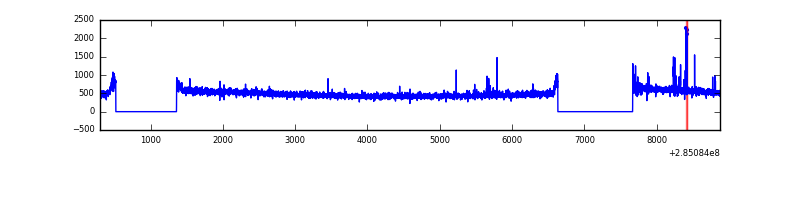 |
| D | 8577 | 6703 | 221 | 221 | 2.58% | 3.30% | 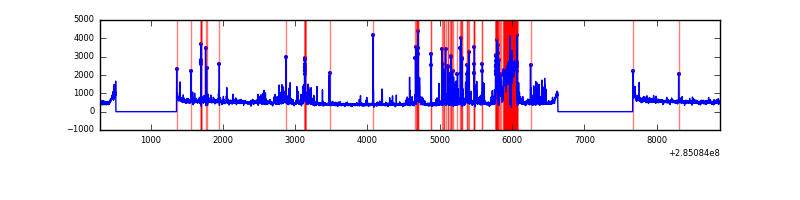 |
Top three noisy pixels from each quadrant. If the there are fewer than three noisy pixels in the level2.evt file, extra rows are filled as -1
| Pixel properties | Quadrant properties | ||||||
|---|---|---|---|---|---|---|---|
| Quadrant | DetID | PixID | Counts | Sigma | Mean | Median | Sigma |
| A | 15 | 174 | 47404 | 272.1 | 840 | 821 | 171.2 |
| A | 0 | 226 | 7455 | 38.75 | 840 | 821 | 171.2 |
| A | 3 | 137 | 6191 | 31.37 | 840 | 821 | 171.2 |
| B | 7 | 220 | 151805 | 933.15 | 837 | 815 | 161.8 |
| B | 10 | 245 | 80784 | 494.22 | 837 | 815 | 161.8 |
| B | 12 | 111 | 18577 | 109.77 | 837 | 815 | 161.8 |
| C | 14 | 238 | 124753 | 652.52 | 809 | 813 | 189.9 |
| C | 9 | 160 | 26035 | 132.79 | 809 | 813 | 189.9 |
| C | 9 | 176 | 18028 | 90.63 | 809 | 813 | 189.9 |
| D | 7 | 238 | 833811 | 4328.26 | 798 | 778 | 192.5 |
| D | 2 | 165 | 200620 | 1038.34 | 798 | 778 | 192.5 |
| D | 1 | 52 | 75241 | 386.89 | 798 | 778 | 192.5 |
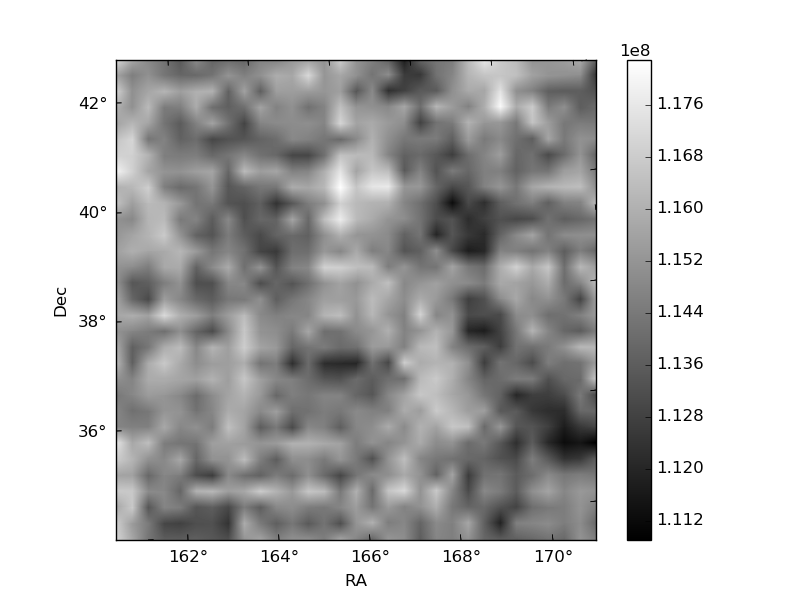
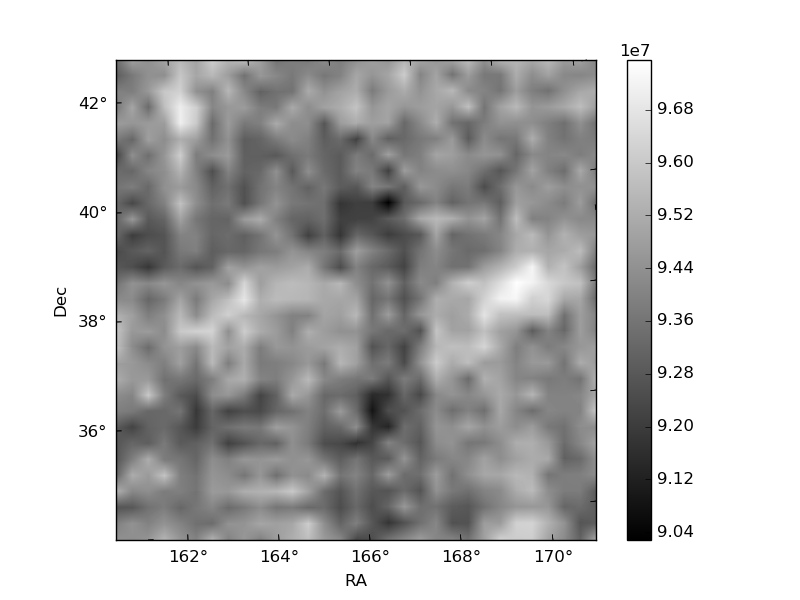
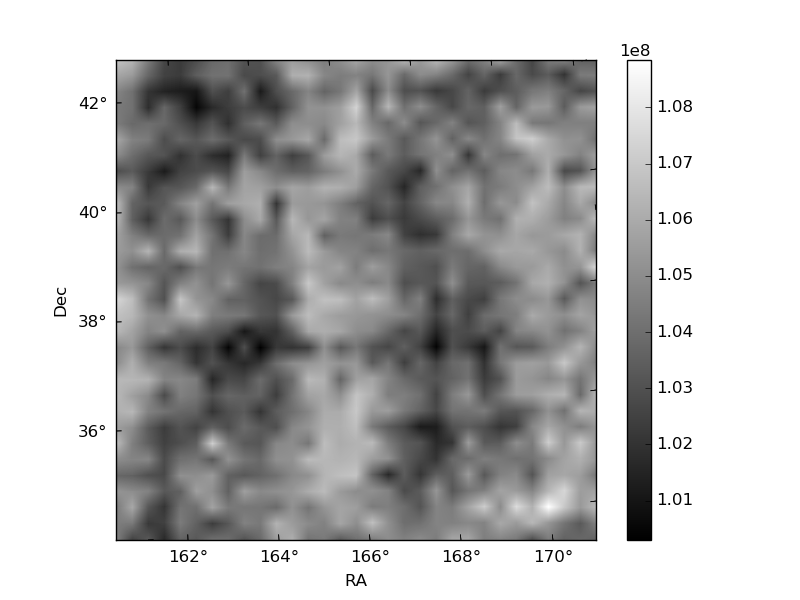
Histogram calculated using DETX and DETY for each event in the final _common_clean file
| Quadrant A | 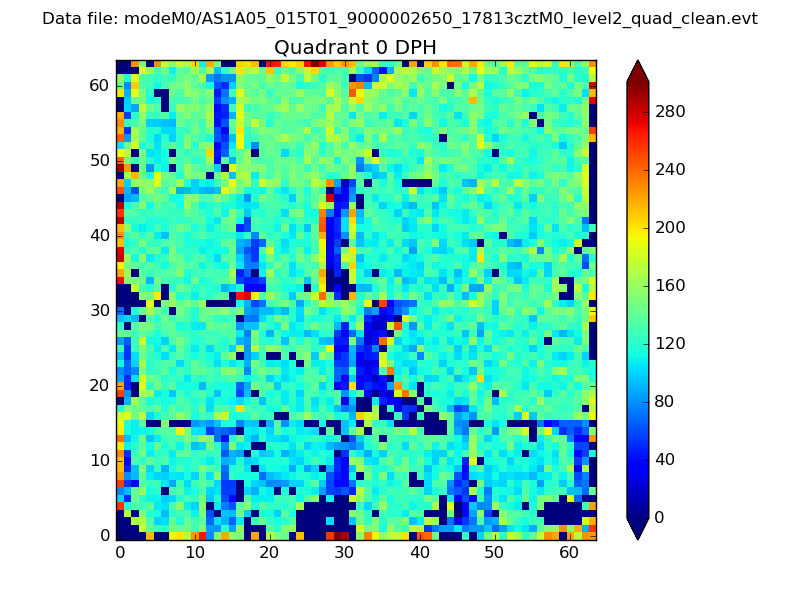 |
 |
Quadrant B |
|---|---|---|---|
| Quadrant D | 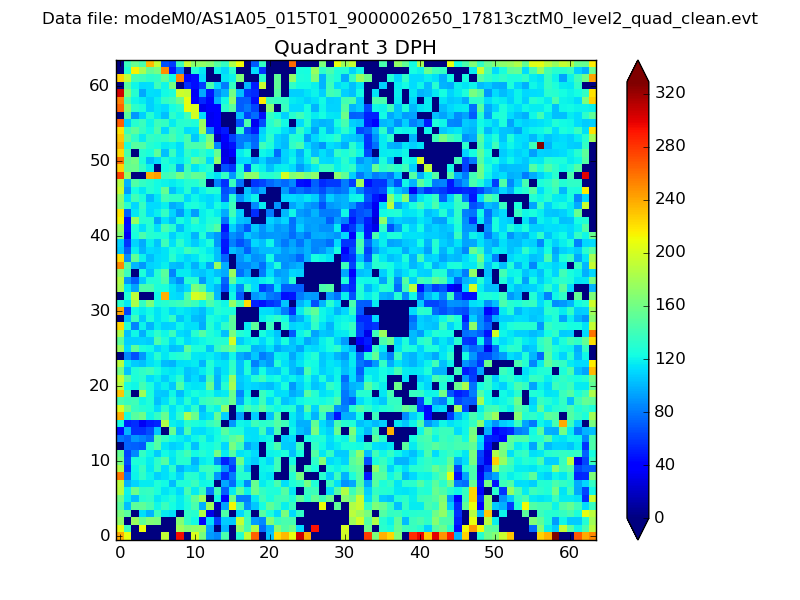 |
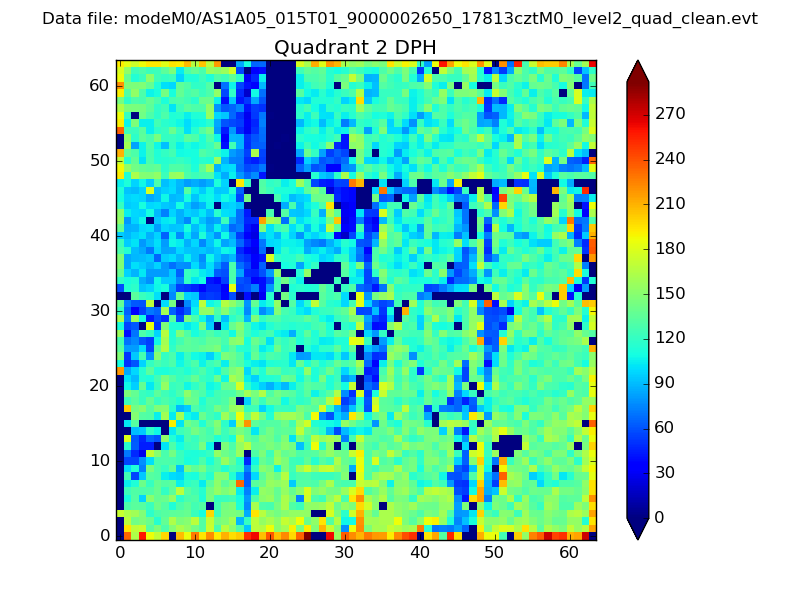 |
Quadrant C |
| Plot type | Count rate plots | Images |
|---|---|---|
| Comparison with Poisson distribution Blue bars denote a histogram of data divided into 1 sec bins. Red curve is a Poisson curve with rate = median count rate of data. |
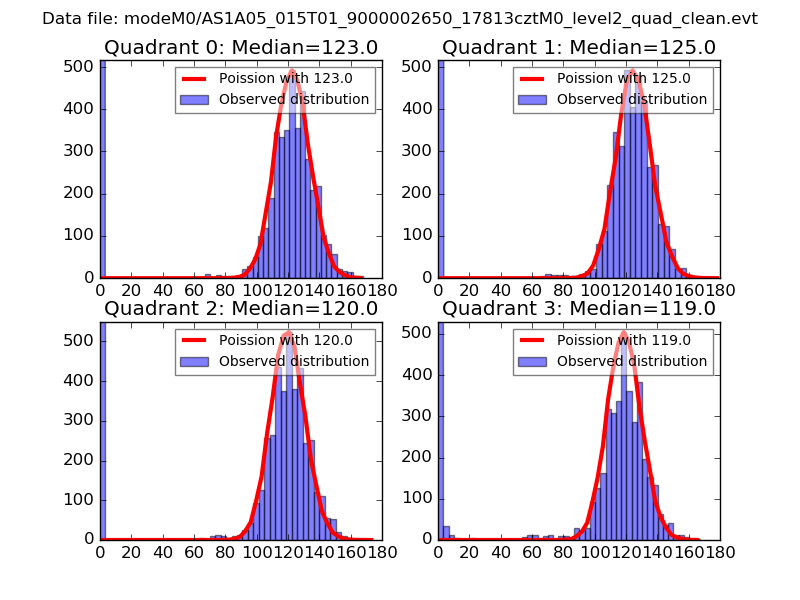 |
 |
| Quadrant-wise count rates Data is divided into 100 sec bins |
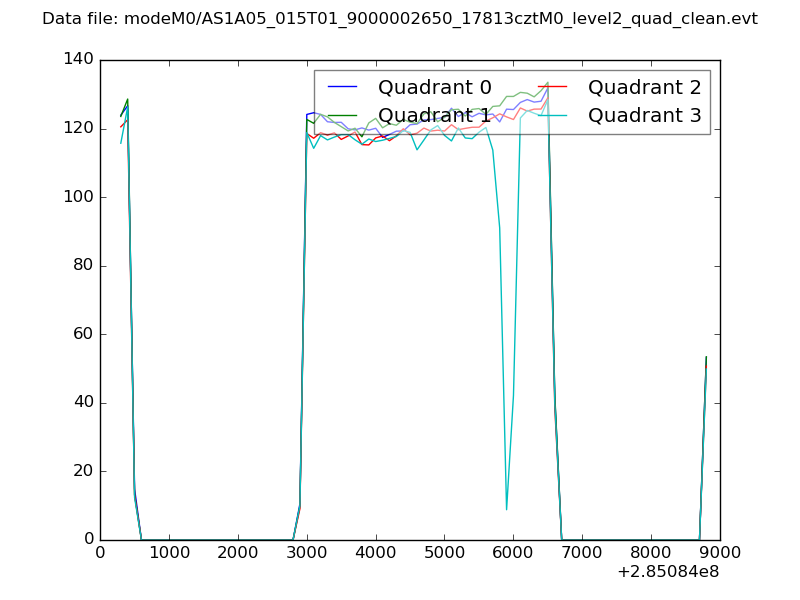 |
|
| Module-wise count rates for Quadrant A Data is divided into 100 sec bins |
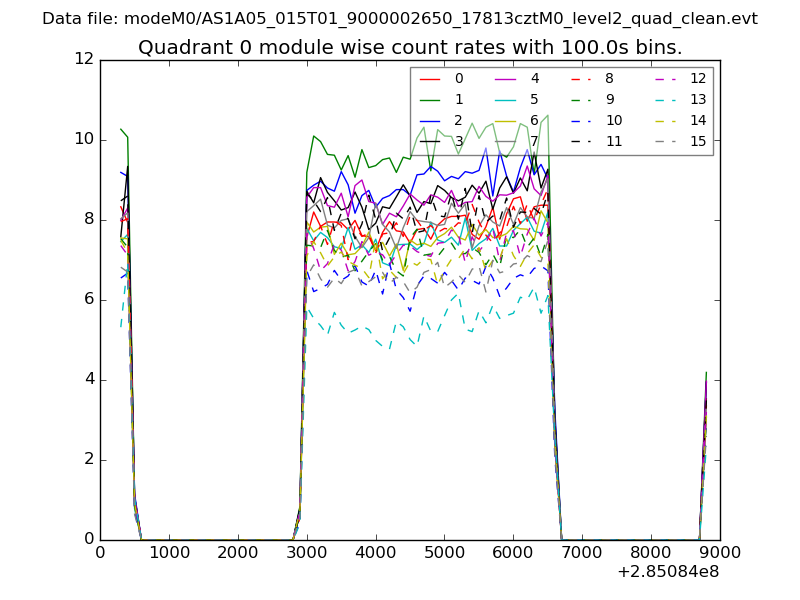 |
 |
| Module-wise count rates for Quadrant B Data is divided into 100 sec bins |
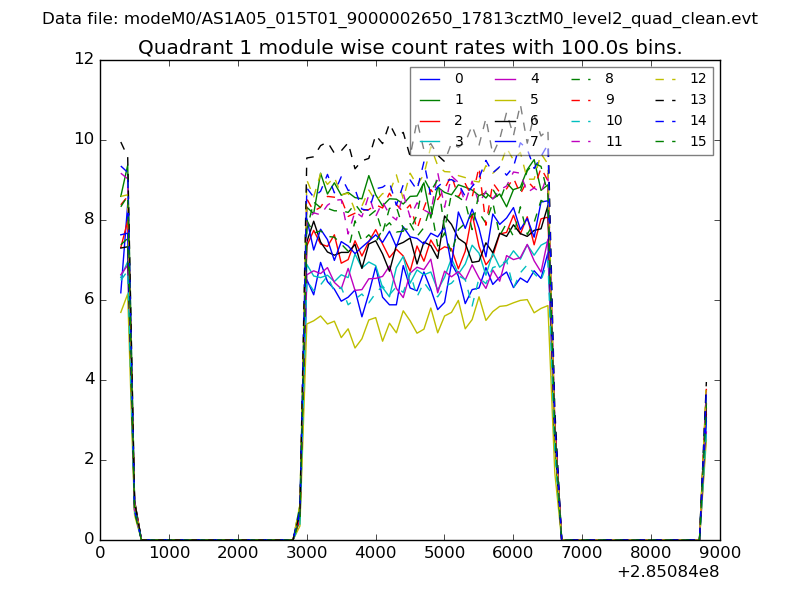 |
 |
| Module-wise count rates for Quadrant C Data is divided into 100 sec bins |
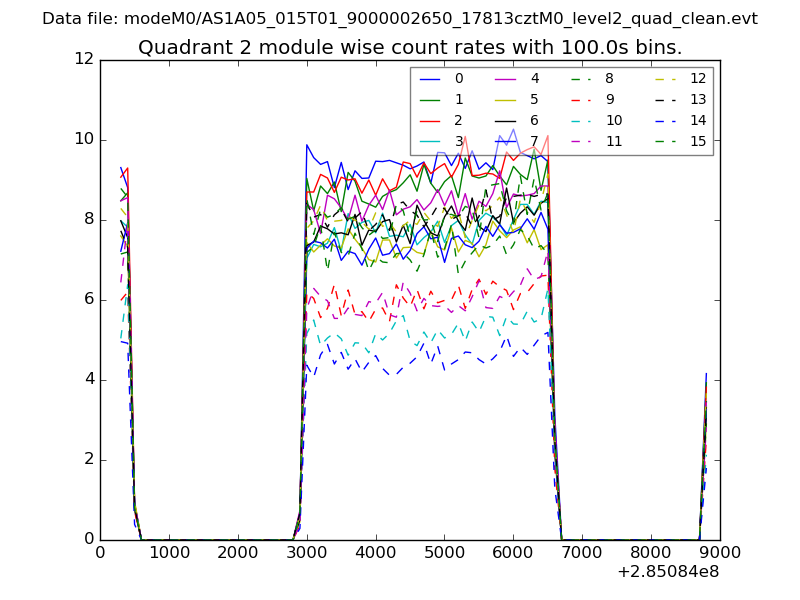 |
 |
| Module-wise count rates for Quadrant D Data is divided into 100 sec bins |
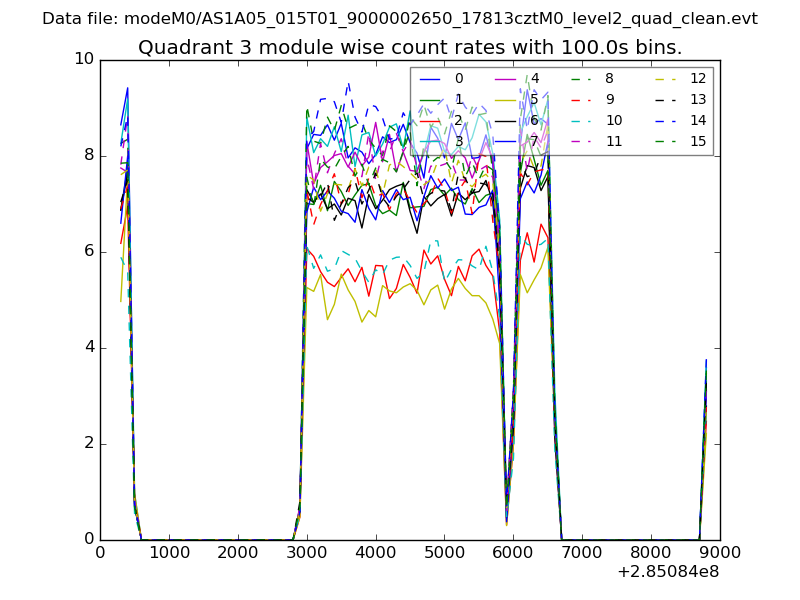 |
 |
| Parameter | Plot |
|---|---|
| CZT HV Monitor | 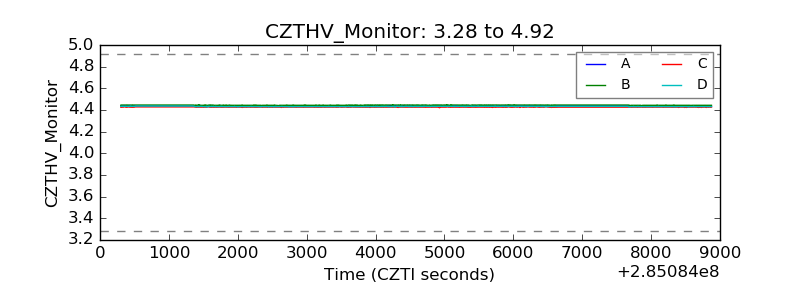 |
| D_VDD | 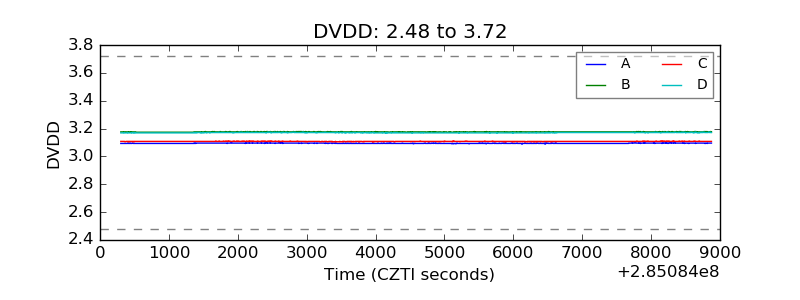 |
| Temperature 1 | 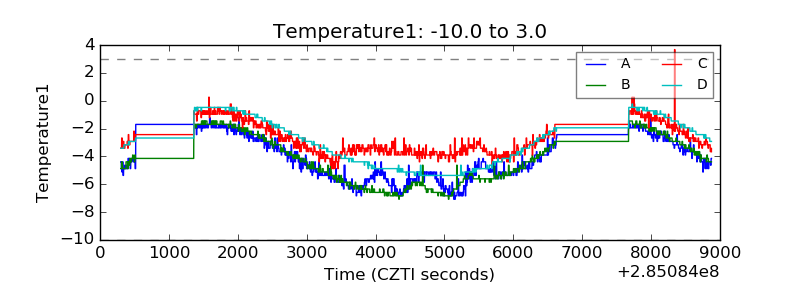 |
| Veto HV Monitor | 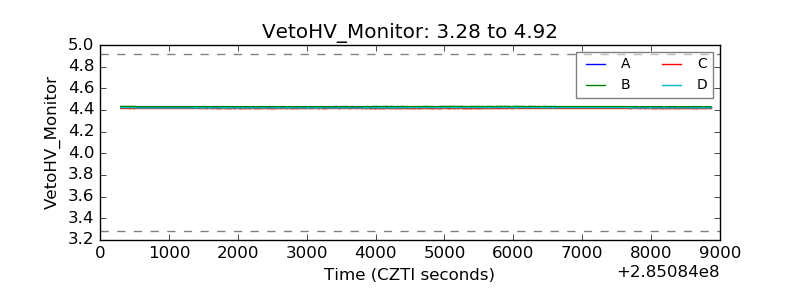 |
| Veto LLD | 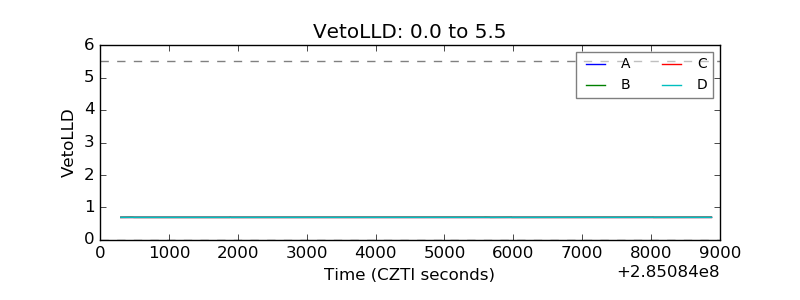 |
| Alpha Counter | 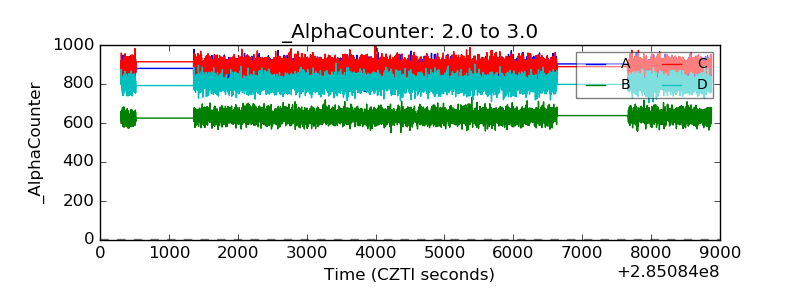 |
| _CPM_Rate | 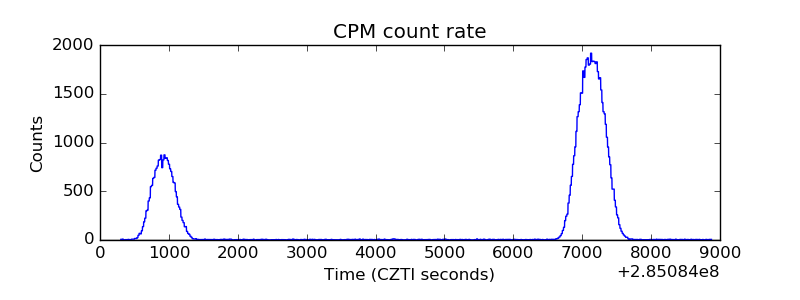 |
| CZT Counter |  |
| +2.5 Volts monitor |  |
| +5 Volts monitor |  |
| _ROLL_ROT | 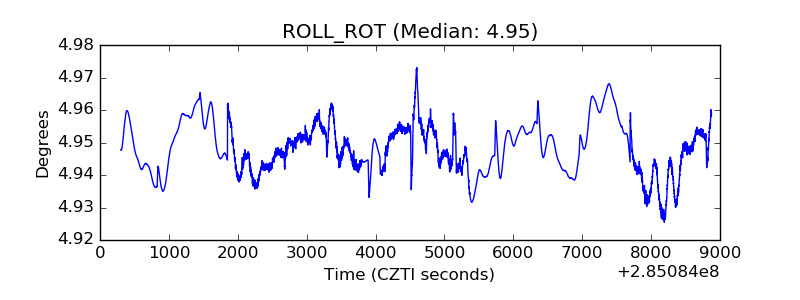 |
| _Roll_DEC | 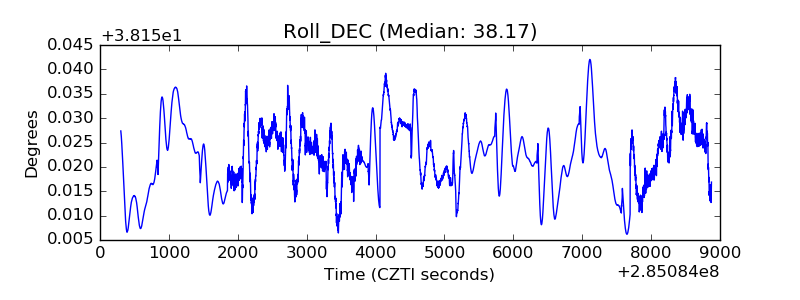 |
| _Roll_RA |  |
| Veto Counter | 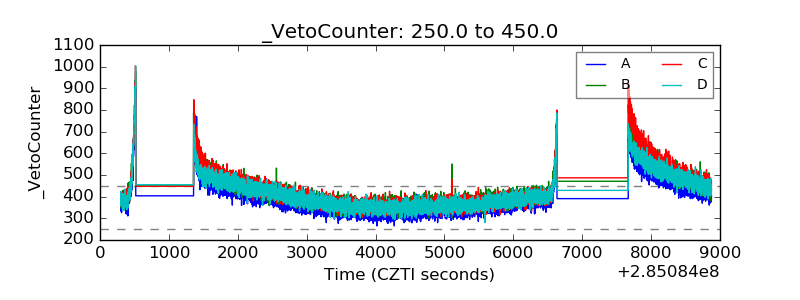 |