| Param | Original file | Final file |
|---|---|---|
| Filename | modeM0/AS1A05_015T01_9000002650_17816cztM0_level2.evt | modeM0/AS1A05_015T01_9000002650_17816cztM0_level2_quad_clean.evt |
| Size (bytes) | 502,911,360 | 101,856,960 |
| Size | 479.6 MB | 97.1 MB |
| Events in quadrant A | 3,357,474 | 657,480 |
| Events in quadrant B | 3,690,189 | 673,334 |
| Events in quadrant C | 3,481,392 | 653,910 |
| Events in quadrant D | 4,249,117 | 635,405 |
| Mode SS | |||
|---|---|---|---|
| Quadrant | BADHDUFLAG | Total packets | Discarded packets |
| A | 0 | 136 | 0 |
| B | 0 | 136 | 0 |
| C | 0 | 136 | 0 |
| D | 0 | 136 | 0 |
| Mode M9 | |||
|---|---|---|---|
| Quadrant | BADHDUFLAG | Total packets | Discarded packets |
| A | 0 | 25 | 0 |
| B | 0 | 25 | 0 |
| C | 0 | 25 | 0 |
| D | 0 | 25 | 0 |
| Mode M0 | |||
|---|---|---|---|
| Quadrant | BADHDUFLAG | Total packets | Discarded packets |
| A | 0 | 14391 | 2 |
| B | 0 | 15381 | 2 |
| C | 0 | 14738 | 2 |
| D | 0 | 17249 | 2 |
| Quadrant | Total seconds | Saturated seconds | Saturation percentage |
|---|---|---|---|
| A | 6670 | 79 | 1.184408% |
| B | 6671 | 142 | 2.128616% |
| C | 6671 | 134 | 2.008694% |
| D | 6670 | 318 | 4.767616% |
Noise dominated data is calculated using 1-second bins in cleaned event files. If a bin has >2000 counts, and if more than 50% of those come from <1% of pixels, then it is considered to be noise-dominated and hence unusable.
| Quadrant | # 1 sec bins | Bins with >0 counts | Bins with >2000 counts | High rate bins dominated by noise | Noise dominated (total time) | Noise dominated (detector-on time) | Marked lightcurve |
|---|---|---|---|---|---|---|---|
| A | 9085 | 6672 | 0 | 0 | 0.00% | 0.00% | 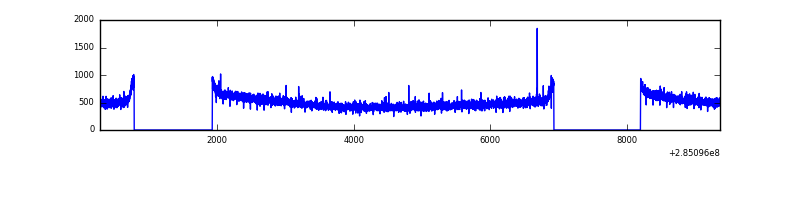 |
| B | 9086 | 6673 | 32 | 32 | 0.35% | 0.48% | 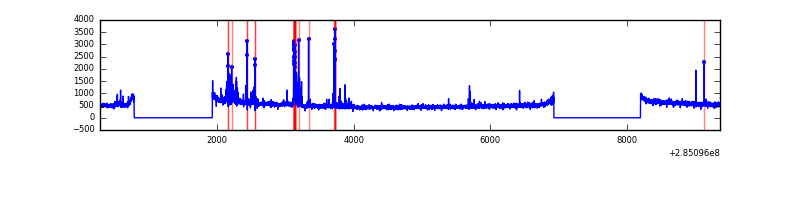 |
| C | 9086 | 6673 | 0 | 0 | 0.00% | 0.00% |  |
| D | 9085 | 6672 | 174 | 174 | 1.92% | 2.61% | 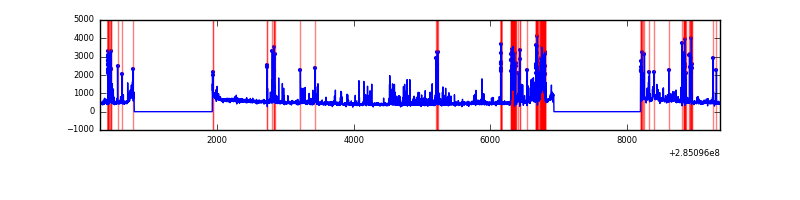 |
Top three noisy pixels from each quadrant. If the there are fewer than three noisy pixels in the level2.evt file, extra rows are filled as -1
| Pixel properties | Quadrant properties | ||||||
|---|---|---|---|---|---|---|---|
| Quadrant | DetID | PixID | Counts | Sigma | Mean | Median | Sigma |
| A | 0 | 226 | 7699 | 38.95 | 872 | 854 | 175.7 |
| A | 12 | 194 | 6537 | 32.34 | 872 | 854 | 175.7 |
| A | 15 | 174 | 6495 | 32.1 | 872 | 854 | 175.7 |
| B | 6 | 36 | 67839 | 407.84 | 876 | 857 | 164.2 |
| B | 0 | 229 | 52565 | 314.84 | 876 | 857 | 164.2 |
| B | 10 | 245 | 38358 | 228.34 | 876 | 857 | 164.2 |
| C | 14 | 238 | 133290 | 674.34 | 849 | 856 | 196.4 |
| C | 3 | 233 | 19010 | 92.44 | 849 | 856 | 196.4 |
| C | 5 | 218 | 13924 | 66.54 | 849 | 856 | 196.4 |
| D | 7 | 238 | 590782 | 2942.62 | 840 | 822 | 200.5 |
| D | 2 | 165 | 253642 | 1261.02 | 840 | 822 | 200.5 |
| D | 10 | 70 | 146343 | 725.83 | 840 | 822 | 200.5 |
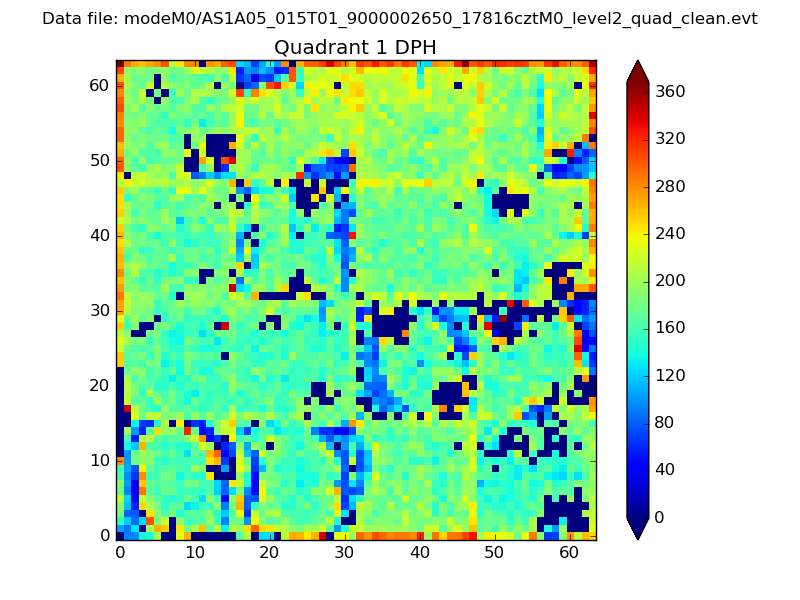
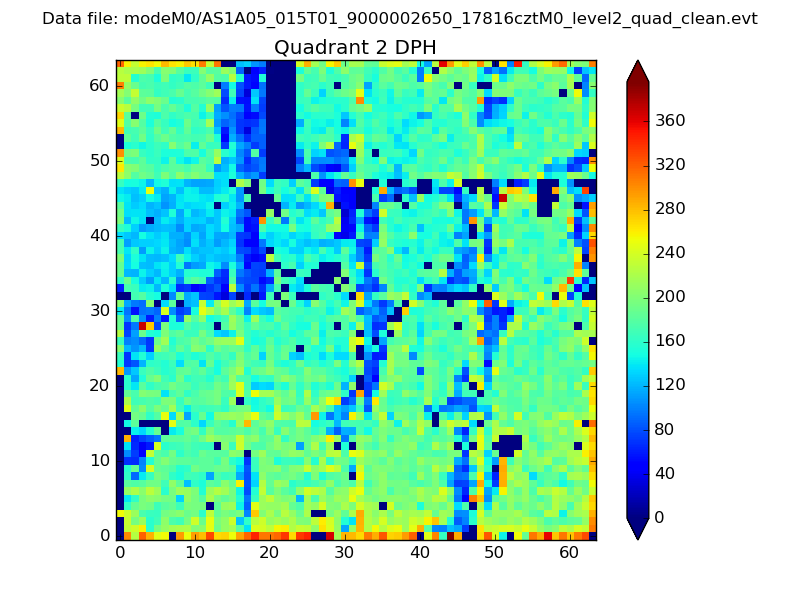
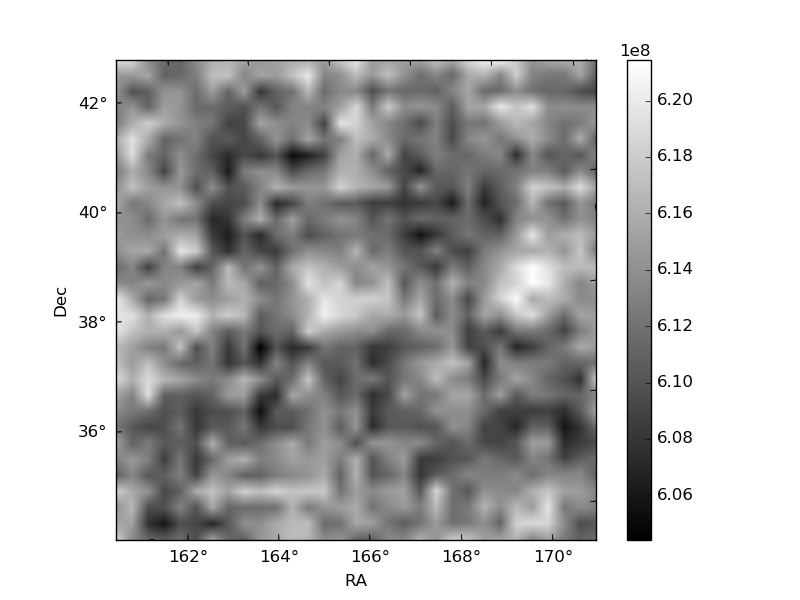
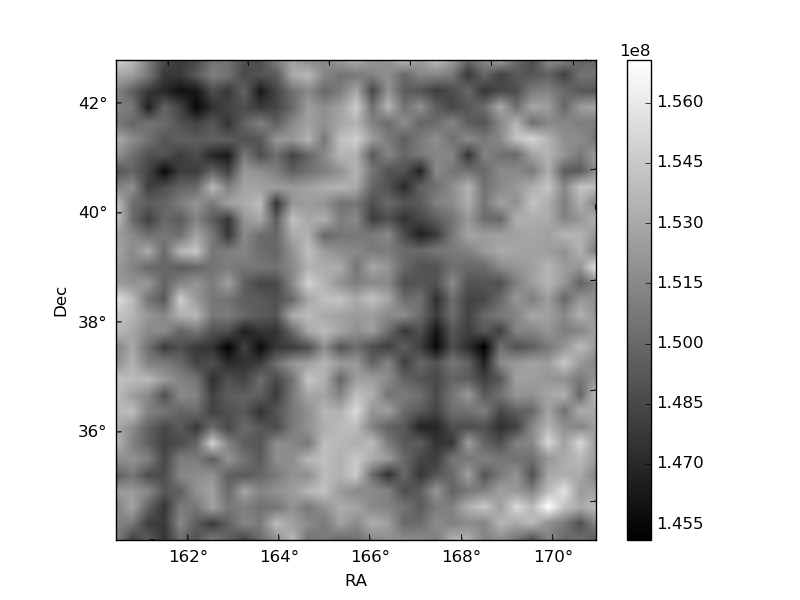
Histogram calculated using DETX and DETY for each event in the final _common_clean file
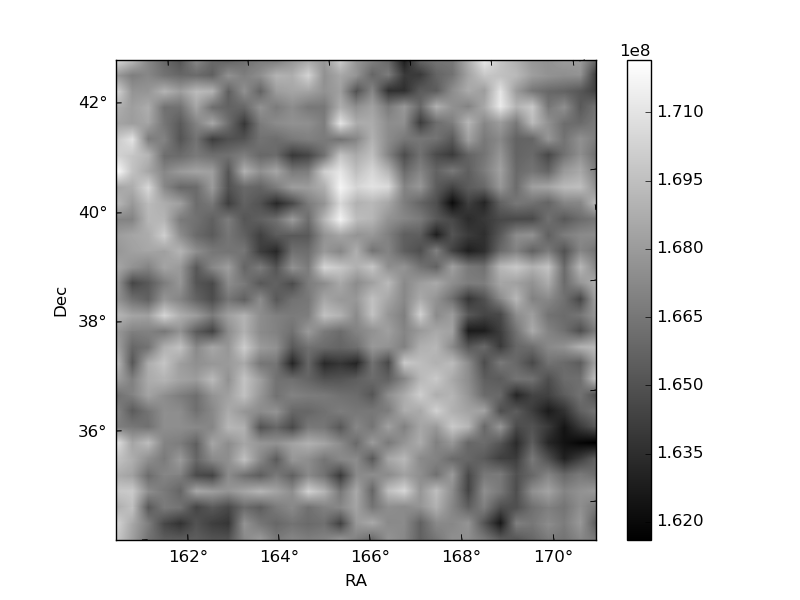
| Quadrant A | 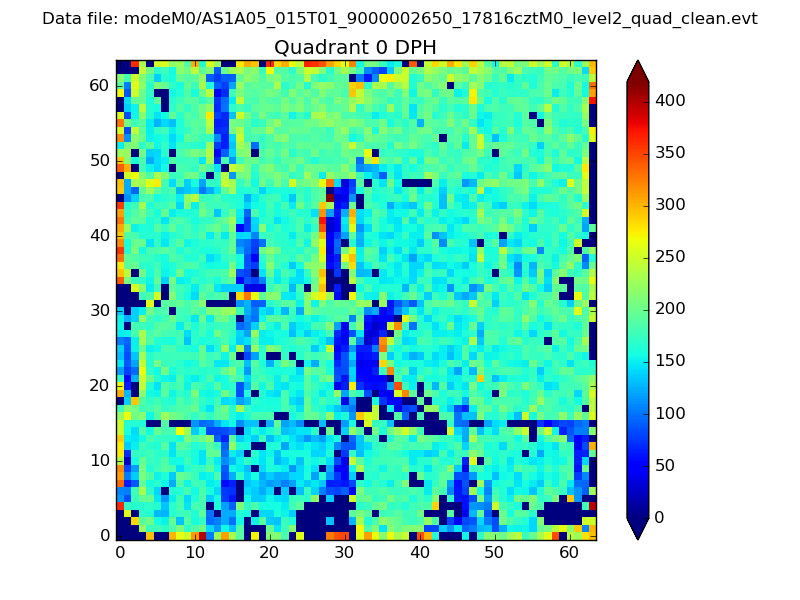 |
 |
Quadrant B |
|---|---|---|---|
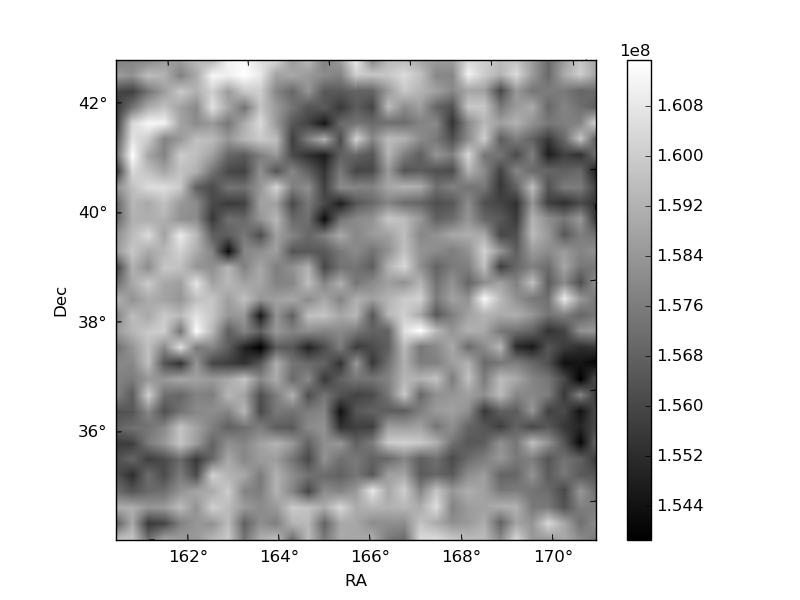
| Quadrant D | 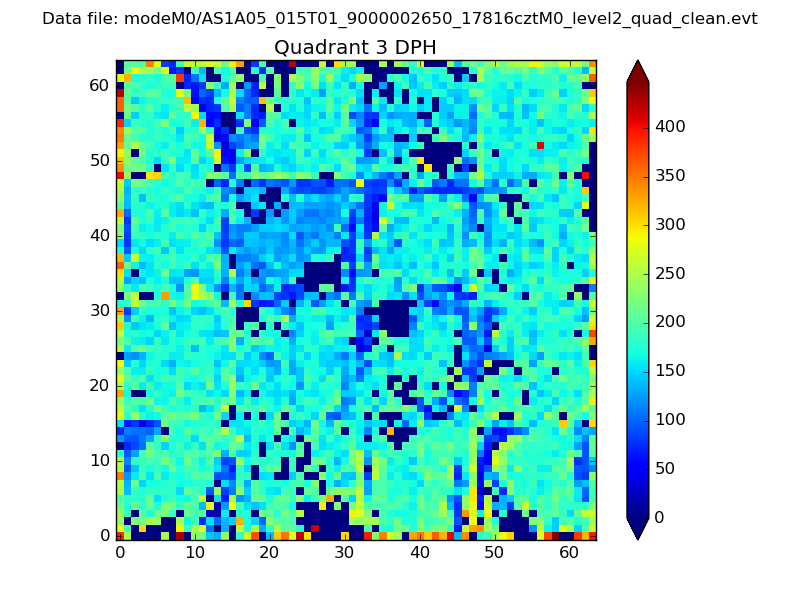 |
 |
Quadrant C |
| Plot type | Count rate plots | Images |
|---|---|---|
| Comparison with Poisson distribution Blue bars denote a histogram of data divided into 1 sec bins. Red curve is a Poisson curve with rate = median count rate of data. |
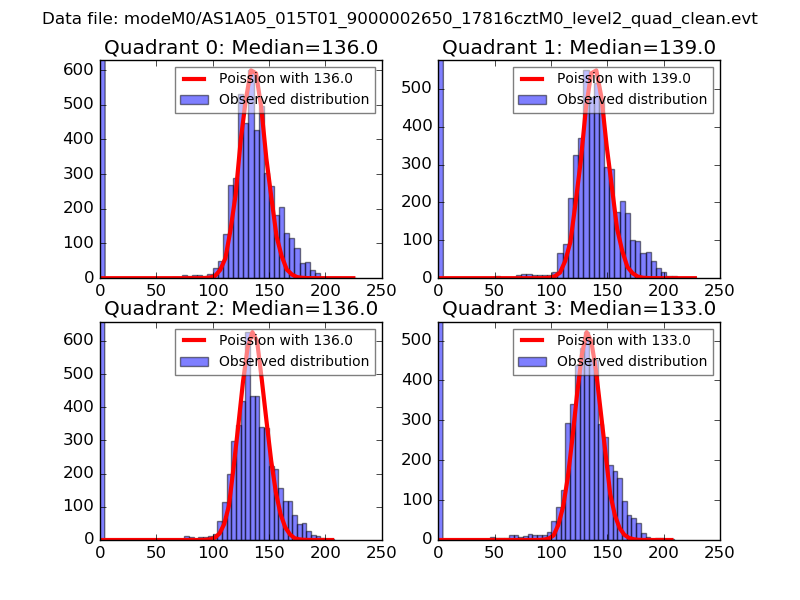 |
 |
| Quadrant-wise count rates Data is divided into 100 sec bins |
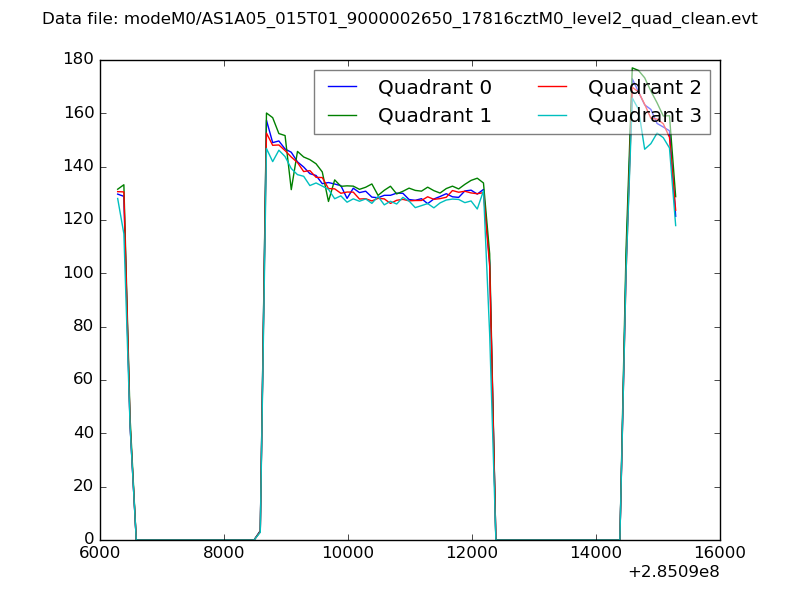 |
|
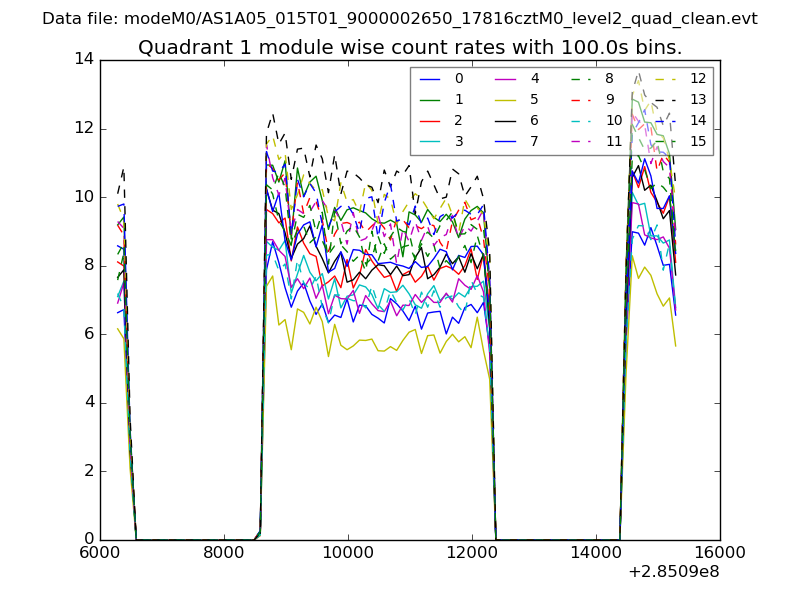
| Module-wise count rates for Quadrant A Data is divided into 100 sec bins |
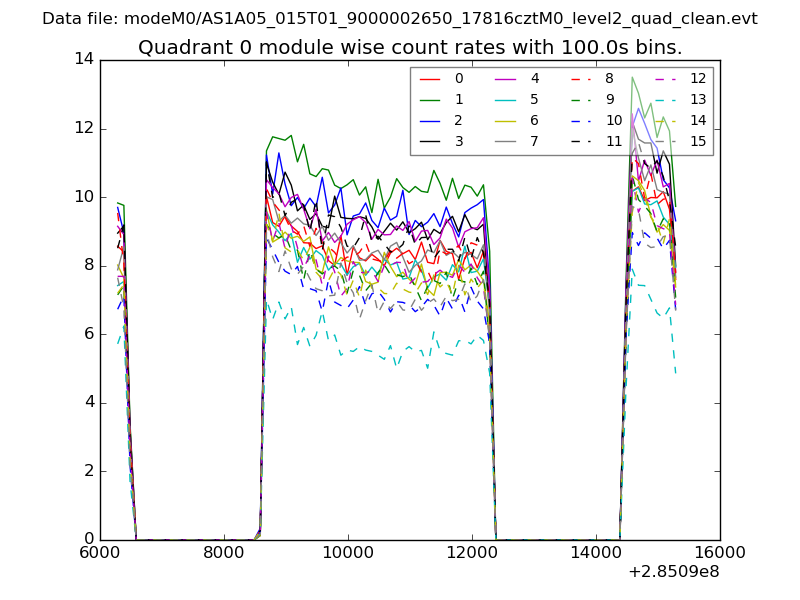 |
 |
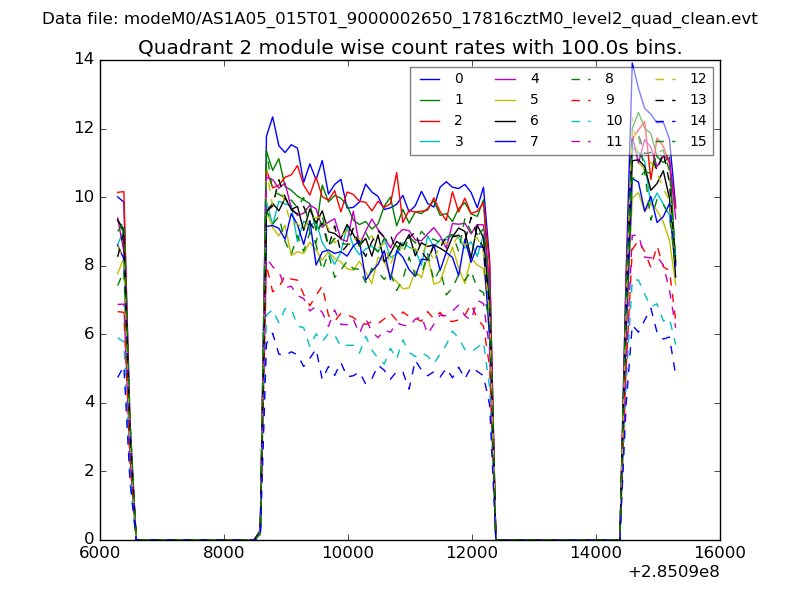
| Module-wise count rates for Quadrant B Data is divided into 100 sec bins |
 |
 |
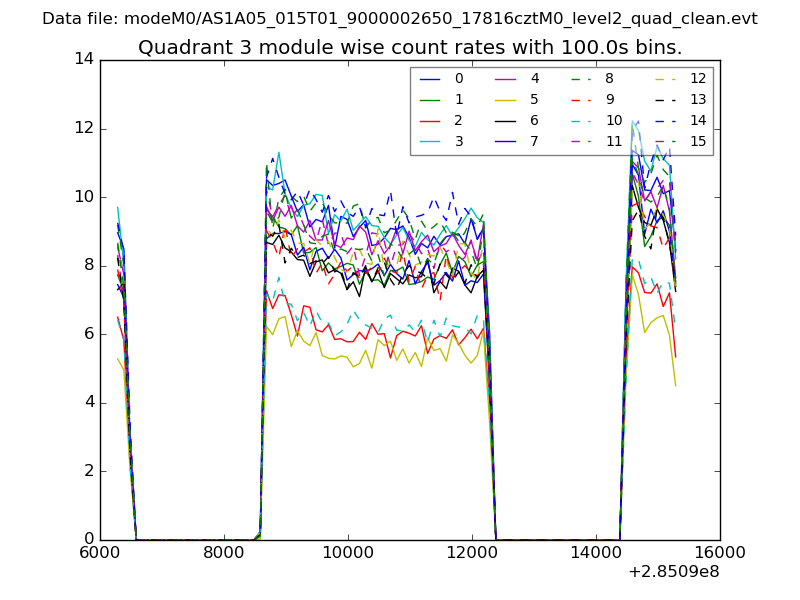
| Module-wise count rates for Quadrant C Data is divided into 100 sec bins |
 |
 |
| Module-wise count rates for Quadrant D Data is divided into 100 sec bins |
 |
 |
| Parameter | Plot |
|---|---|
| CZT HV Monitor | 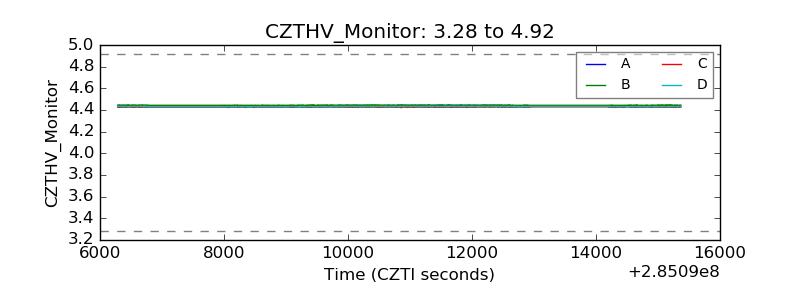 |
| D_VDD | 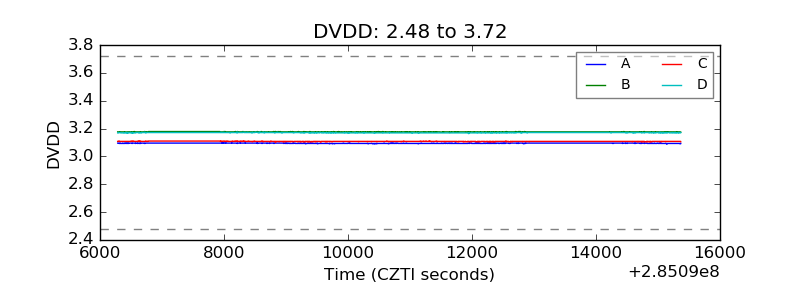 |
| Temperature 1 | 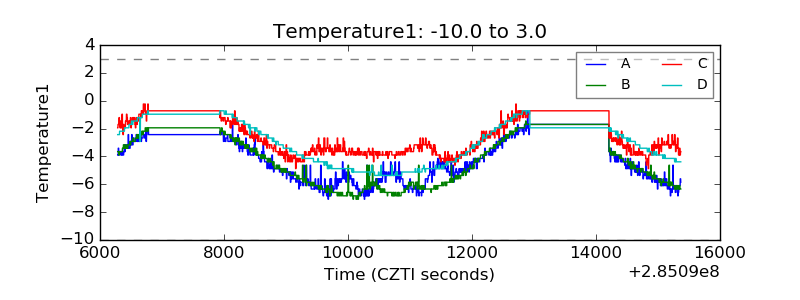 |
| Veto HV Monitor | 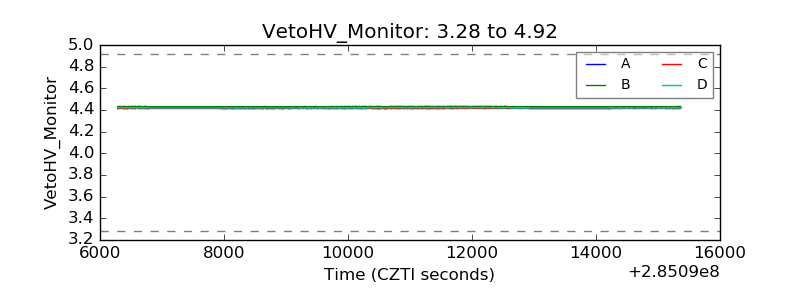 |
| Veto LLD | 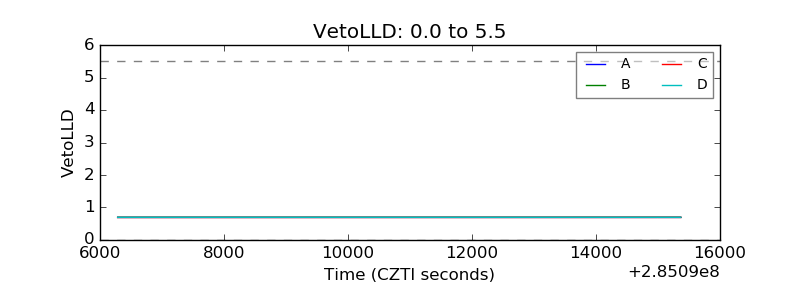 |
| Alpha Counter | 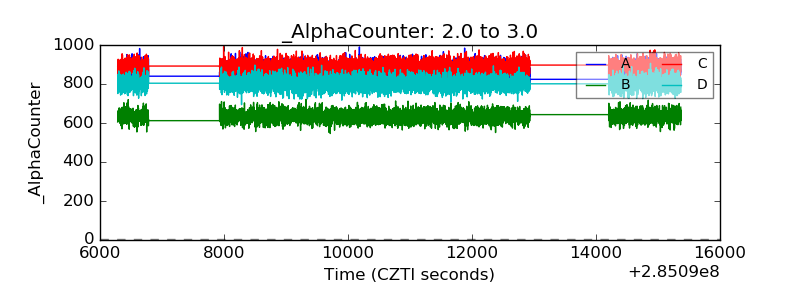 |
| _CPM_Rate | 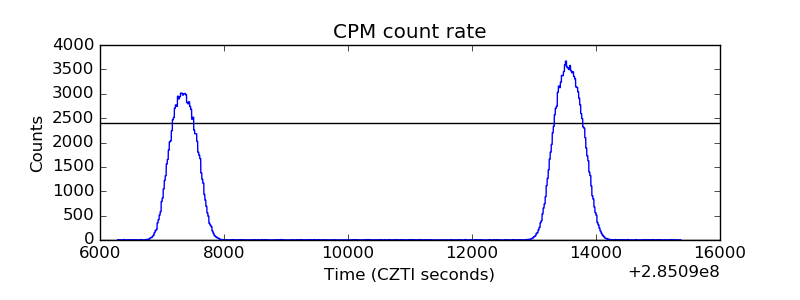 |
| CZT Counter | 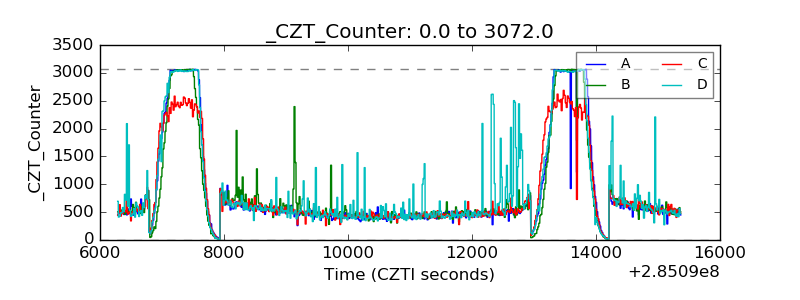 |
| +2.5 Volts monitor |  |
| +5 Volts monitor |  |
| _ROLL_ROT | 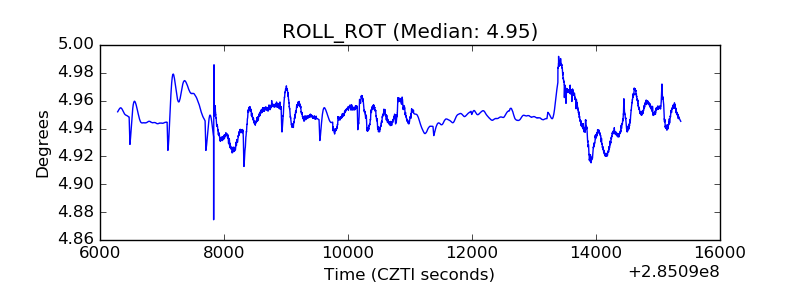 |
| _Roll_DEC | 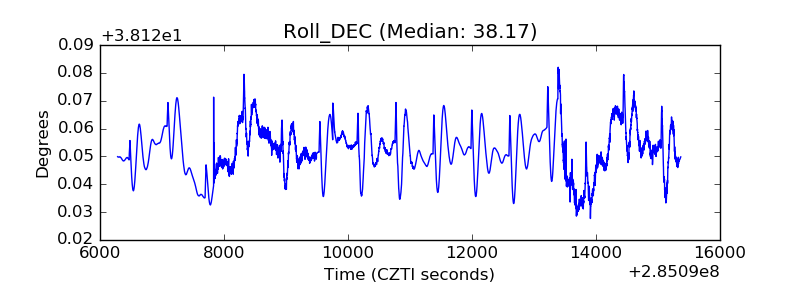 |
| _Roll_RA | 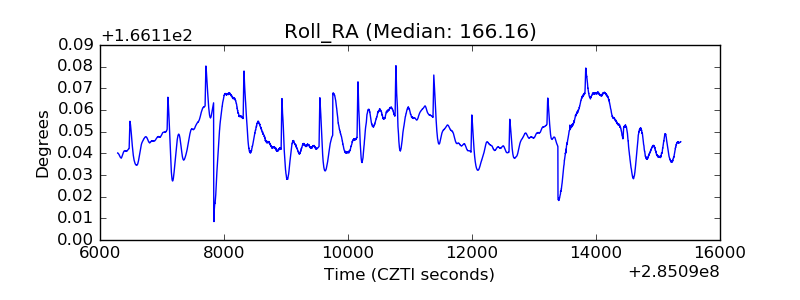 |
| Veto Counter | 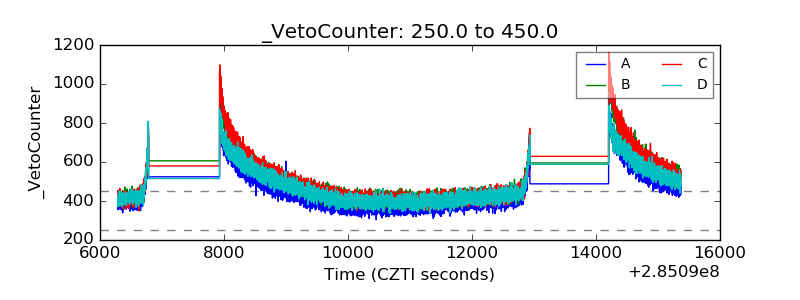 |