| Param | Original file | Final file |
|---|---|---|
| Filename | modeM0/AS1A05_015T01_9000002650_17817cztM0_level2.evt | modeM0/AS1A05_015T01_9000002650_17817cztM0_level2_quad_clean.evt |
| Size (bytes) | 442,897,920 | 109,356,480 |
| Size | 422.4 MB | 104.3 MB |
| Events in quadrant A | 3,096,305 | 721,250 |
| Events in quadrant B | 3,308,704 | 748,419 |
| Events in quadrant C | 3,230,179 | 717,153 |
| Events in quadrant D | 3,360,287 | 696,221 |
| Mode SS | |||
|---|---|---|---|
| Quadrant | BADHDUFLAG | Total packets | Discarded packets |
| A | 0 | 126 | 0 |
| B | 0 | 126 | 0 |
| C | 0 | 126 | 0 |
| D | 0 | 126 | 0 |
| Mode M9 | |||
|---|---|---|---|
| Quadrant | BADHDUFLAG | Total packets | Discarded packets |
| A | 0 | 26 | 0 |
| B | 0 | 26 | 0 |
| C | 0 | 26 | 0 |
| D | 0 | 26 | 0 |
| Mode M0 | |||
|---|---|---|---|
| Quadrant | BADHDUFLAG | Total packets | Discarded packets |
| A | 0 | 13168 | 2 |
| B | 0 | 13824 | 2 |
| C | 0 | 13559 | 2 |
| D | 0 | 14131 | 2 |
| Quadrant | Total seconds | Saturated seconds | Saturation percentage |
|---|---|---|---|
| A | 6148 | 64 | 1.040989% |
| B | 6149 | 87 | 1.414864% |
| C | 6149 | 136 | 2.211742% |
| D | 6149 | 125 | 2.032851% |
Noise dominated data is calculated using 1-second bins in cleaned event files. If a bin has >2000 counts, and if more than 50% of those come from <1% of pixels, then it is considered to be noise-dominated and hence unusable.
| Quadrant | # 1 sec bins | Bins with >0 counts | Bins with >2000 counts | High rate bins dominated by noise | Noise dominated (total time) | Noise dominated (detector-on time) | Marked lightcurve |
|---|---|---|---|---|---|---|---|
| A | 8763 | 6150 | 0 | 0 | 0.00% | 0.00% | 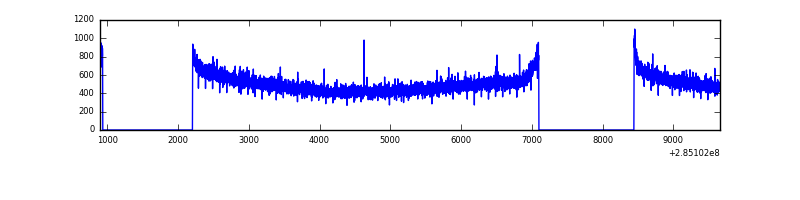 |
| B | 8764 | 6151 | 1 | 1 | 0.01% | 0.02% | 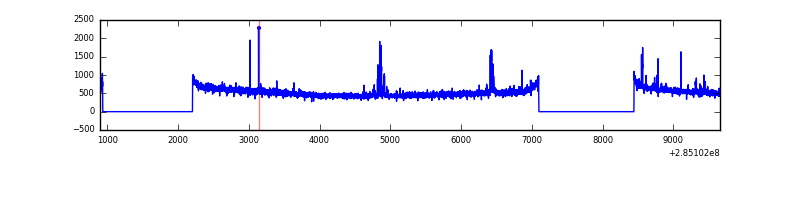 |
| C | 8764 | 6151 | 0 | 0 | 0.00% | 0.00% | 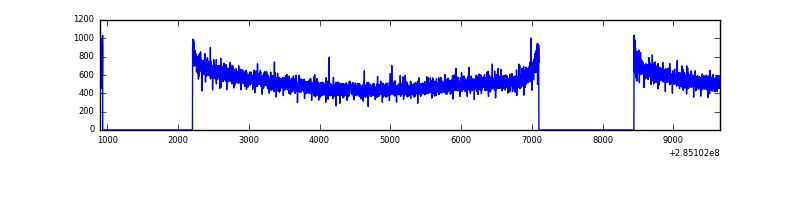 |
| D | 8764 | 6151 | 47 | 47 | 0.54% | 0.76% | 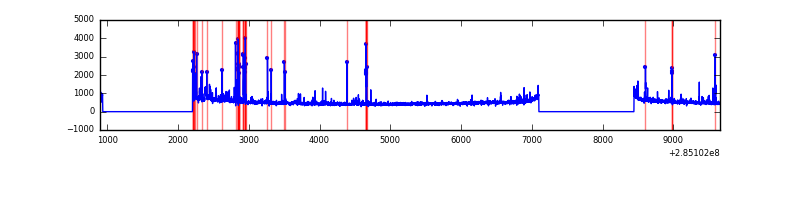 |
Top three noisy pixels from each quadrant. If the there are fewer than three noisy pixels in the level2.evt file, extra rows are filled as -1
| Pixel properties | Quadrant properties | ||||||
|---|---|---|---|---|---|---|---|
| Quadrant | DetID | PixID | Counts | Sigma | Mean | Median | Sigma |
| A | 0 | 226 | 7064 | 39.08 | 804 | 792 | 160.5 |
| A | 12 | 194 | 5889 | 31.76 | 804 | 792 | 160.5 |
| A | 3 | 137 | 5723 | 30.72 | 804 | 792 | 160.5 |
| B | 0 | 230 | 41399 | 268.33 | 816 | 799 | 151.3 |
| B | 15 | 222 | 37010 | 239.32 | 816 | 799 | 151.3 |
| B | 12 | 111 | 17265 | 108.83 | 816 | 799 | 151.3 |
| C | 14 | 238 | 124317 | 679.7 | 788 | 794 | 181.7 |
| C | 5 | 218 | 18804 | 99.1 | 788 | 794 | 181.7 |
| C | 3 | 233 | 8735 | 43.7 | 788 | 794 | 181.7 |
| D | 7 | 238 | 229011 | 1226.49 | 784 | 767 | 186.1 |
| D | 10 | 70 | 70713 | 375.86 | 784 | 767 | 186.1 |
| D | 1 | 52 | 60090 | 318.78 | 784 | 767 | 186.1 |
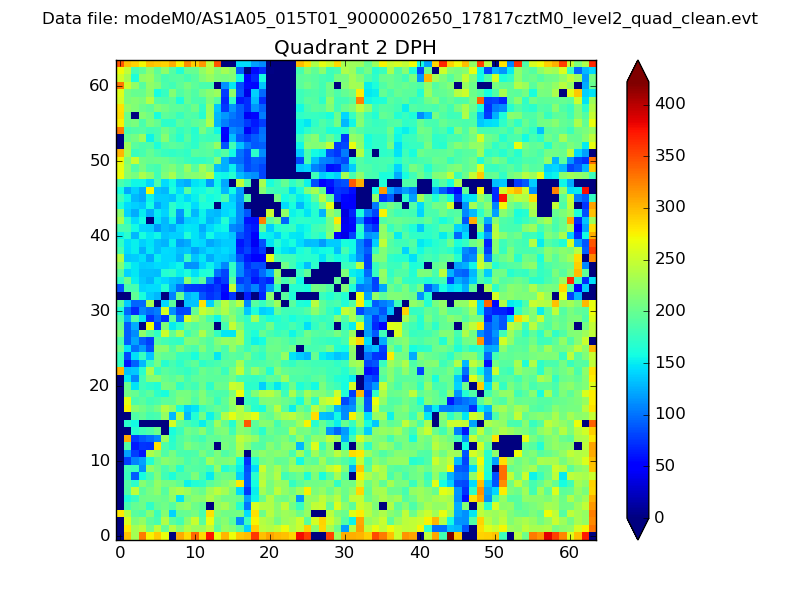
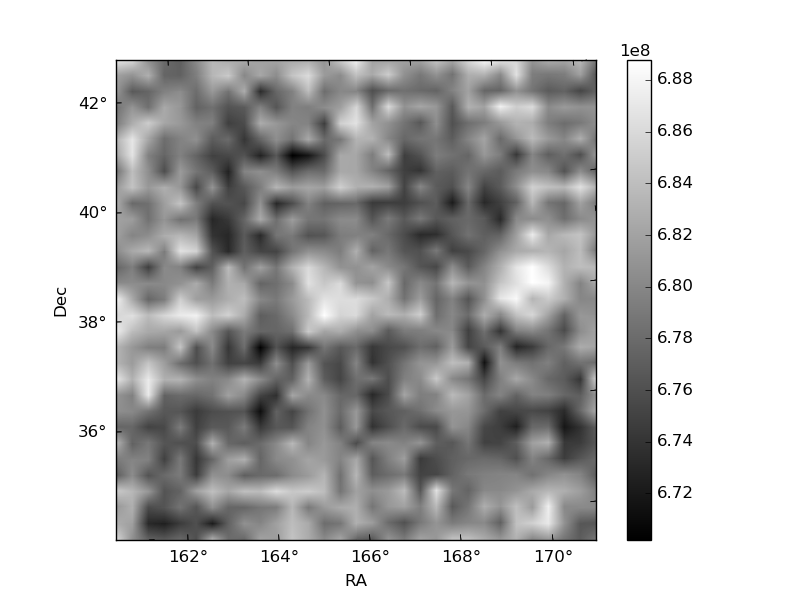
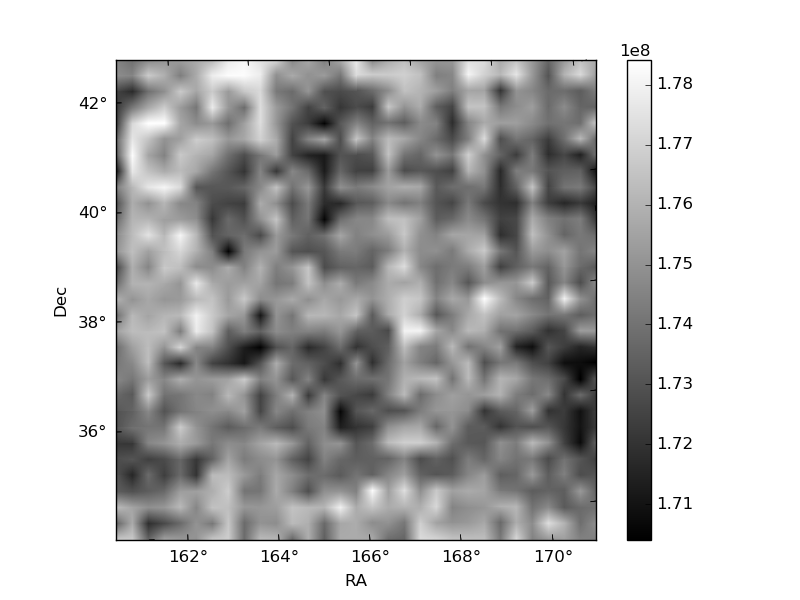
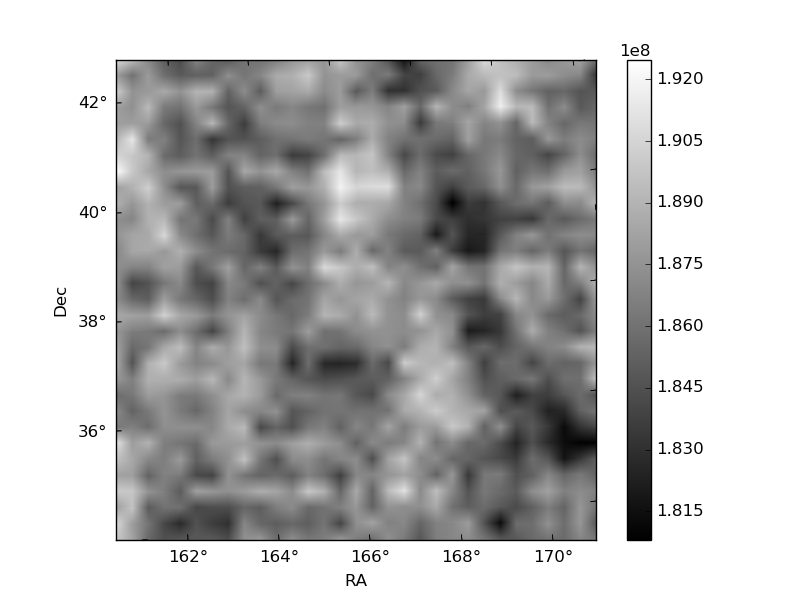
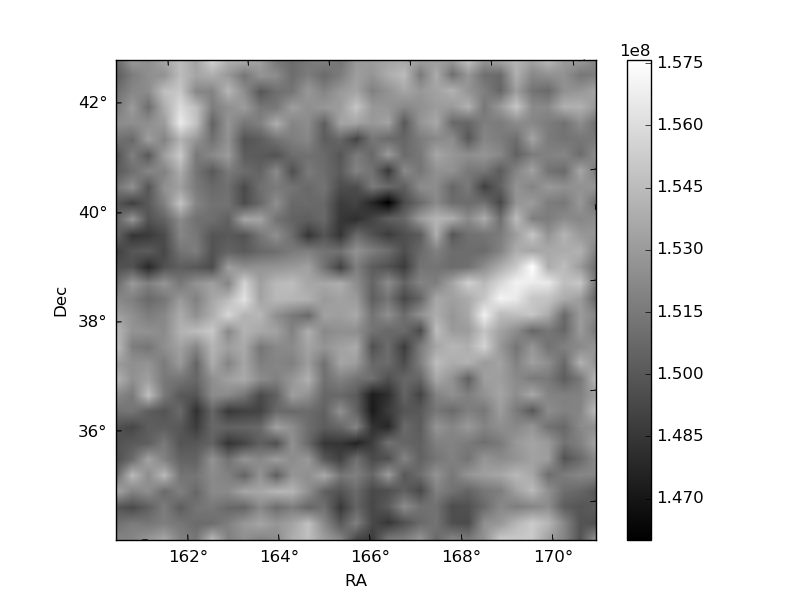
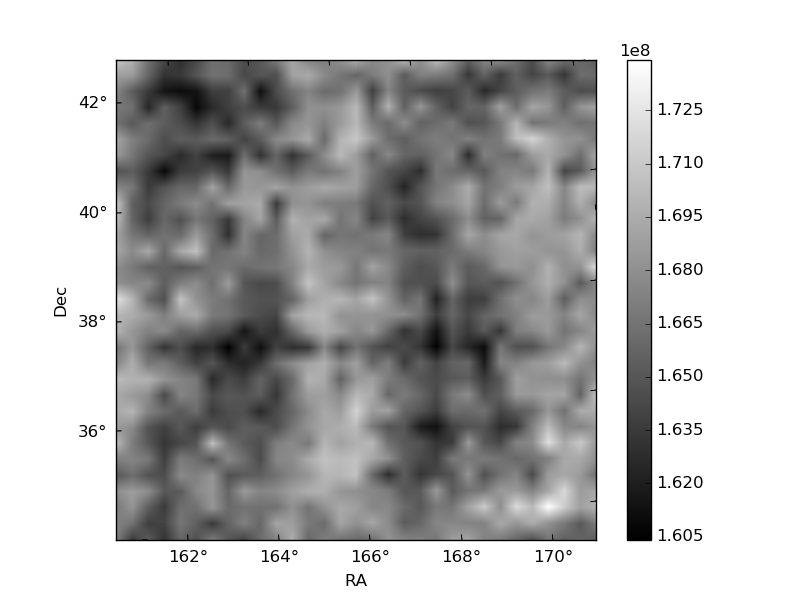
Histogram calculated using DETX and DETY for each event in the final _common_clean file
| Quadrant A | 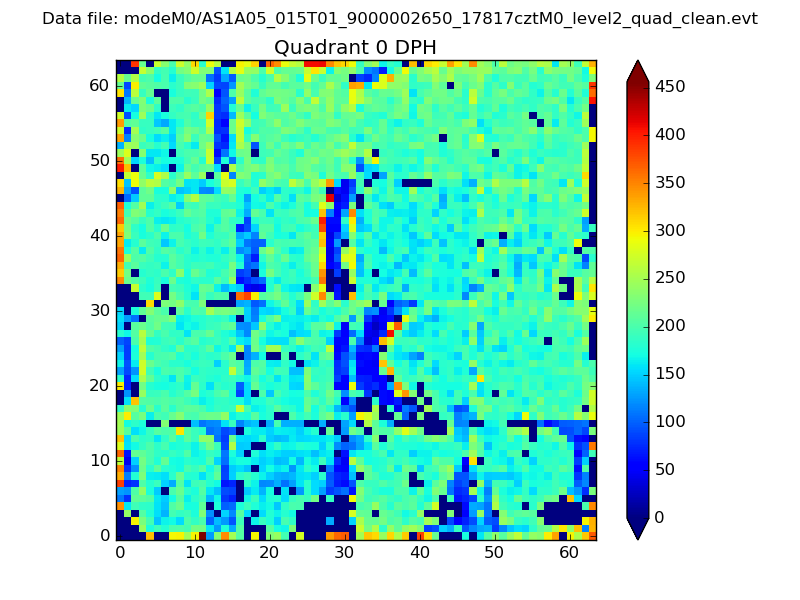 |
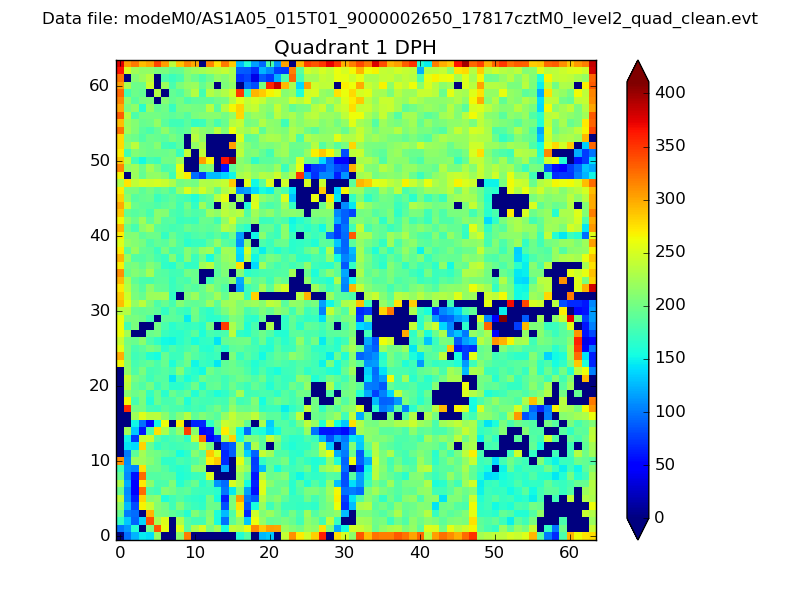 |
Quadrant B |
|---|---|---|---|
| Quadrant D | 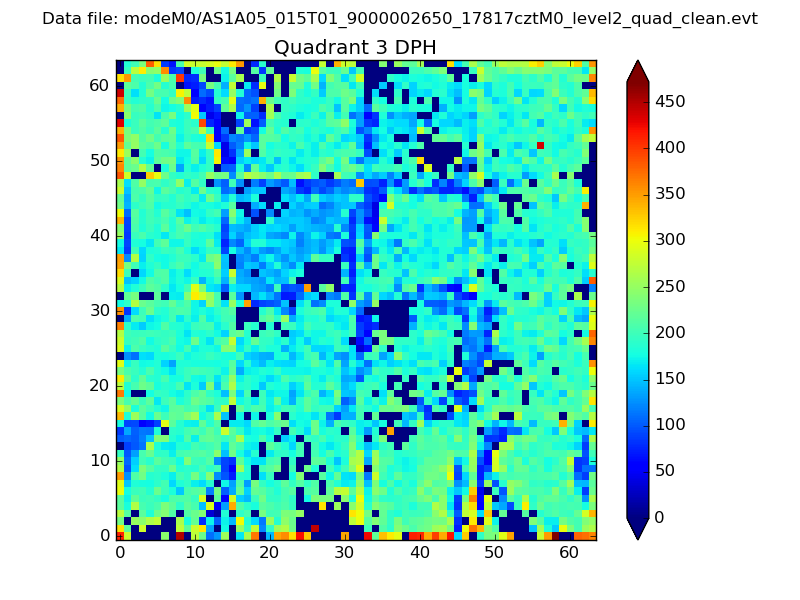 |
 |
Quadrant C |
| Plot type | Count rate plots | Images |
|---|---|---|
| Comparison with Poisson distribution Blue bars denote a histogram of data divided into 1 sec bins. Red curve is a Poisson curve with rate = median count rate of data. |
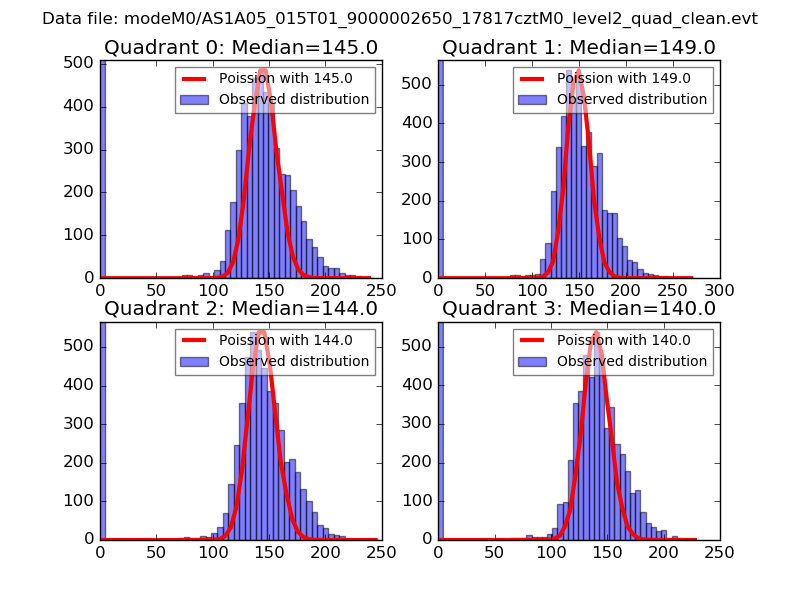 |
 |
| Quadrant-wise count rates Data is divided into 100 sec bins |
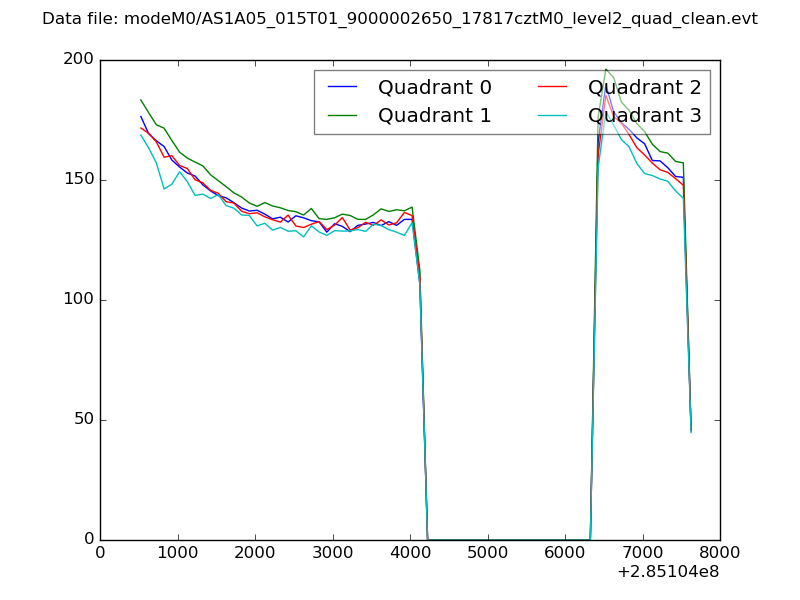 |
|
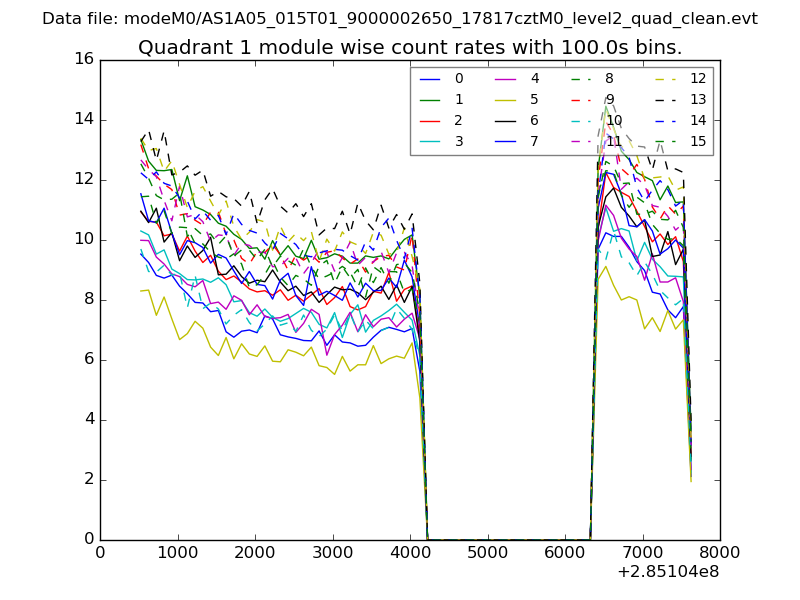
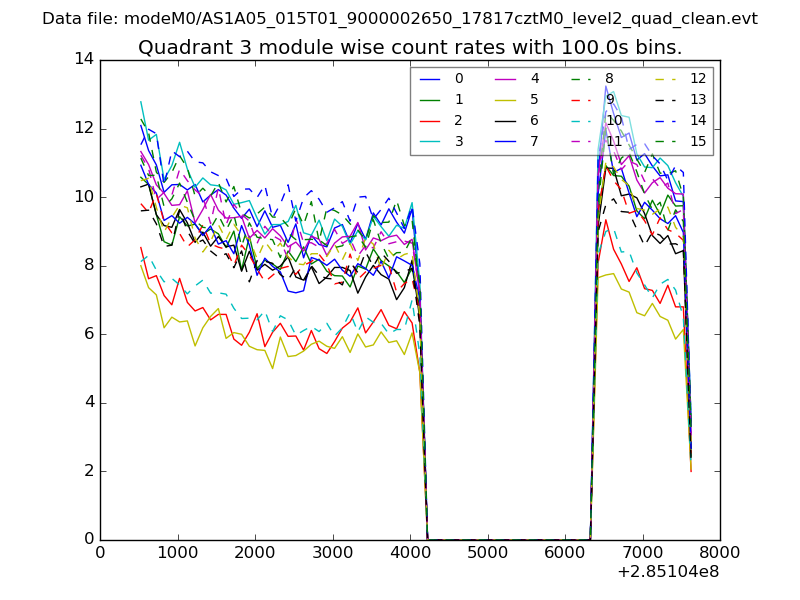
| Module-wise count rates for Quadrant A Data is divided into 100 sec bins |
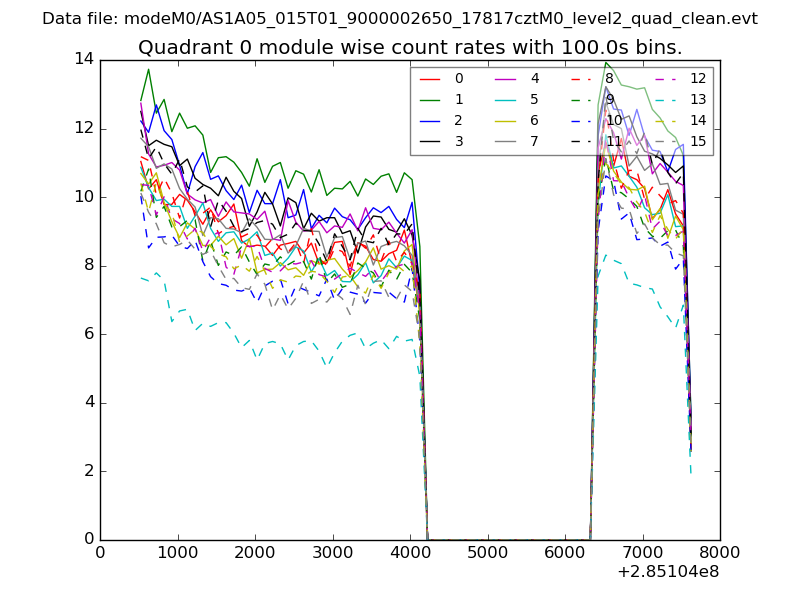 |
 |
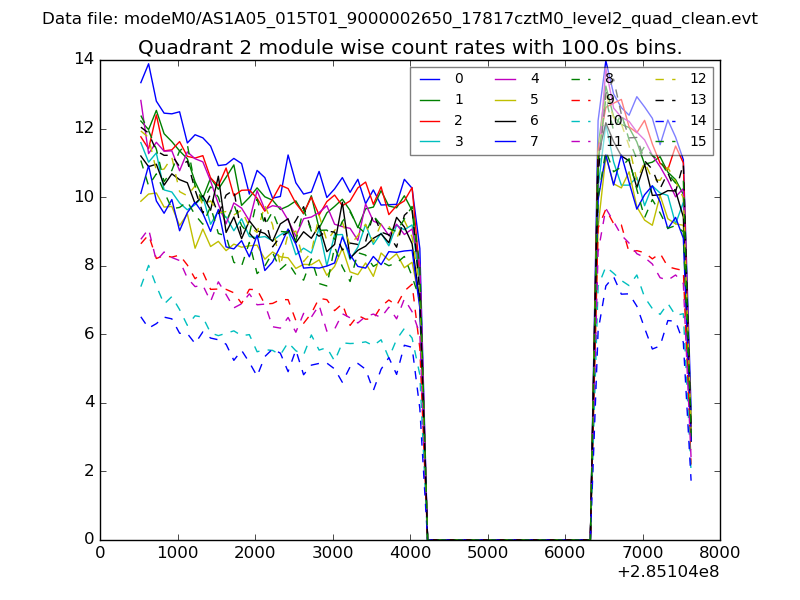
| Module-wise count rates for Quadrant B Data is divided into 100 sec bins |
 |
 |
| Module-wise count rates for Quadrant C Data is divided into 100 sec bins |
 |
 |
| Module-wise count rates for Quadrant D Data is divided into 100 sec bins |
 |
 |
| Parameter | Plot |
|---|---|
| CZT HV Monitor | 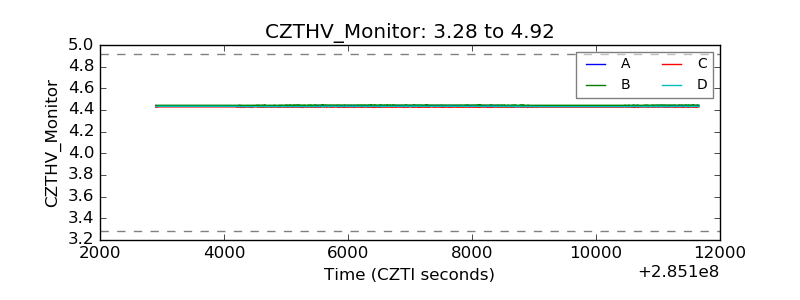 |
| D_VDD | 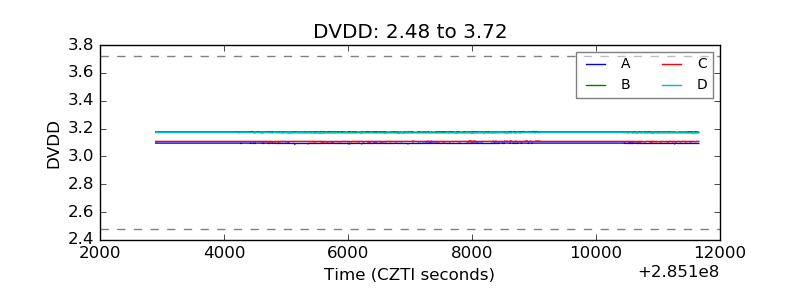 |
| Temperature 1 | 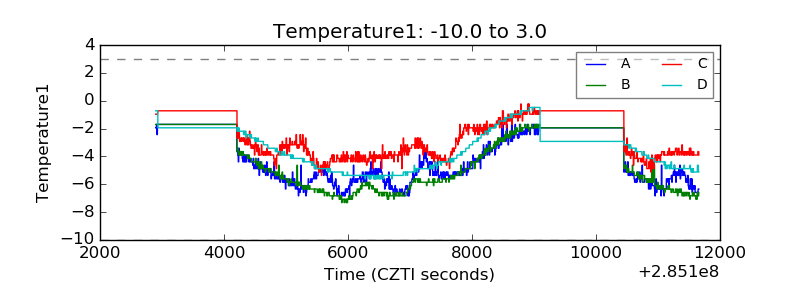 |
| Veto HV Monitor | 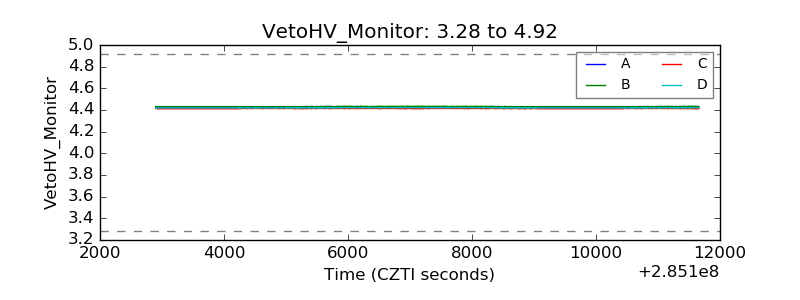 |
| Veto LLD | 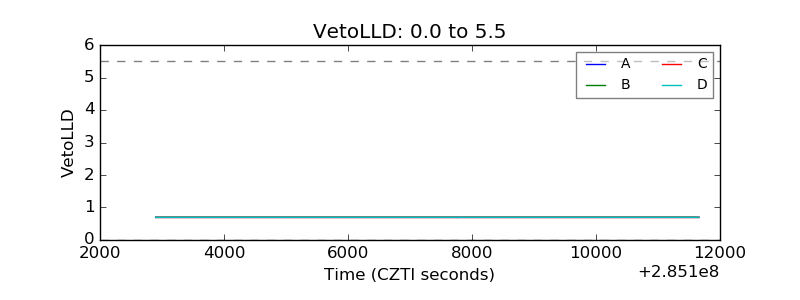 |
| Alpha Counter | 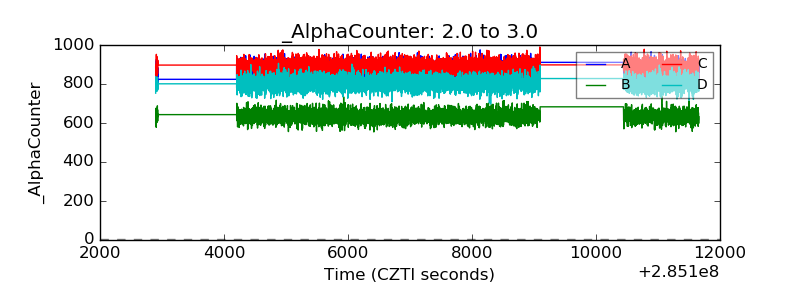 |
| _CPM_Rate | 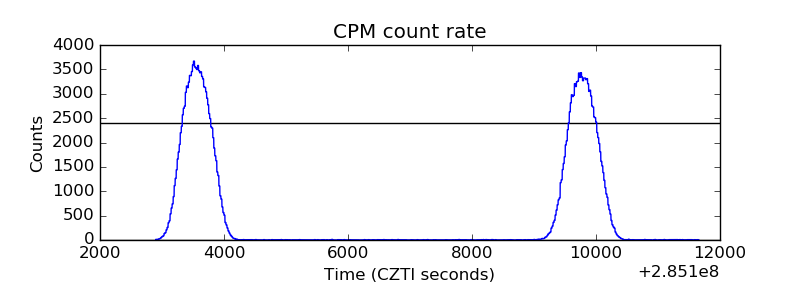 |
| CZT Counter | 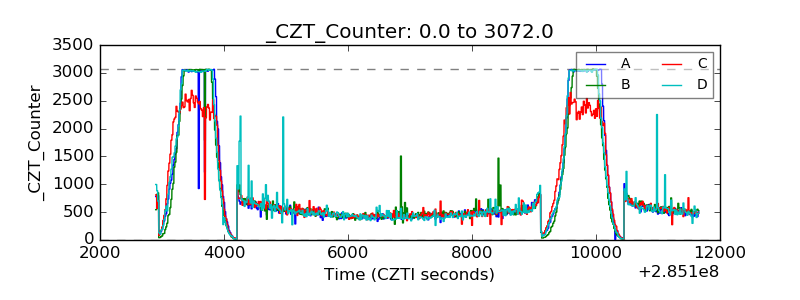 |
| +2.5 Volts monitor |  |
| +5 Volts monitor | 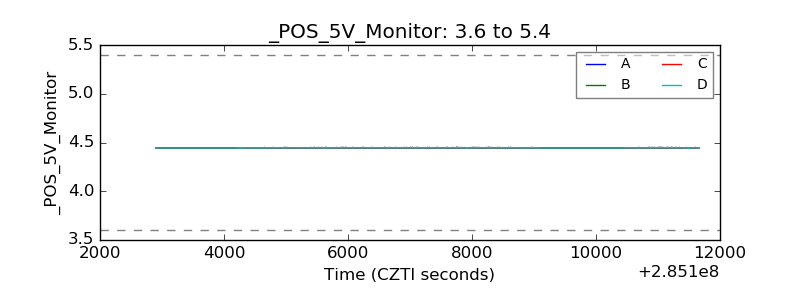 |
| _ROLL_ROT | 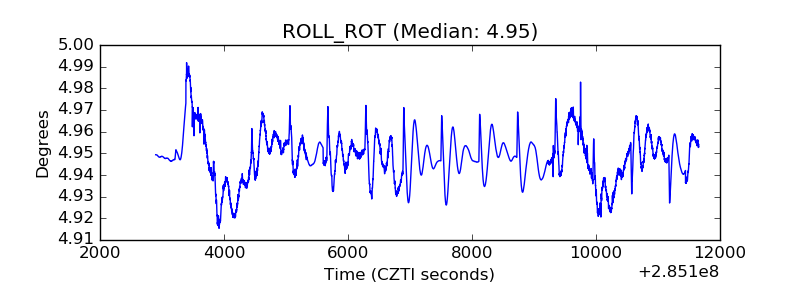 |
| _Roll_DEC | 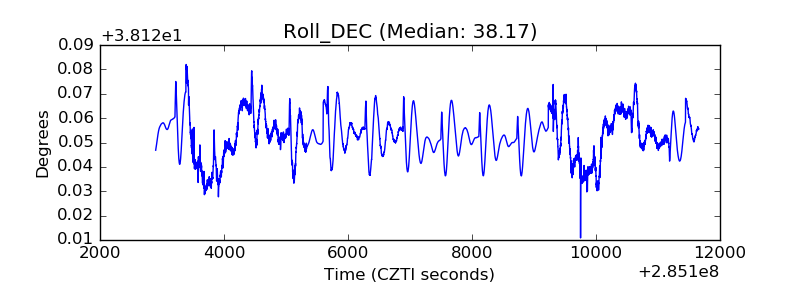 |
| _Roll_RA | 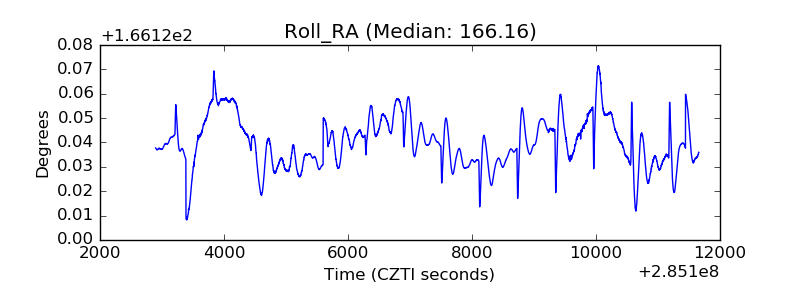 |
| Veto Counter | 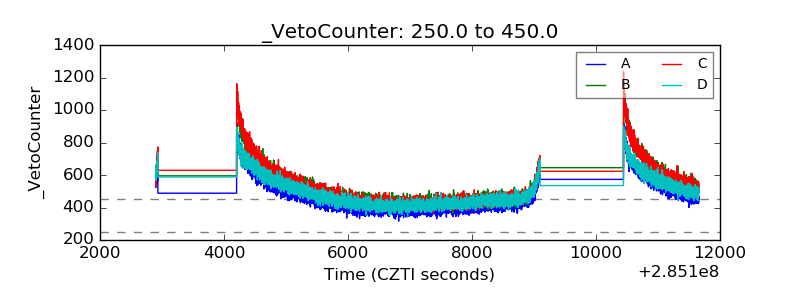 |