| Param | Original file | Final file |
|---|---|---|
| Filename | modeM0/AS1A05_015T01_9000002650_17818cztM0_level2.evt | modeM0/AS1A05_015T01_9000002650_17818cztM0_level2_quad_clean.evt |
| Size (bytes) | 503,786,880 | 111,487,680 |
| Size | 480.4 MB | 106.3 MB |
| Events in quadrant A | 3,479,709 | 730,047 |
| Events in quadrant B | 3,665,951 | 762,109 |
| Events in quadrant C | 3,544,569 | 724,889 |
| Events in quadrant D | 4,101,456 | 681,504 |
| Mode SS | |||
|---|---|---|---|
| Quadrant | BADHDUFLAG | Total packets | Discarded packets |
| A | 0 | 142 | 0 |
| B | 0 | 142 | 0 |
| C | 0 | 142 | 0 |
| D | 0 | 142 | 0 |
| Mode M9 | |||
|---|---|---|---|
| Quadrant | BADHDUFLAG | Total packets | Discarded packets |
| A | 0 | 26 | 0 |
| B | 0 | 26 | 0 |
| C | 0 | 26 | 0 |
| D | 0 | 26 | 0 |
| Mode M0 | |||
|---|---|---|---|
| Quadrant | BADHDUFLAG | Total packets | Discarded packets |
| A | 0 | 14646 | 2 |
| B | 0 | 15171 | 2 |
| C | 0 | 14806 | 2 |
| D | 0 | 16795 | 2 |
| Quadrant | Total seconds | Saturated seconds | Saturation percentage |
|---|---|---|---|
| A | 6849 | 52 | 0.759235% |
| B | 6850 | 82 | 1.197080% |
| C | 6850 | 127 | 1.854015% |
| D | 6850 | 285 | 4.160584% |
Noise dominated data is calculated using 1-second bins in cleaned event files. If a bin has >2000 counts, and if more than 50% of those come from <1% of pixels, then it is considered to be noise-dominated and hence unusable.
| Quadrant | # 1 sec bins | Bins with >0 counts | Bins with >2000 counts | High rate bins dominated by noise | Noise dominated (total time) | Noise dominated (detector-on time) | Marked lightcurve |
|---|---|---|---|---|---|---|---|
| A | 9584 | 6851 | 1 | 1 | 0.01% | 0.01% | 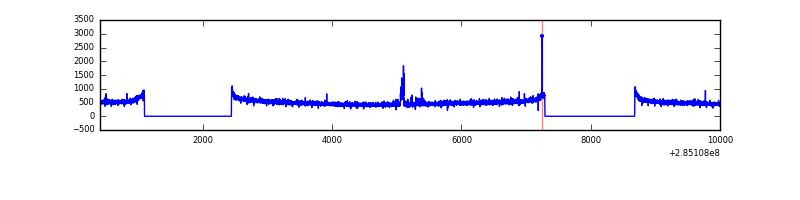 |
| B | 9585 | 6852 | 3 | 3 | 0.03% | 0.04% | 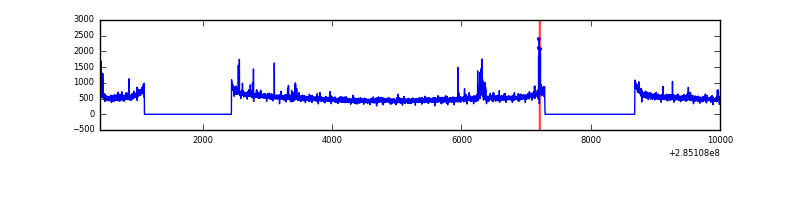 |
| C | 9585 | 6852 | 0 | 0 | 0.00% | 0.00% | 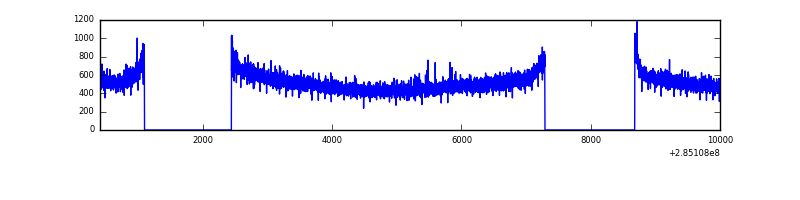 |
| D | 9585 | 6852 | 236 | 236 | 2.46% | 3.44% | 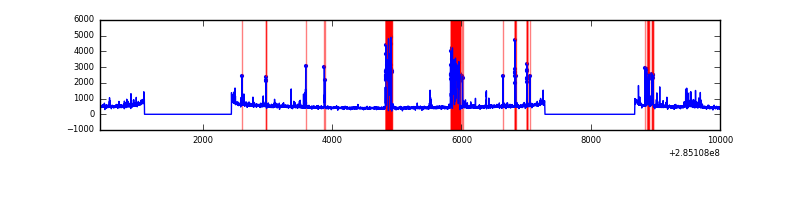 |
Top three noisy pixels from each quadrant. If the there are fewer than three noisy pixels in the level2.evt file, extra rows are filled as -1
| Pixel properties | Quadrant properties | ||||||
|---|---|---|---|---|---|---|---|
| Quadrant | DetID | PixID | Counts | Sigma | Mean | Median | Sigma |
| A | 15 | 174 | 54146 | 298.02 | 891 | 877 | 178.7 |
| A | 0 | 226 | 7834 | 38.92 | 891 | 877 | 178.7 |
| A | 12 | 194 | 6401 | 30.91 | 891 | 877 | 178.7 |
| B | 0 | 230 | 81861 | 482.01 | 902 | 883 | 168.0 |
| B | 12 | 111 | 19193 | 108.99 | 902 | 883 | 168.0 |
| B | 11 | 111 | 16904 | 95.36 | 902 | 883 | 168.0 |
| C | 14 | 238 | 136551 | 678.07 | 868 | 877 | 200.1 |
| C | 5 | 218 | 15141 | 71.29 | 868 | 877 | 200.1 |
| C | 3 | 233 | 6950 | 30.35 | 868 | 877 | 200.1 |
| D | 2 | 33 | 552528 | 2738.03 | 847 | 826 | 201.5 |
| D | 10 | 70 | 250765 | 1240.41 | 847 | 826 | 201.5 |
| D | 1 | 52 | 40045 | 194.64 | 847 | 826 | 201.5 |
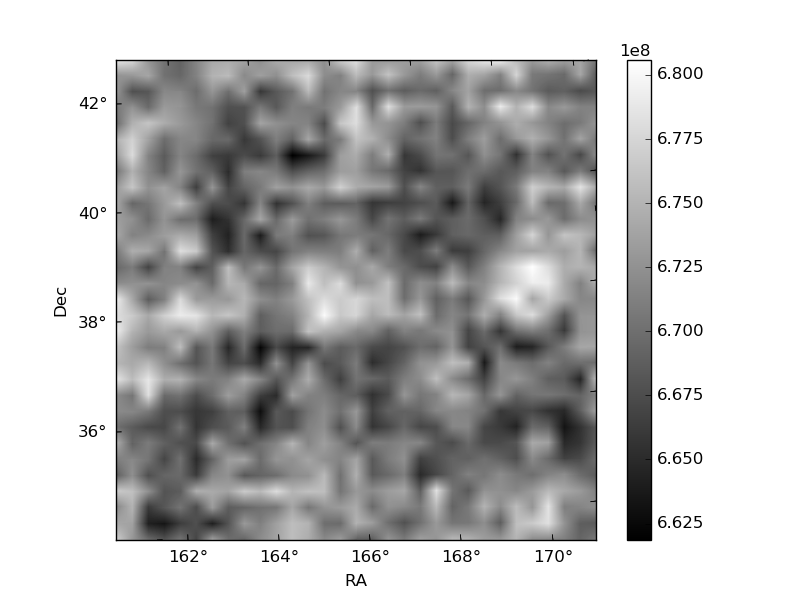
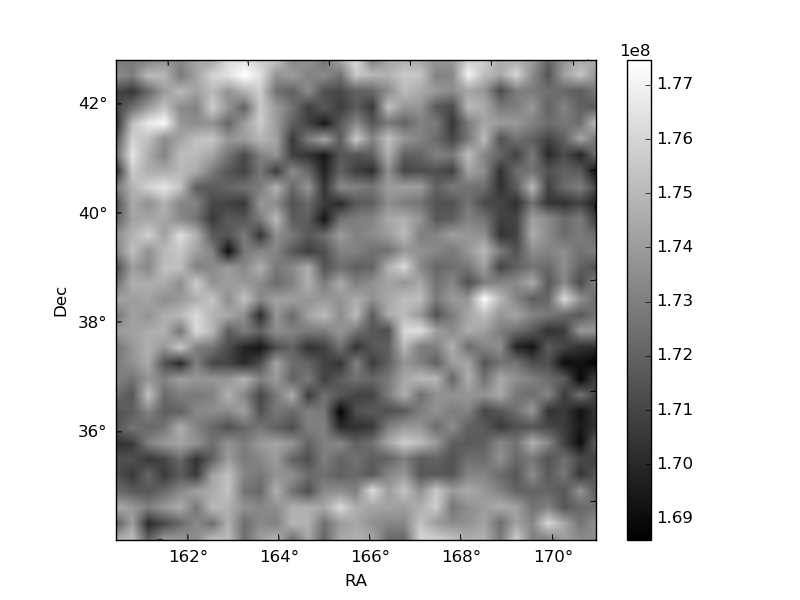
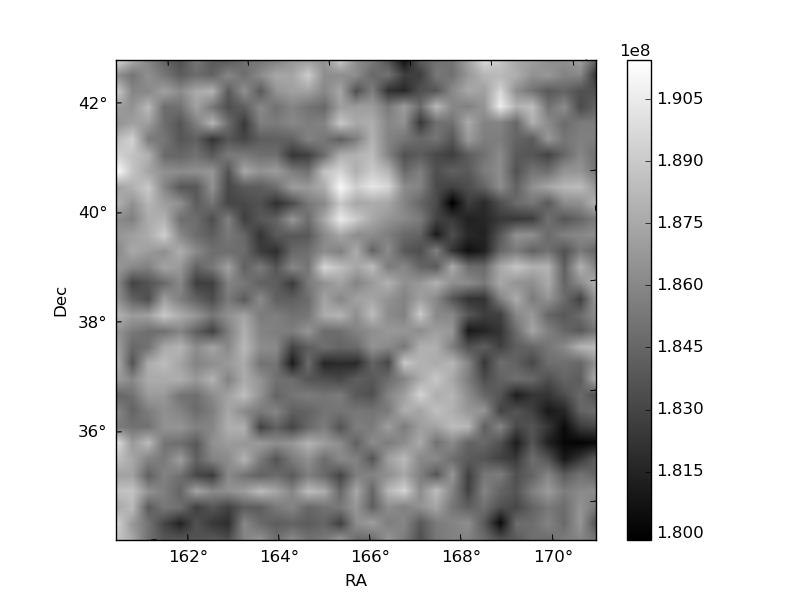
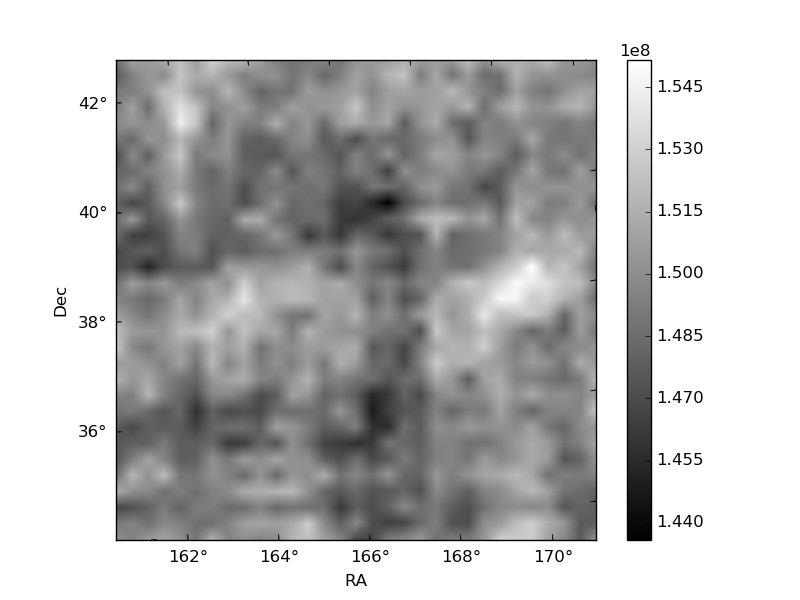
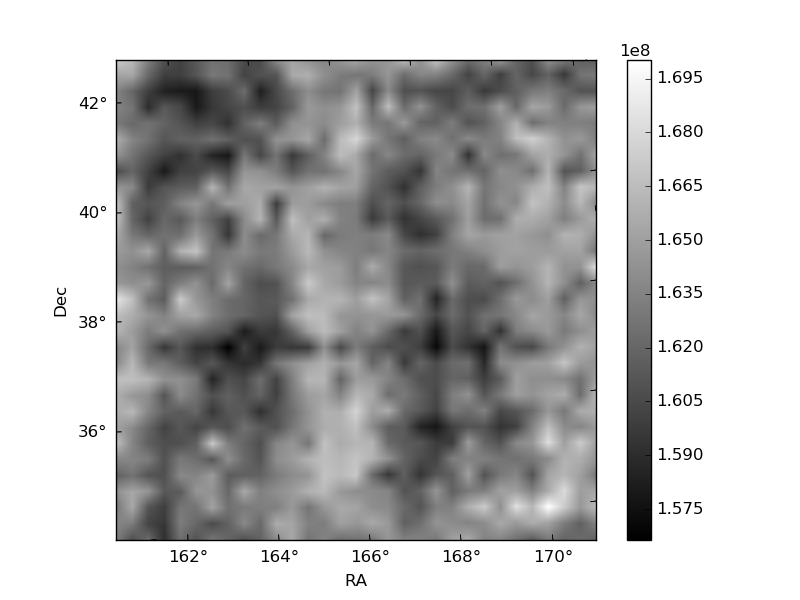
Histogram calculated using DETX and DETY for each event in the final _common_clean file
| Quadrant A | 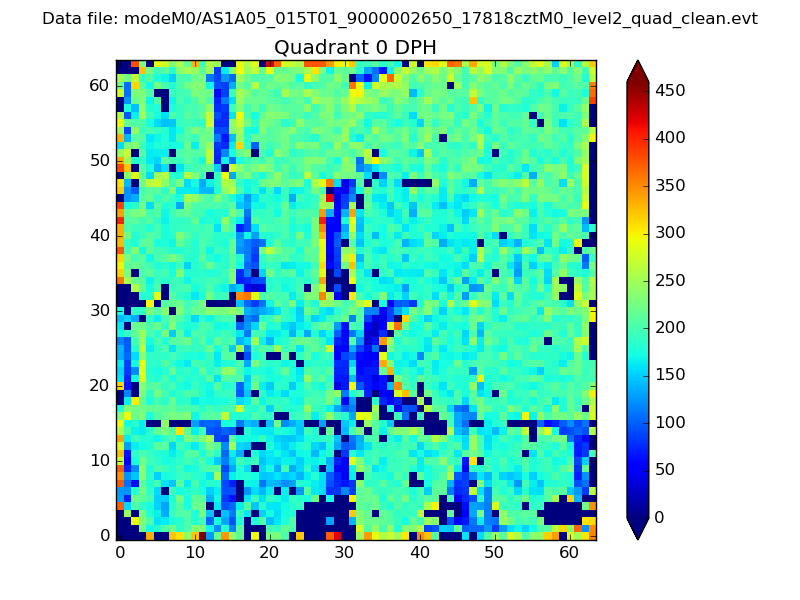 |
 |
Quadrant B |
|---|---|---|---|
| Quadrant D | 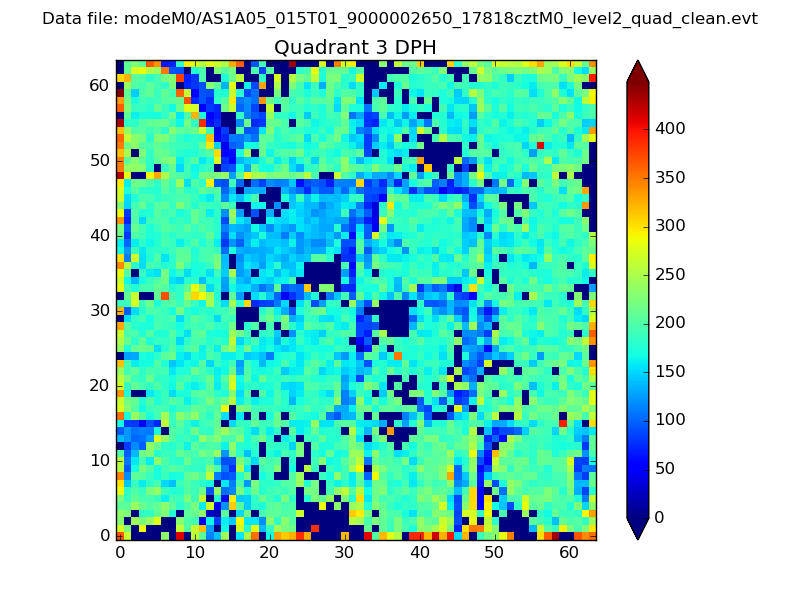 |
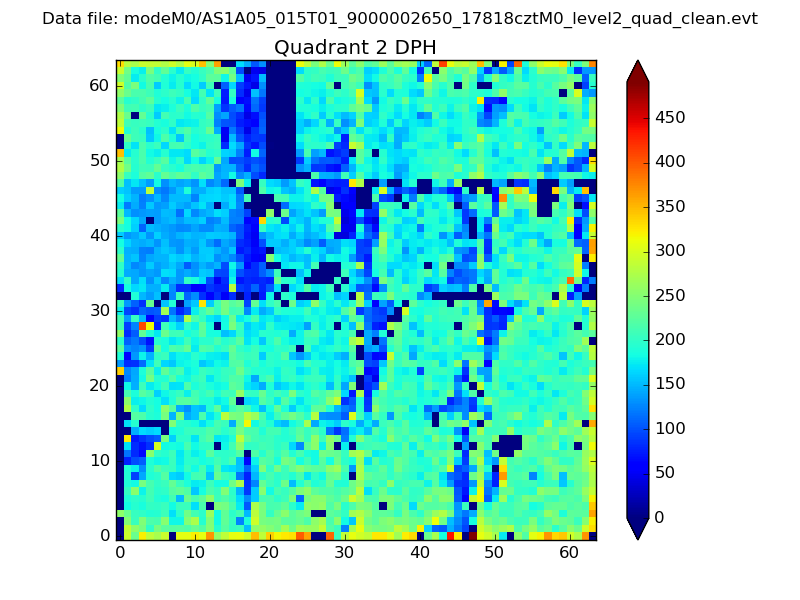 |
Quadrant C |
| Plot type | Count rate plots | Images |
|---|---|---|
| Comparison with Poisson distribution Blue bars denote a histogram of data divided into 1 sec bins. Red curve is a Poisson curve with rate = median count rate of data. |
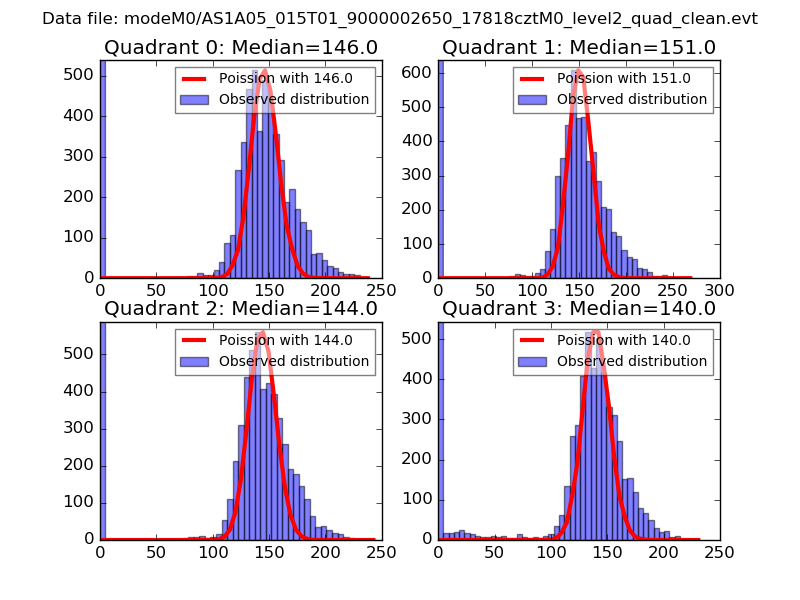 |
 |
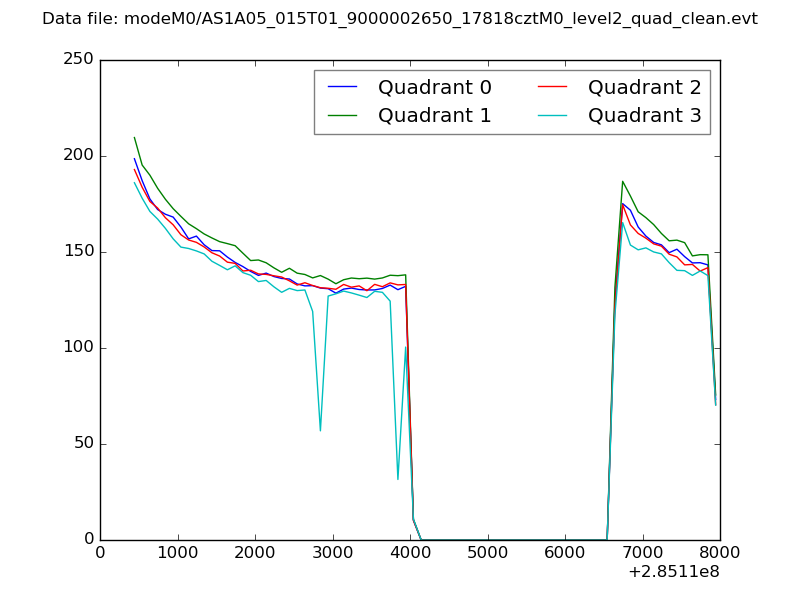
| Quadrant-wise count rates Data is divided into 100 sec bins |
 |
|
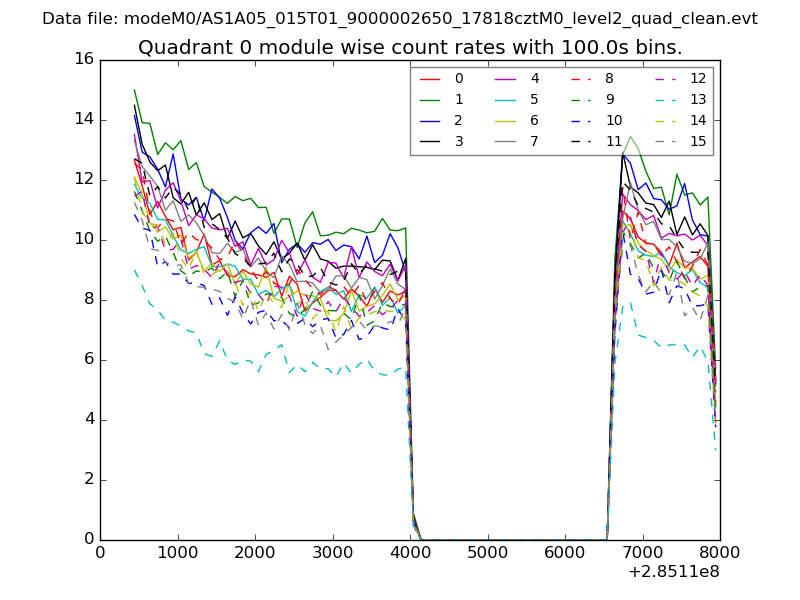
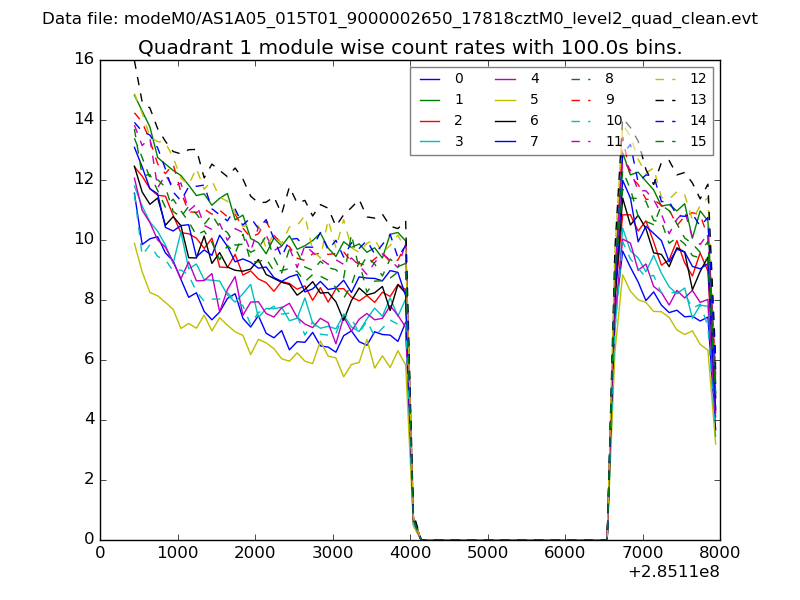
| Module-wise count rates for Quadrant A Data is divided into 100 sec bins |
 |
 |
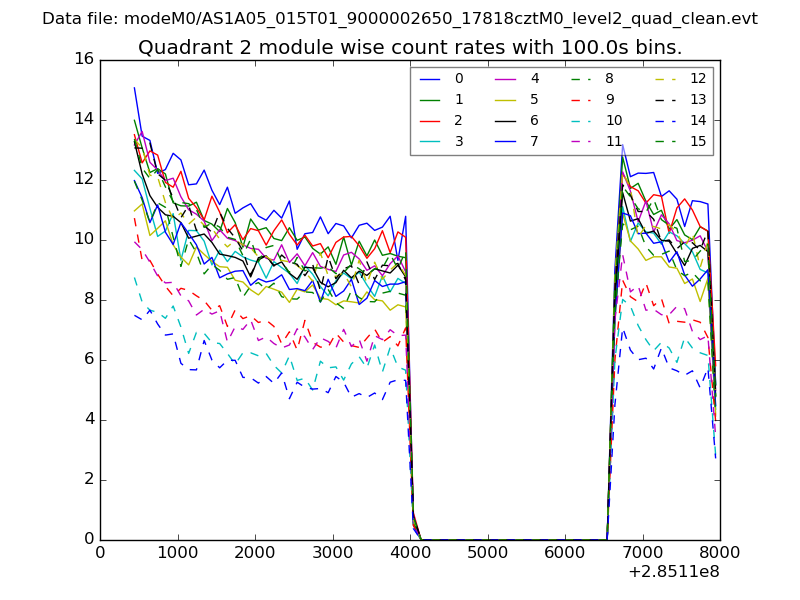
| Module-wise count rates for Quadrant B Data is divided into 100 sec bins |
 |
 |
| Module-wise count rates for Quadrant C Data is divided into 100 sec bins |
 |
 |
| Module-wise count rates for Quadrant D Data is divided into 100 sec bins |
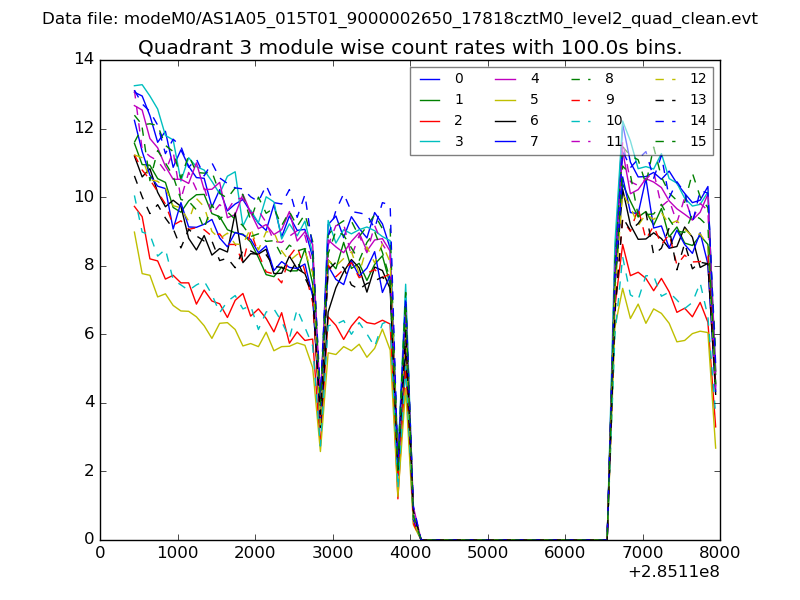 |
 |
| Parameter | Plot |
|---|---|
| CZT HV Monitor | 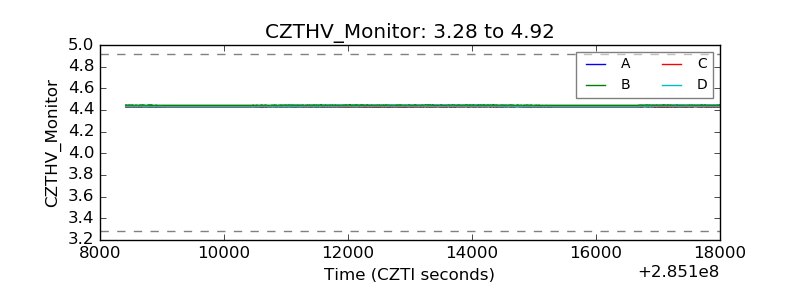 |
| D_VDD | 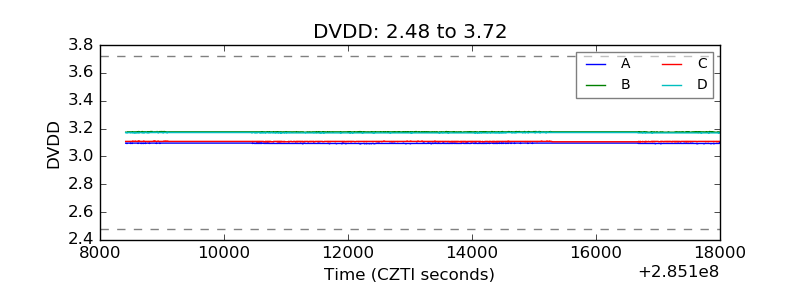 |
| Temperature 1 | 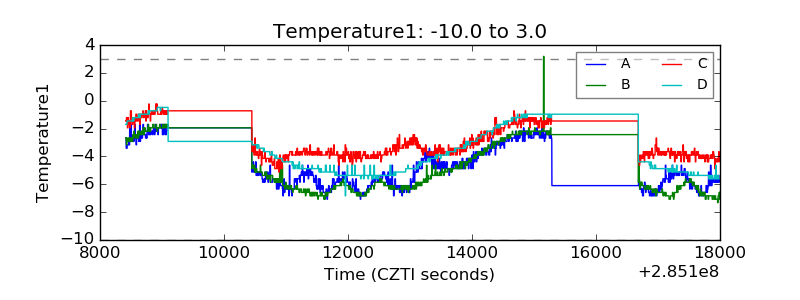 |
| Veto HV Monitor | 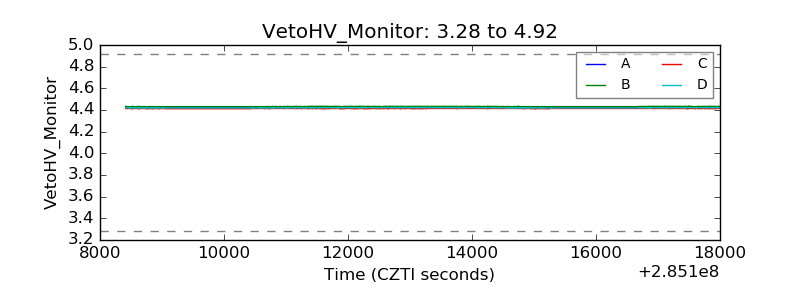 |
| Veto LLD | 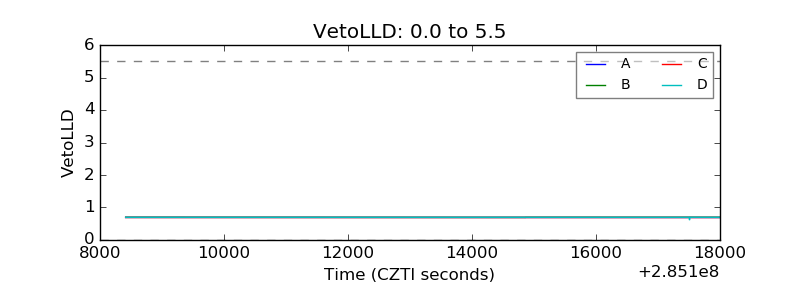 |
| Alpha Counter | 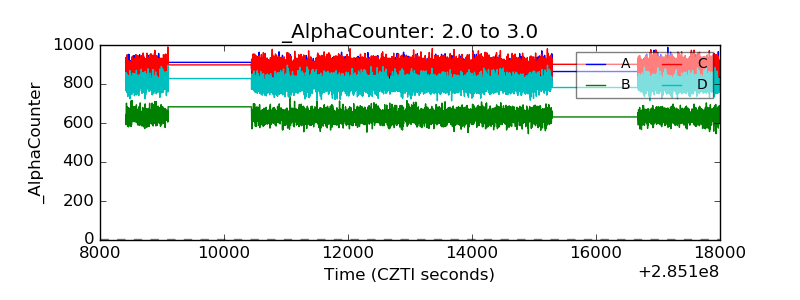 |
| _CPM_Rate | 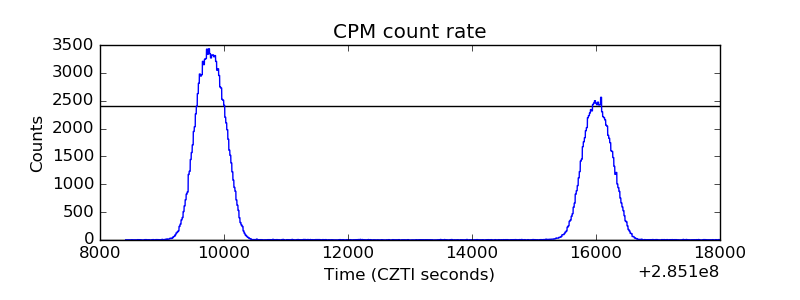 |
| CZT Counter | 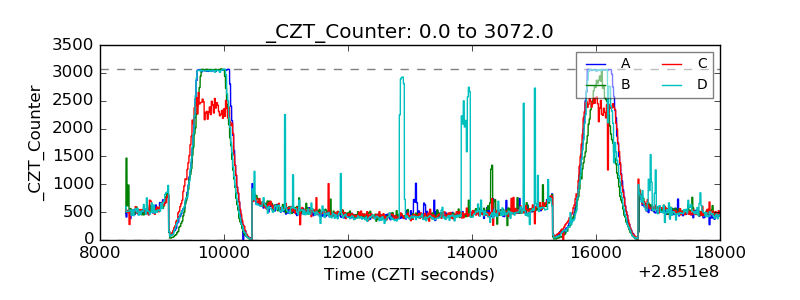 |
| +2.5 Volts monitor |  |
| +5 Volts monitor |  |
| _ROLL_ROT | 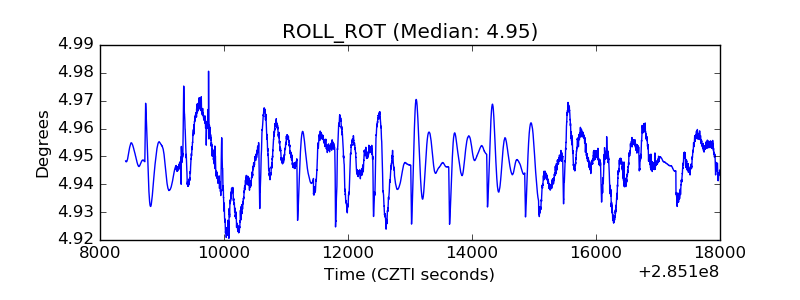 |
| _Roll_DEC |  |
| _Roll_RA | 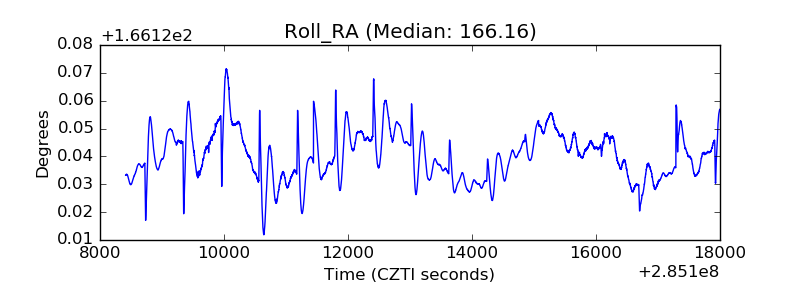 |
| Veto Counter | 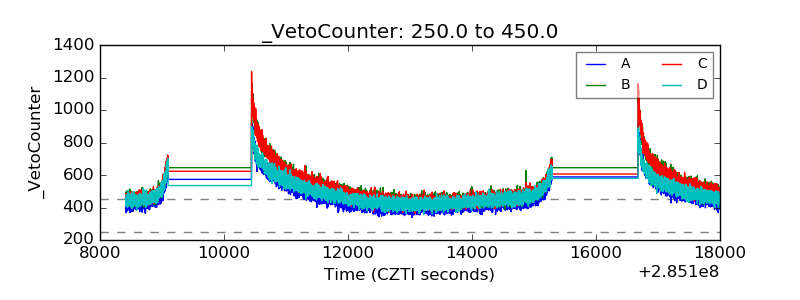 |